
Last week, the BC Government dropped a press release linking to 2019’s data from the NDP’s Speculation & Vacancy Tax (SVT), leaving us with two years of data (!) and including a brief analysis of what happened to properties taxed in 2018! Maybe you didn’t notice? It was a busy week. I’ve been looking through the data and comparing across releases, and here are my big takeaways so far:
- Overall, tax liability remains very rare (< 1%), and seems to be getting more so
- The 2019 Technical Report revises some of the 2018 taxpaying figures, generally downward
- The SVT may have added some rental in 2019, but probably not as much as claimed
- Best guess: probably because we never had much “toxic demand” to begin with…
- There’s some hint the SVT might have promoted divorce a bit & probably also migration
- Some errors and lapses in SVT reporting make interpreting the data harder than it should be!
Before expanding on these takeaways, a quick re-cap is probably in order. The BC’s Speculation & Vacancy Tax (SVT) is effectively an additional property tax on empty dwellings (set at a higher rate for non-Canadian owners) coupled with an additional property tax on transnational families (a.k.a. “satellite families”) where the primary income earner files their income taxes outside of Canada. The SVT was brought in by the NDP government in 2017 as a means of combating “toxic demand,” with the idea that investors were leaving residential properties empty and driving up housing costs for BC residents in selected areas of the province (mostly Metro Vancouver, but also further up the Fraser Valley, inland in the Central Okanagan, and on the Island around Greater Victoria and Nanaimo). The SVT was layered over top of the Foreign Buyer Tax (a property transfer tax paid only at point of sale) brought in by the BC Liberals in 2016. Within the City of Vancouver the SVT was also the layered over the Empty Homes Tax (a simple additional property tax on empty dwellings), also from 2016.
Here are the SVT Technical Reports I’m comparing from 2018 and 2019 (with a separate file broken down by municipalities in 2019). So what does a second year of BC’s Speculation and Vacancy Tax data show? First off, the big finding: for the second straight year in a row, the data demonstrate there’s little “toxic demand” to be found in high demand parts of BC. In both 2018 and 2019, significantly less than one percent of properties fall in taxed (non-exempt) categories.
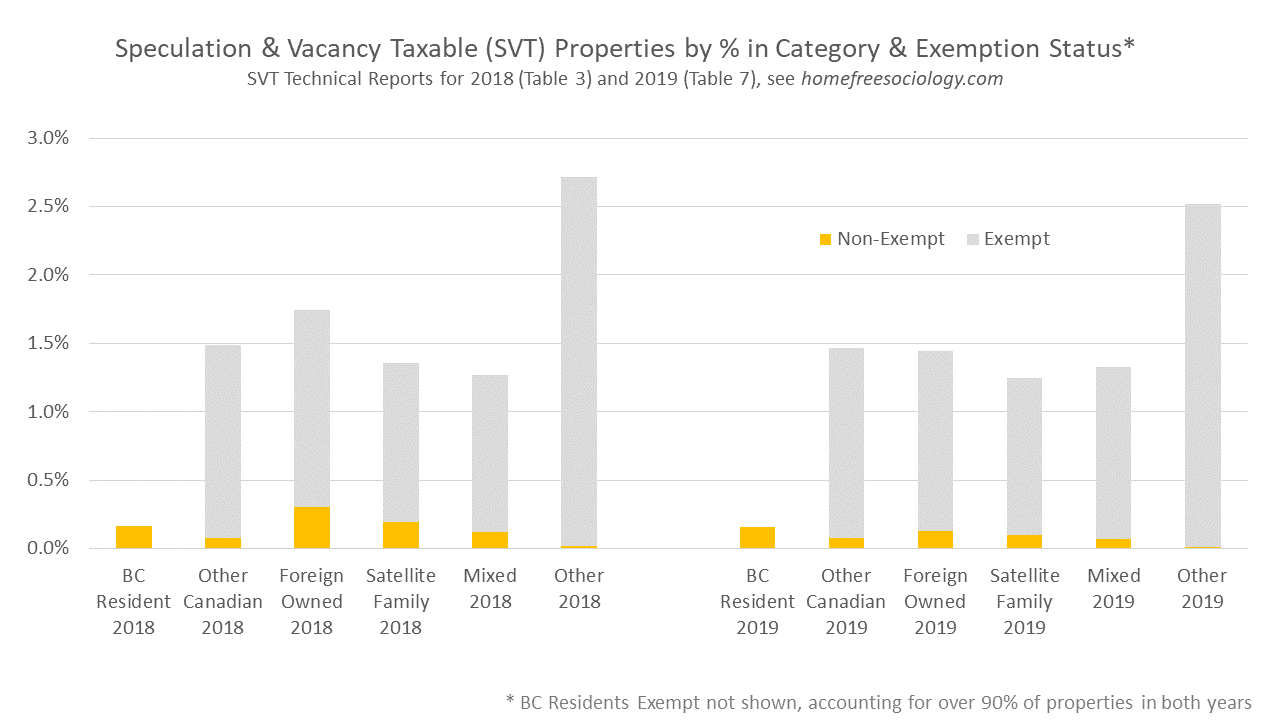
In all property categories created by the SVT, the vast majority of properties are exempt from the tax, regardless of ownership. Those not exempt from the tax provide us a measure of “empty dwellings” except for the “satellite family” category, where residents may owe the tax even when they live in the property. Overall, less than half a percent of properties are empty or owned by satellite families in 2019. The biggest decline in taxed properties by category appears in the “Foreign Owned” category, though taxed “Satellite Family” and “Mixed” ownership properties have also declined.
We can turn from properties to look at owners paying the SVT. These are somewhat easier to track insofar as properties can have multiple owners (with multiple statuses, leading to some of the complicated categories above). Looking at owners fitting into different categories across SVT reports, we get our first hint that the 2019 update also includes revisions to the 2018 data. In nearly every case, the number of owners owing tax in 2018 were downwardly revised by 2019. For the 2019 data, the number of owners owing tax dropped further.
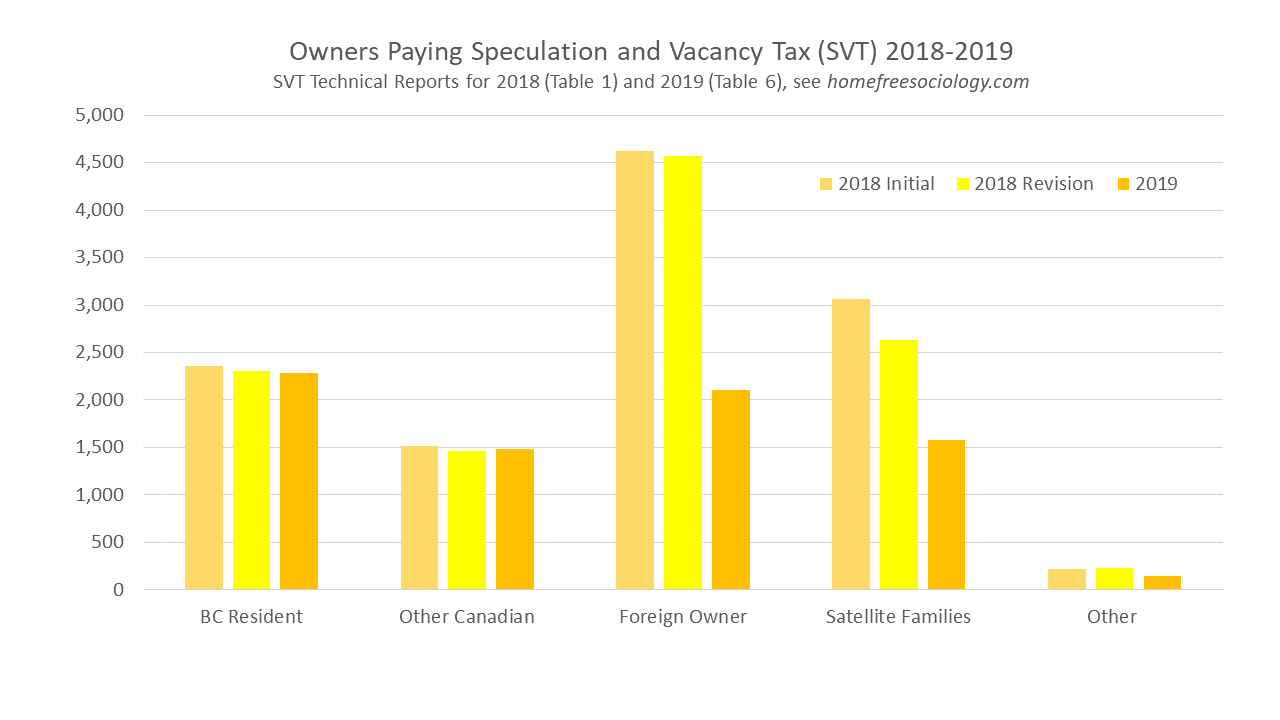
The gradual decline in owners subject to the SVT, both across revisions to the 2018 data and across years extending into the 2019 data, suggests that the more closely we look at files, the fewer owners owing tax we find. This is the opposite of what we’d expect if close scrutiny of files revealed a great deal of evasion. If that were the case, revisions would be expected to increase the number of taxpayers.
The vast majority of exemptions from the SVT are in the form of either “principal residence” (for people who live in the properties they own) or “occupied by tenant” exemptions, either indicating the property is lived in (or at least contracted for living in) for at least six months of the year. A close look at both SVT reports reveals that those claiming these two exemptions have gradually risen, both through revisions to the 2018 report and through the 2019 calendar year.

The rise in exemptions from the tax due to occupation by a tenant between 2018 and 2019 offers one measure from the SVT data of how many dwellings might have been brought back into the rental market through the incentives of the SVT (Table 5). But exemptions are tricky, insofar as multiple exemptions may be applied to the same property. Another measure of how many dwellings were brought back into the rental market by the SVT could be found in directly examining how many properties paying the tax in 2018 were subsequently rented out in 2019 (Table 10). Interestingly, the 2019 SVT Technical Report does not draw upon either of these measures, derived from SVT data contained. Instead the report (p. 3) references a CMHC Report on the Secondary Rental Market in Metro Vancouver examining existing condos newly added to the CMHC’s rental universe in 2019. Lining up different estimates of how many dwellings might’ve been induced back into the rental market by the SVT suggests why… the CMHC report’s estimate – even focusing only on Metro Vancouver – is the highest. Unfortunately, it’s also probably the most flawed as a measure of SVT effects, both insofar as those effects aren’t measured directly, and insofar as the bump in units entering the rental market may have arisen from changes in reporting to CMHC rather than changes in actual rentals.
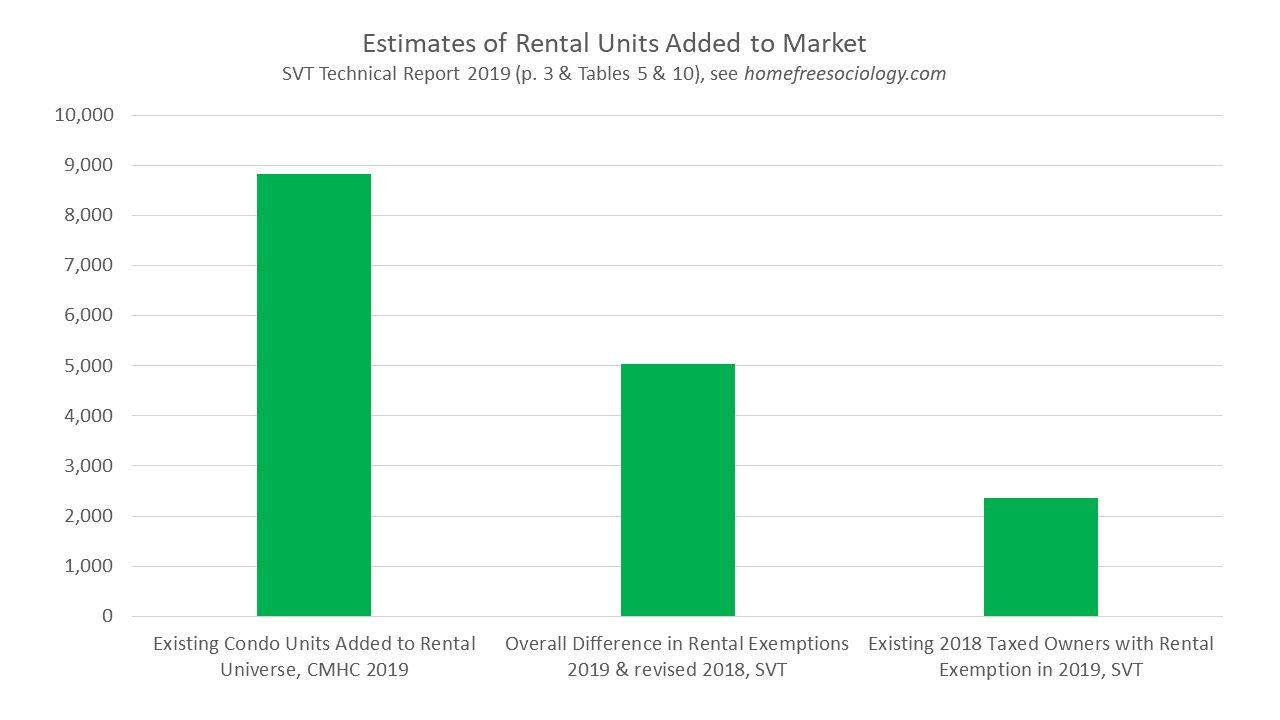
Overall, it’s likely that the SVT induced more dwellings into the rental market in 2019, but probably not as many as claimed. That shouldn’t be too surprising given that the tax was already in place in 2018. Most units rented out in response to the SVT were probably already rented out prior to 2019. Unfortunately, we didn’t see the big rise in vacancy rates we might expect if a lot of dwellings had been added to the rental market in 2018 either. Nor can I discern sizable increases in dwellings offered for sale prior to the imposition of the Speculation and Vacancy Tax in 2018. Though it’s difficult to fully analyze the effects of the SVT on patterns prior to its arrival, there’s little to suggest much in the way of a great deal of “toxic demand” suddenly released as supply back onto the market. That said, and regardless of its effects on existing patterns, the SVT could still operate as a powerful prophylactic, preventing Vancouver from becoming a resort town of half-empty pied-a-terres for the wealthy. (As a potential future, it’s not so far-fetched – it looks kind of like Miami).
Let’s round out SVT reporting comparisons by looking at other exemptions claimed. These are magnitudes less common than exemptions for principal residence or occupancy by a tenant, plotted above. But they’re quite interesting nevertheless, often revealing the main reasons why dwellings get left empty. Most commonly, it appears, they’re just between residents, as when a property is newly acquired, being renovated, or under construction. Exemptions for “recent acquisitions or inheritances” rose between 2018 and 2019, likely simply reflecting annual variation in sales. Other properties actually have no residence built on them. An exemption for stratas with rental restrictions remains in place. Less commonly, special circumstances are granted to those where ownership remains in flux, and perhaps under dispute, as with divorces and deaths of an owner.
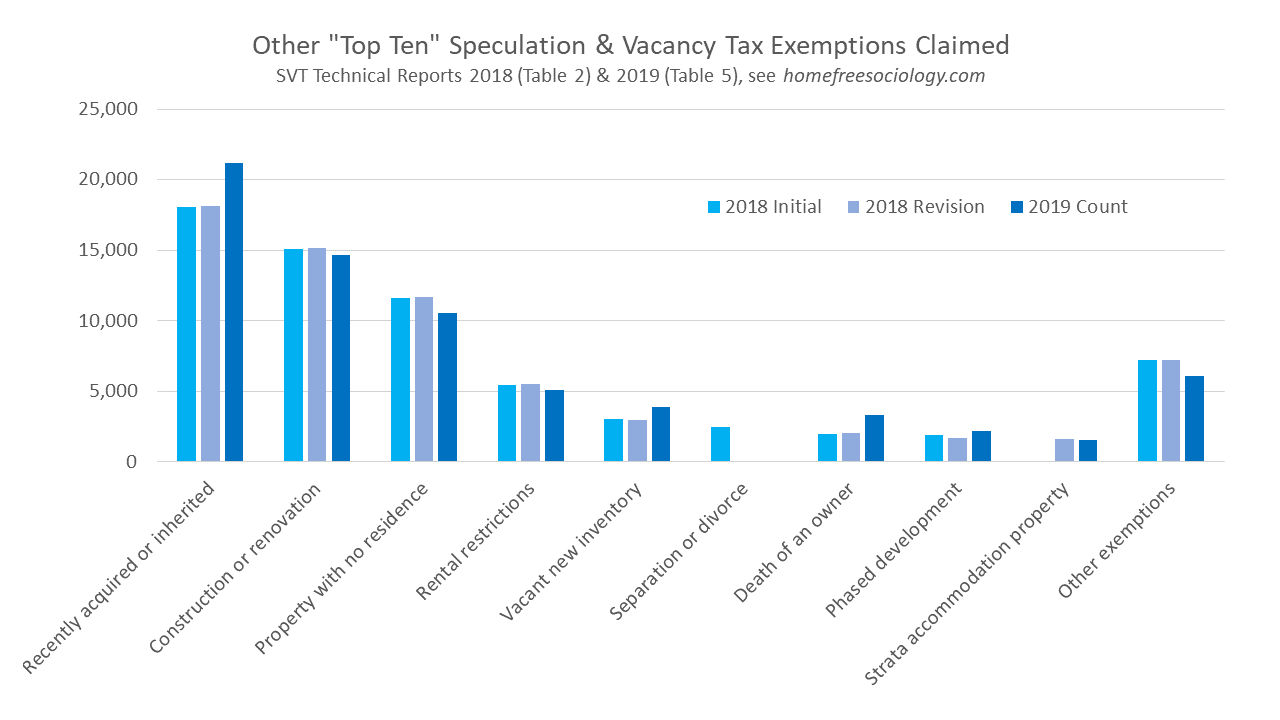
Divorces are especially interesting insofar as the initial 2018 release listed “separation or divorce” as the #8 most common exemption. In the 2019 release, “separation or divorce” no longer made the top ten, and had been scrubbed as an exemption in the 2018 revision as well. The scrubbing of “separation or divorce” from the revision probably reflects a simple process of drawing upon the top ten exemptions in 2019 and comparing backward (though this produces an error, insofar as the 2018 “separation or divorce” figures don’t appear to have been added back in as an “other exemption” update for 2018 revised figures, which is concerning). What’s the substantive impact of this little reporting glitch? Unfortunately it means we only get a hint at a possible effect of the SVT: a bump in separations or divorces. We have ample reason to expect such a bump for 2018. After all, the logic of the SVT as applied to “satellite families” is that it’s fine and totally forgivable to be separated from a spouse who jointly owns your home due to irreconcilable differences. But if one is separated from a spouse instead simply by their work in another country, that’s a “satellite family” and you’re subject to the tax. No surprise people might re-evaluate the nature of their relationships to their spouses in response to the SVT, temporarily bumping up separations and divorces. As with rentals, we might expect this response to be strongest in the first year of the SVT, subsiding (and hence moving down the list of exemptions) by 2019, which appears to be what we see above. Though trickier to establish, we would also expect immigration and migration as potential responses to the SVT, with owners moving to (or returning to) BC to avoid the tax. Many of these plans might simply speed up processes already happening anyway. Of note, more careful and consistent releasing of data would be needed to study these kinds of responses more closely.
Errors in the 2019 SVT report also plague the study of properties by ownership category. In my first chart (at the top), I use “non-exempt” figures from Table 7 in the SVT 2019 report rather than “total” non-exempt figures from table 8. Logically, these two figures should map perfectly on to one another (as the corresponding tables do in the SVT 2018 report), but in the SVT 2019 report they diverge quite a bit with respect to how properties were assigned into “other Canadian”; “foreign”; “satellite”; “mixed”; and “other” categories. Via comparison to 2018 figures and to Table 10, Table 7 looks like it contains the correct breakdown into categories. But here, too, errors in the 2019 SVT report make it difficult to confidently analyze the data. As noted above, the complicated matching of multiple owners to properties likely explains potential mismatches across tables, but it sure would be helpful if SVT reports took a consistent view of the matter!
Below I use figures from Table 7 in combination with Tables 10 and 11 to try and follow properties that were taxed in 2018 over time into 2019, to see what happened to them next. Though I’m critical of the SVT reporting errors (as above), it’s great that they provide this ability to follow properties for us! Here’s what I get…
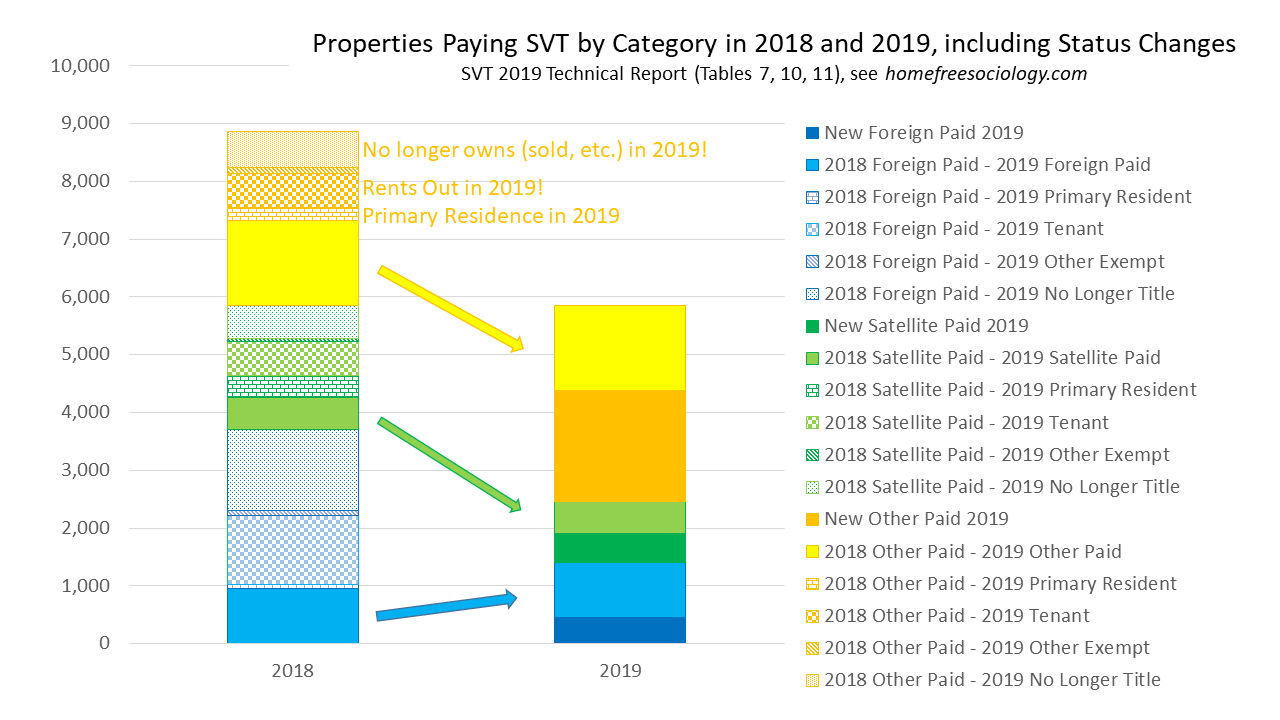
Overall, it appears that most of the properties paying the SVT in 2018 were no longer paying it in 2019. Mostly the owners in 2018 either moved into their properties by 2019, rented them out to someone else, or sold them off (or otherwise removed their name from the title). Selling or renting were the most common strategies for Foreign Owners, accounting for most properties, but a minority simply held onto their property and paid the tax for another year. Satellite Families were more evenly split, between claiming as a primary residence in 2019, selling, renting out, or simply paying the tax again in 2019. Some of the difficulties in classification here continue to plague a full understanding, but the fact that satellite families were the most likely to transition into a primary residence exemption likely reflects some combination of marital and migratory responses to the SVT, as discussed above. Other Owners (here including BC Residents, Other Canadians, Mixed, and Other categories) mostly rented, sold, or paid the tax again. Way more Other Owners paid the tax again than for other categories, likely reflecting, in part, the lower tax rates they generally paid under the SVT structure. For similar reasons, we see many more Other Owners – reflecting mostly BC Residents – added as new taxpayers in 2019 than for other categories. The tax seems to have been most effective at driving out the (relatively rare) “empty” properties of Foreign Owners, but new “empty” properties with domestic owners seem to have replaced at least some of those Foreign Owners as tax-payers.
Overall, it’s great to see more Speculation and Vacancy Tax data out, warts and all! It probably continues to be our best source of data about “problem empties” across high demand regions of the province, and also potentially – with a bit more care – could give us new insights into underlying housing, migration, and family processes.
