
(co-authored with Jens von Bergmann & cross-posted over at mountainmath)
The province has released (via press release) the first data on its Speculation and Vacancy Tax (SVT)! Huzzah!
Previously, we’ve speculated on what this data would show. In particular, we estimated that around 8,800 dwellings would show up as empty in a way likely to be taxed by the speculation tax. How close were we? Well, the speculation tax has so far identified 8,738 owners of empty properties. Hot damn! We’re on a roll!
But wait! No celebrating yet. It’s early days, and two issues remain to be resolved:
1. The province seems to identify owners owing taxes in its press release rather than properties owing taxes. There can be more than one owner per property! (And more than one property per owner…). On average, CHSP data suggests that there appear to be about 1.58 owners per property in major metro areas covered by the tax (e.g. family members co-owning properties, investors, etc.). That may mean that the 8,800 dwellings we thought would appear empty should correspond to 13,904 owners – and so far we’ve only found 8,738, so we’re still short!
2. There are around 23,000 undeclared taxfilers out there, so figures for owners of empty properties may rise. We really don’t know anything about these undeclared filers. The province, so far, has not identified them as likely speculators. Instead the press release goes out of its way to reassure those who haven’t filed that they’ll be contacted by the Province about applying for an exemption. It’s possible that late declarations are late for reasons unrelated to the tax (e.g. forgetfulness, hospitalization, death), in which case undeclared filings will probably come in similar to declared filings, with maybe another 180 taxed owners added. Similarly, it’s possible that late declarations reflect overlapping ownership claims and property owners’ assumptions that someone else had already declared on their behalf. Or it could be that late filings disproportionately reflect owners with limited ties to the province, boosting the number of vacancies likely to be discovered. It would appear that over one-fifth of late filers of the City of Vancouver’s Empty Homes Tax, for instance, ultimately ended up paying the tax (a much higher proportion than for those who filed on time). This kind of ratio, of course, could add another 4,500+ owners of empty properties if applied to the late filers. In other words, we’d end up pretty close to the 13,904 owners we initially projected (based on 8,800 dwellings showing up empty).
So we’ve learned that our estimates are at least going to end up in the ballpark in terms of vacant properties declared to the province. In addition, we’ve got data on where owners of vacant properties appear to reside as citizens (within BC, elsewhere in Canada, or outside of Canada) and we get our first look at declared satellite families. To date, we’ve had very few ways of estimating the size of the latter population. The tax defines satellite families as those earning more than half of their combined spousal incomes outside of Canada (hence undeclared on Canadian income taxes). Rather than attempting to estimate this directly, we mostly played around with the kinds of situations (mismatches between incomes and property values) likely to trigger audits in case people didn’t file as satellite families. As we discuss in our earlier post, there are many reasons why people may end up in satellite family arrangements. It is probably more productive to think of the component targeting satellite families as complementing federal tax law that is quite ineffective in taxing worldwide income of residents, although the SVT can only capture homeowners and determining residency for transnational families is inherently complicated.
The data that we’ve got so far may change, of course, both as remaining undeclared owners file and as audit systems begin to look through cases. But to put the data in context, let’s plot our preliminary declarations data against what we know about properties overall in the areas covered by the tax. Here we compare CHSP data on property ownership, residency of owner, and owner-occupation with the declarations from the Speculation Tax so far. Note that CHSP data and SVT data have different bases, the former is based on properties, while the latter is based on declarations, so property cross owners. This means we can look at all of the properties that are owner-occupied in the taxable region and compare them to the number of owner-occupiers declaring themselves part of satellite families, as in the first two columns below. You have to squint to see that second column, because compared to all owner-occupied properties in the region (800,000+), the number of declared satellite family owner-occupiers is very small (3,241).
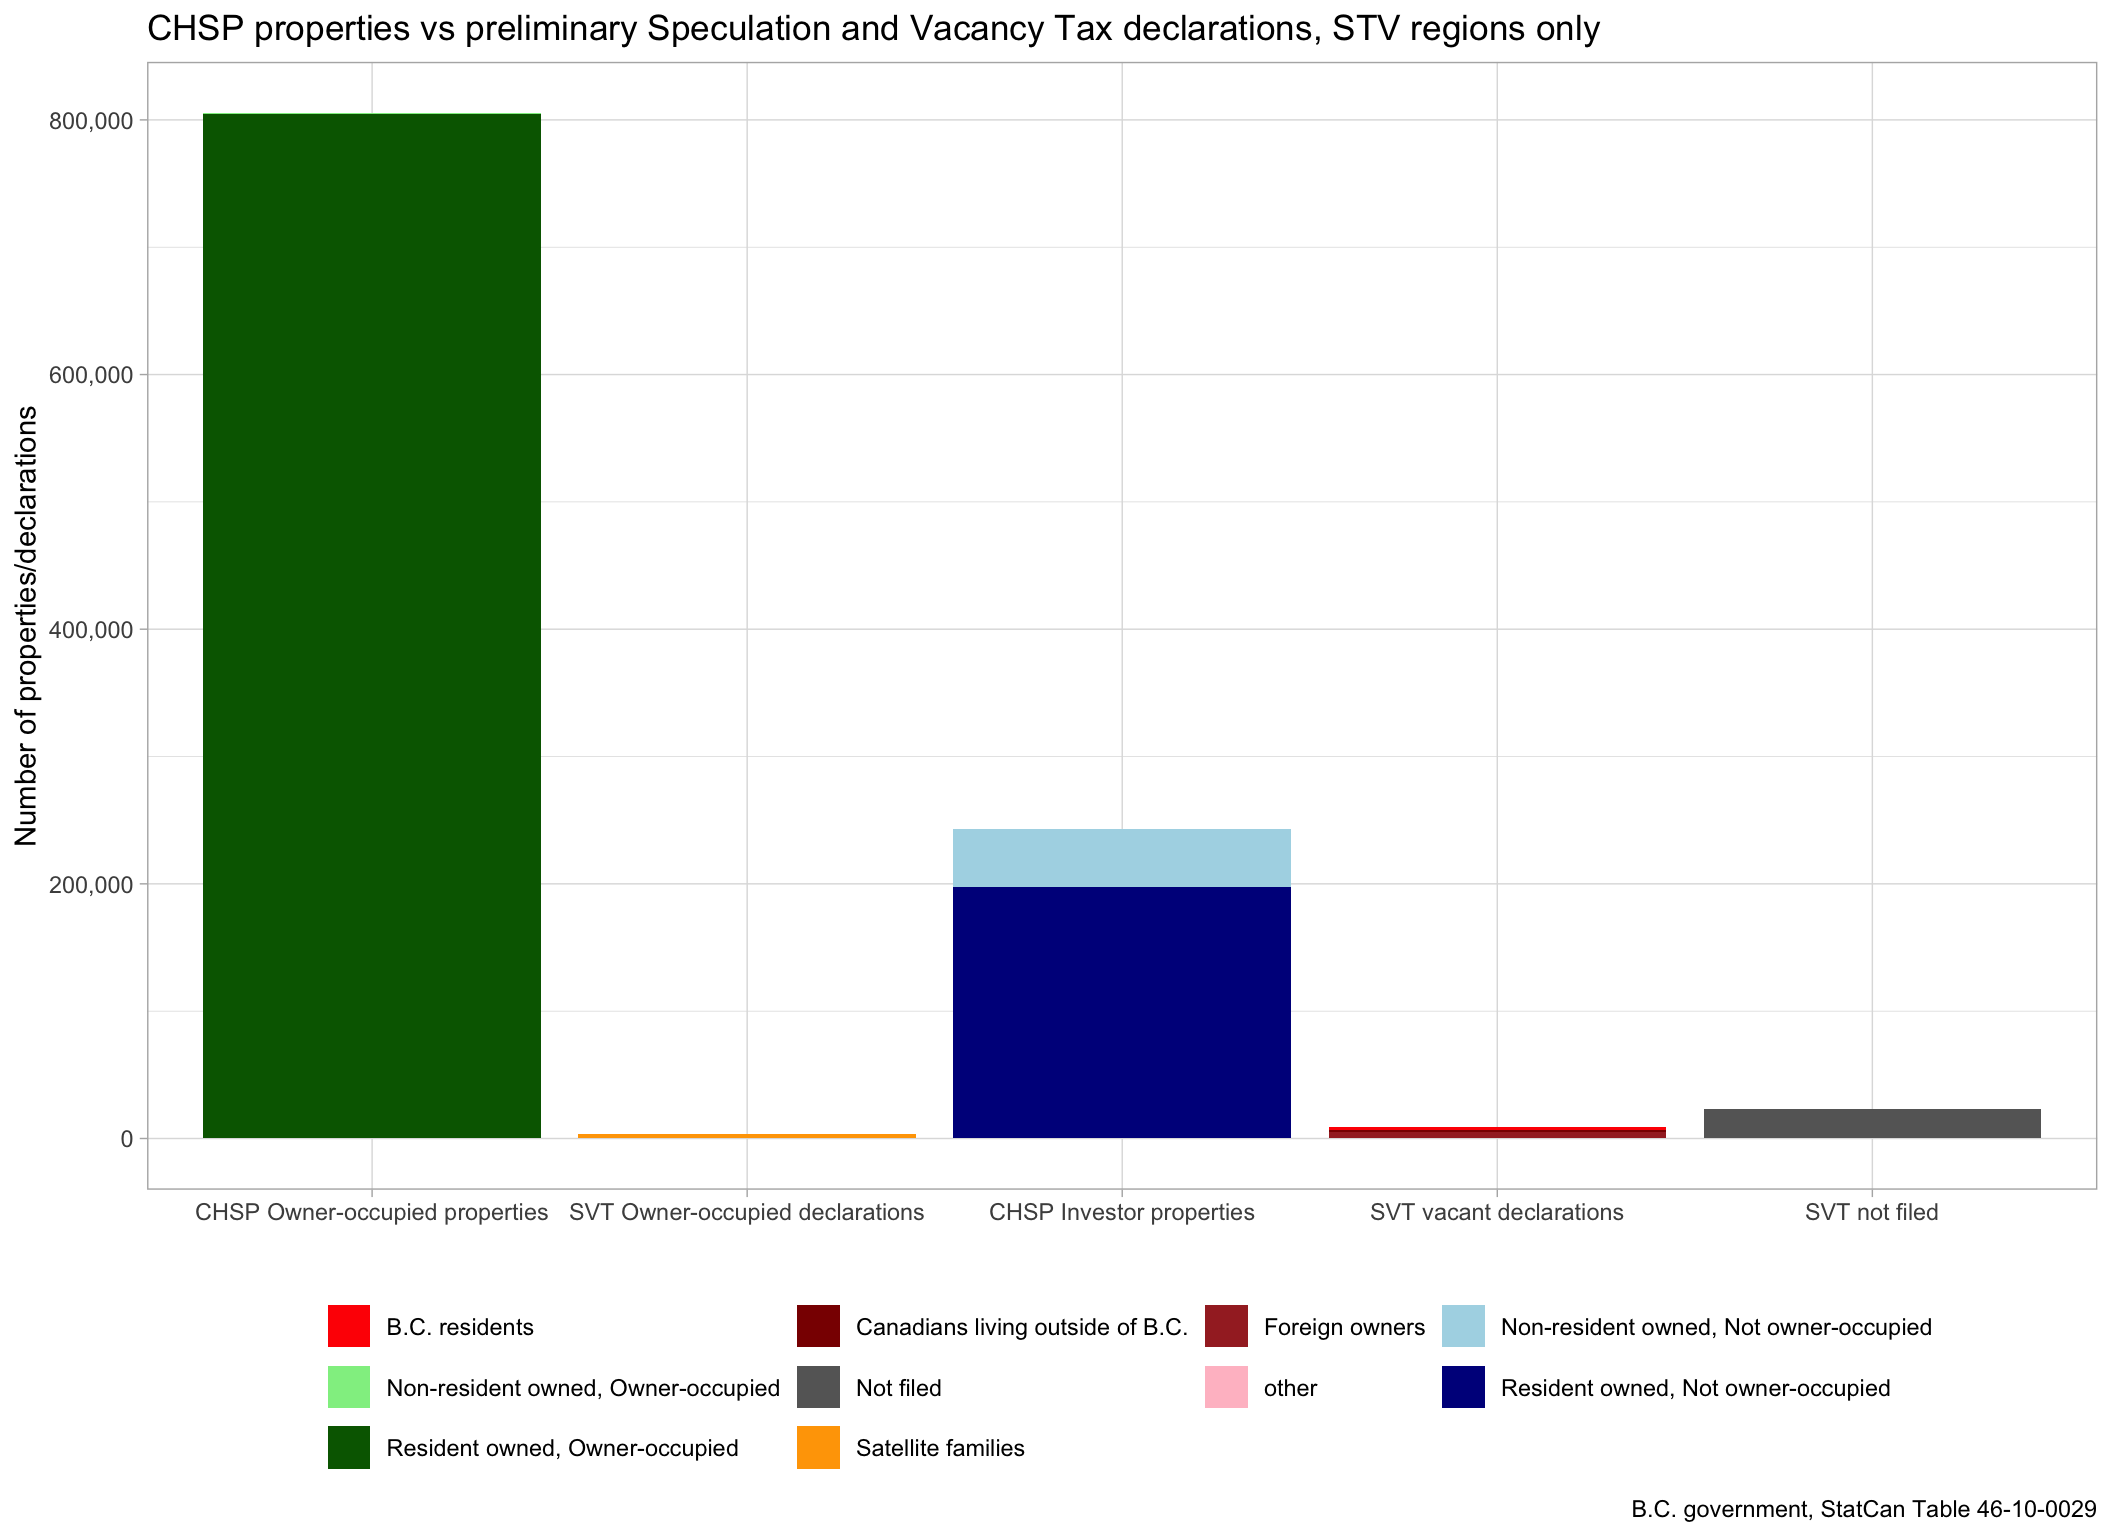
We can make the same basic comparison for the number of properties that are investor owned (which we use as a catch-all for any non-owner-occupied property). Through the CHSP data, the non-resident (“overseas”) investor-owners can be distinguished from those residing in Canada. They’re much smaller in number, but they’re definitely part of the mix. We can compare the number of investor-owned properties to the number of owners declaring a vacant property subject to the Speculation and Vacancy Tax. Comparing, it would appear that the vast majority of investor-owned properties are not left vacant for the length of time needed to trigger the tax. Instead almost all appear to be rented out, making up a sizeable proportion of rental stock.
As we also discussed in our Speculation post, we didn’t know the overlap between properties left “empty” and those deemed “foreign-owned.” Now we do! It’s hard to see it in the figure above because the declaration numbers are so tiny, but owners declaring vacancies that show up in the Speculation Tax data look like they’re just over half foreign (see also figure below). Some owners may be holding for purely speculative reasons, some may be running short-term rentals, some affluent investors may have second (or third) vacation homes in the area. Other owners may be stuck in transitions of various kinds not covered under the Speculation Tax exemptions. What’s clear from the figures is that owners of vacant properties are few in number compared to investor-owned properties overall. Of course, some properties may have been rented out as a means of avoiding the tax, and as with the City of Vancouver’s Empty Homes Tax, we’d suggest that this aspect of the tax is worth supporting, even if the overall numbers of people paying remain small. As a bonus, the proceeds from the tax are earmarked for affordable housing!
Let’s return to our fudge factor to put properties and owners are the same footing. If we assume, based on estimates from CHSP data (detailed below) that there are 1.58 owners per property, then we get a total of 1,655,243 owners overall required to make declarations, using 1,048,290 residential properties from the CHSP data as a base. That probably over-estimates to total number of declarations required, as not all residential properties are required to declare their SVT status. Still, this matches reasonably well with the “1.6 million” letters on how to apply for exemptions it appears the government expected to send out back in January. Using this figure as our base, we can estimate the percentage of all owners who’ve so far declared themselves as members of satellite families or owners of a vacant property. What’s that look like?

Declared satellite family members make up less than a quarter percentage point of owners overall. Owners of vacant properties make up just over half a percentage point. Together, taxed owners are less than one percent of owners overall. While these numbers might still change, depending on the late declarations (<1.5% of owners) and possible audits, as well as variations in number of owners per property in each sub-category, the findings so far demonstrate a much broader point: The situations subject to the Speculation and Vacancy Tax probably are rare, and probably aren’t contributing a great deal to BC’s housing crises.
It would appear that “toxic demand” in the form of Satellite-Family-Foreign-Owned-Empty-Dwellings just aren’t all that big a thing, and we should probably stop blaming foreigners and transnational families for our housing woes (especially given the toxicity such blame spreads to discussions of race and immigration in Vancouver). As always, there remain caveats to our assessment. The data isn’t final yet. And there may be some geographic clustering, or clustering by property types, so the impact may be somewhat bigger in very specific sub-markets. Single family homes on the west side of Vancouver, or in West Vancouver, have been identified as especially subject to “toxic demand” before. Once we get better numbers we will have a clearer picture of this, but these sub-markets that soak up most of the attention aren’t the main battle grounds of our affordability crisis, but rather speak to a crisis of certain professionals’ sense of entitlement. Until we learn more, let’s keep our vacancy tax. But let’s also keep our eyes on the prize of achieving broad regional affordability across a diverse housing stock, moving forward to provide serious answers to the questions of how we should make room, meet housing needs, and build enough housing to promote a more inclusive BC for everyone.
Appendix
To get our fudge factor we look at the differences between CHSP data on owners and data on properties. On average across our CMAs there are about 1.58 owners per residential property, which may be a slight under-estimate as the data does not provide details for properties with more than three owners on title.
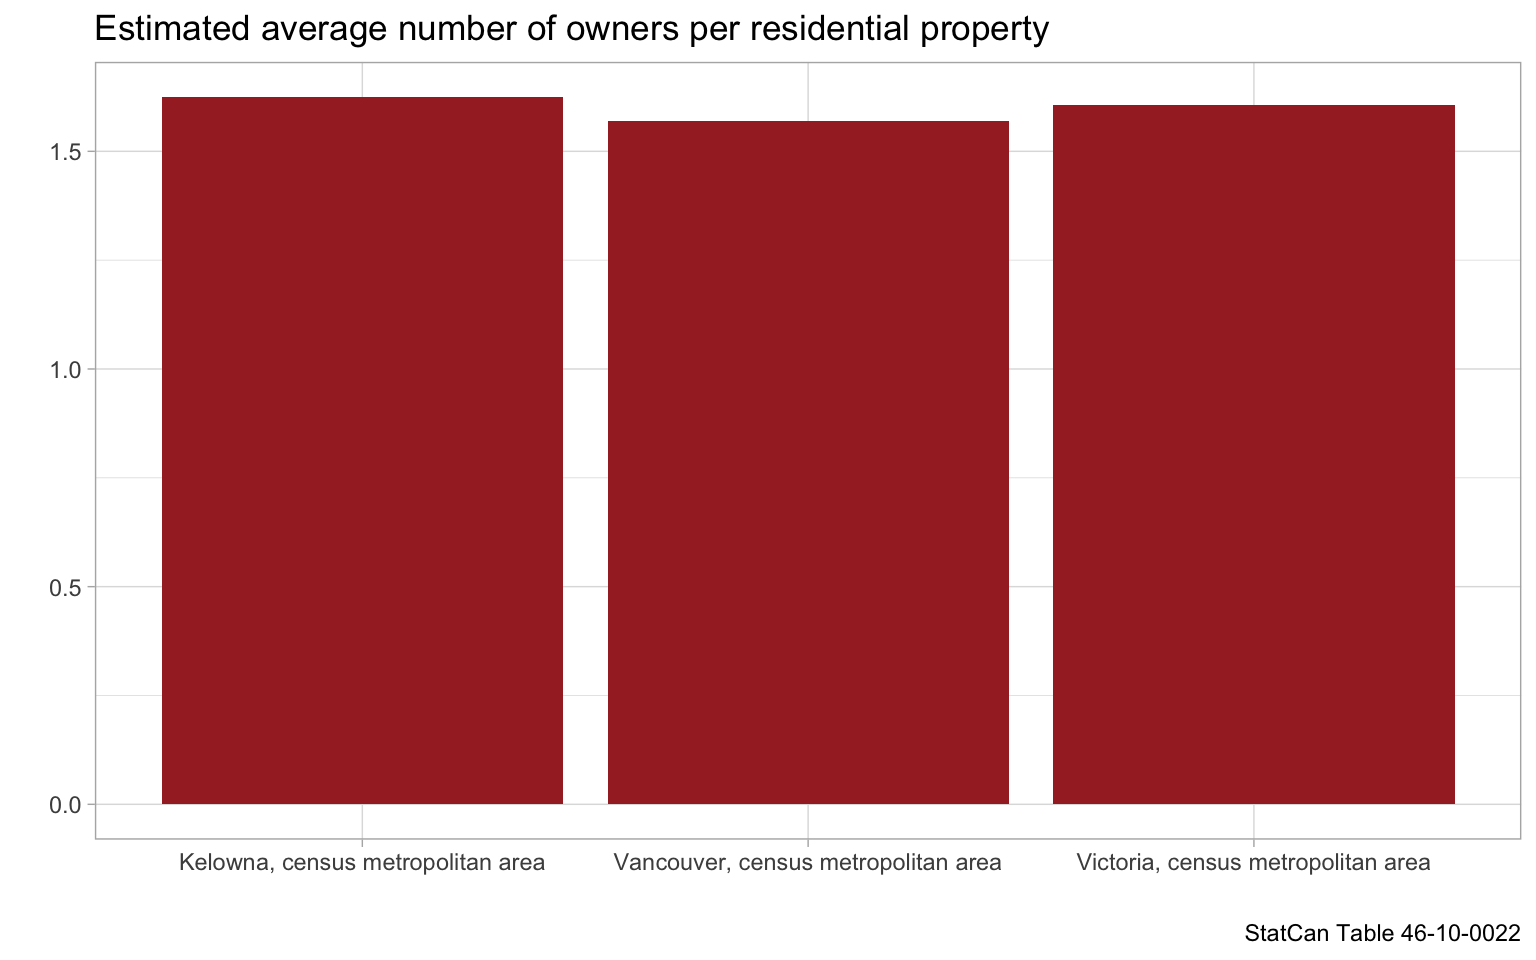
A quick check across metro areas affected by the SVT confirms that there is little geographic bias. In summary, there are no significant differences in how many owners are on title across CMAs or residency participation.
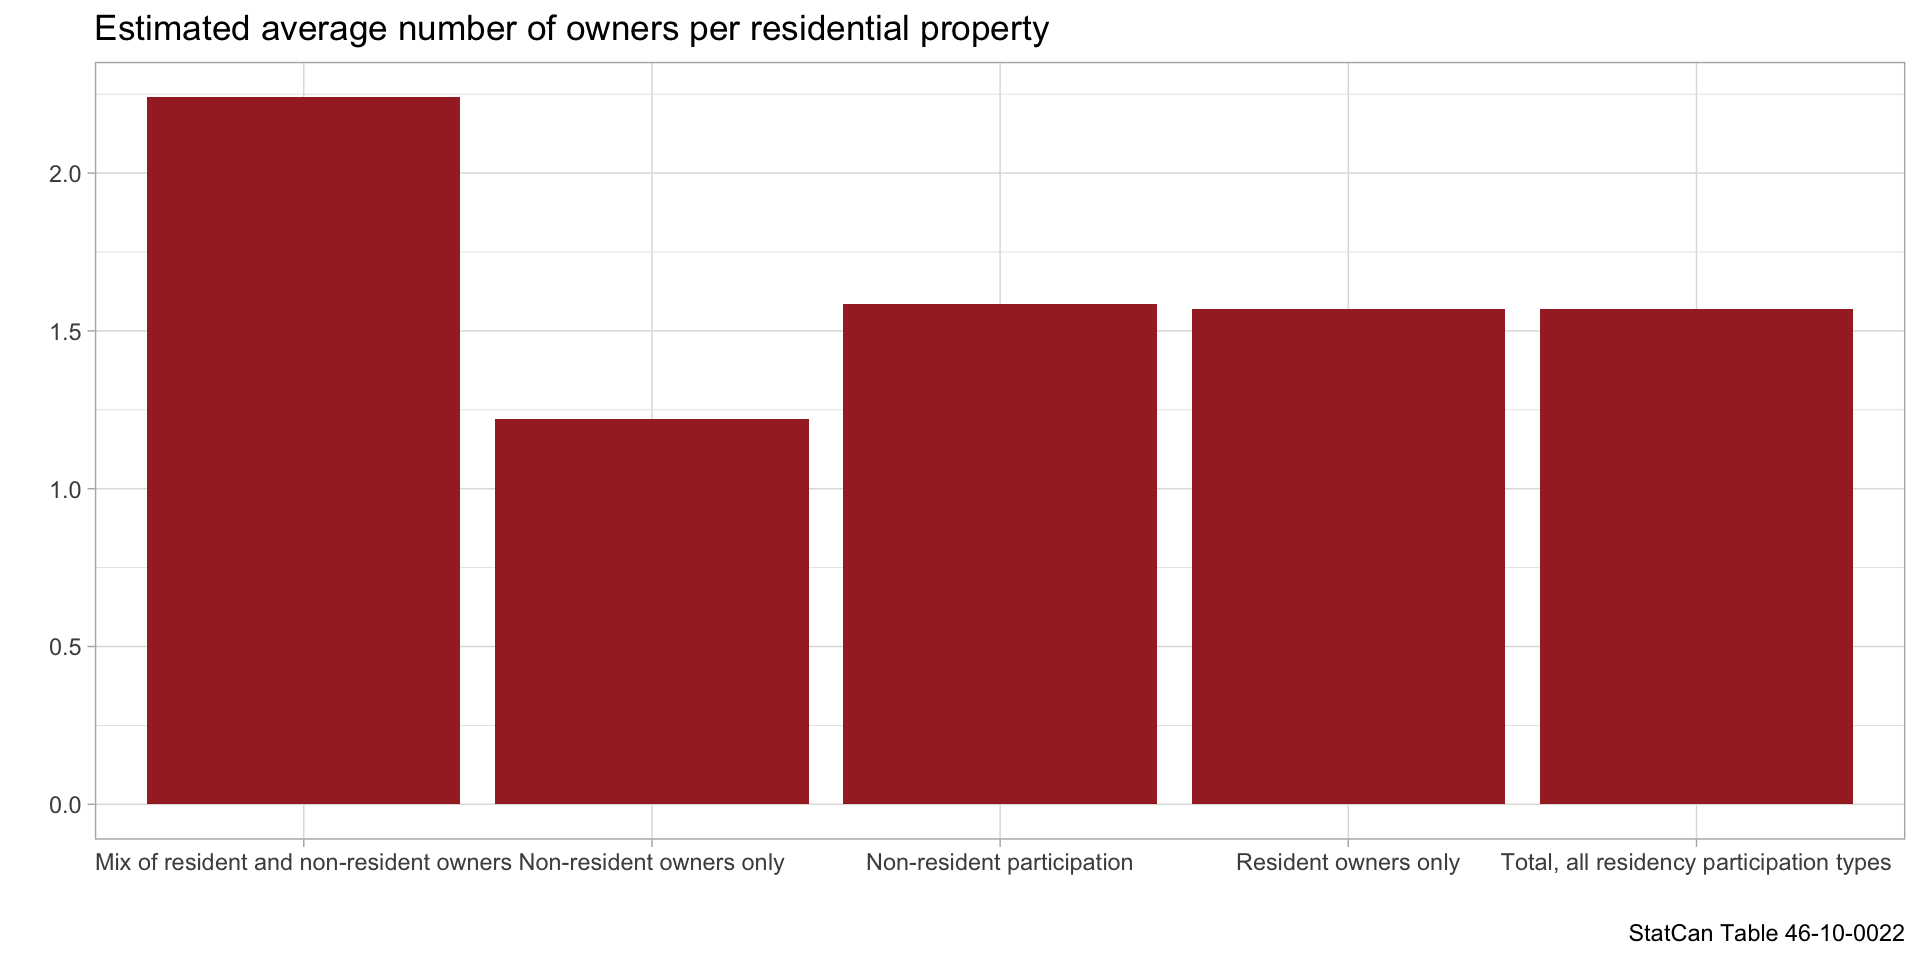
There also seems to be little variation across residency types, except that properties owned purely by non-resident owners have fewer owners on title, while properties owned by mixed resident and non-resident owners have more. But that’s expect. The share for non-resident participation properties confirms that the differences from the average are almost entirely due to conditional bias. Thus there should be little issue with applying the same fudge factor across the board.
As usual, the code for the analysis is available on GitHub.
