Cascadia!

So here comes the Cascadia Urban Analytics Cooperative! A new cross-border initiative bringing together UBC with the University of Washington! I’ll be generally curious to see where this goes. The notion of Urban analytics, of course, would suggest some interest in urban issues. But so far, at least, there’s very little mention of anything involving urban studies, urban geography, urban sociology, planning, law, or social science of any sort. It’s early days, of course, but I’d be a bit more encouraged if I saw some mention that “urban” implied people living in cities, and we have some relevant expertise that might be worth tapping into!

In the meantime, here’s the four program lined up so far (quoting from the press release):

  • The Cascadia Data Science for Social Good (DSSG) Summer Program, which builds on the success of the DSSG program at the UW eScience Institute. The cooperative will coordinate a joint summer program for students across UW and UBC campuses where they work with faculty to create and incubate data-intensive research projects that have concrete benefits for urban communities. One past DSSG project analyzed data from Seattle’s regional transportation system – ORCA – to improve its effectiveness, particularly for low-income transit riders. Another project sought to improve food safety by text mining product reviews to identify unsafe products.
  • Cascadia Data Science for Social Good Scholar Symposium, which will foster innovation and collaboration by bringing together scholars from UBC and the UW involved in projects utilizing technology to advance the social good. The first symposium will be hosted at UW in 2017.
  • Sustained Research Partnerships designed to establish the Pacific Northwest as a centre of expertise and activity in urban analytics. The cooperative will support sustained research partnerships between UW and UBC researchers, providing technical expertise, stakeholder engagement and seed funding.
  • Responsible Data Management Systems and Services to ensure data integrity, security and usability. The cooperative will develop new software, systems and services to facilitate data management and analysis, as well as ensure projects adhere to best practices in fairness, accountability and transparency.


Down at the University of Washington, the new cooperative will be based at Urbanalytics, a University of Washington initiative drawing on “civic hackers” to think up creative solutions to making urban life better.They have a variety of affiliated projects, including one on “housing stability,” apparently led by a physicist and a neuroscientist. I’ve no doubt these are creative and clever people with lots of insight to offer. But as someone who works in housing – an extraordinarily complicated and policy-heavy field requiring a lot of local knowledge – I worry. Wouldn’t you want to add to your team, say, someone who actually knows something about, I don’t know… housing?

On the whole, it’s neat to see the efforts here, and there’s great potential (calling Jens Von Bergmann!) There’s also increasingly a lot of data to play around with, and data scientists have an important role to play. I just worry that brand new efforts to be socially responsible and make cities better won’t get very far without drawing upon the existing strengths of people who have been working toward those efforts for a long, long time.


Guess Who’s Coming to Vancouver?

Where are most immigrants to Metro Vancouver coming from?

If you answered: “China, of course” – then I’m willing to bet you’d be in the majority. But you’d also be wrong.

At no time in the last ten years has China ever accounted for most of Metro Vancouver’s immigration. But for nine of the last ten years, China has been the top sender. As of 2015, even that’s no longer true. China’s no longer #1. It’s not even #2.

According to data from Immigration, Refugees, and Citizenship Canada compiled for Metro Vancouver, both the Philippines and India sent us more new immigrants in 2015. Here’s the data, part of the planning data library from Metro Vancouver :

metroimmigration-2015

Here I just highlighted all sending countries contributing an average of at least 1,000 new permanent residents a year across the past ten years where we have data (2006-2015). There are, of course, many other countries sending smaller numbers that collectively take us all the way up to the jagged gray line at the top of the chart in terms of total numbers of permanent residents landing every year. Graphically, it’s quite clear that China’s never accounted for the majority of immigrants to the area, and has now even lost its position as number one sender (even setting aside the thorny of question of whether to count Taiwan and Hong Kong as part of China).  In 2015, nearly 6,000 permanent residents landed as citizens of the Philippines, compared to just over 5,000 from India, and just over 4,000 from the Chinese Mainland, Hong Kong, and Taiwan combined.

I found an nice article from last year covering the relative decline in Chinese immigration as of 2014 figures in the Vancouver Sun. But that was before China dropped out of the #1 sending position. I have to admit, I’m surprised this hasn’t been a bigger story! But maybe that’s because I’ve been especially attuned to (and concerned by) the rhetoric concerning Chinese immigration and investment and its relationship to Vancouver housing.

Of course, regardless of what’s happening to immigration now, the influx of past immigrants has left a lasting impact on Vancouver. Chinese immigrants still constitute the largest grouping, by national origin, in the region. Of course, we don’t have our 2016 Census results broken down by immigration yet. But here’s a linguistic measure from 2011.

metro-linguisticdiversity-2011

Considered collectively, Chinese languages (Cantonese, Mandarin, and Chinese not otherwise specified) constituted the sole mother tongue of just over 14% of the population as of 2011. That’s a nice slice of the pie! But it’s just a slice. We actually have broader diversity in immigration across Metro Vancouver than is often recognized. (and not all of it is apparent from language, especially since the 6th and 7th largest sending countries – the US and the UK – tend to send English speakers).

If you build it, will they come?

Huzzah! Make way for the 2016 Census Data of Canada! New Population and Dwelling Count Data have been released. Here’s just some of the coverage by David P. Ball at Metro News. For maps of the new 2016 data, check out the reliably brilliant work of Jens Von Bergman at Censusmapper. Here’s one on population change. Here’s another on the percent of dwellings unoccupied by usual residents. And one more on population density!

I taught all day on Wednesday when the data came out (plus there were warnings about the coming snowpocalypse), so I mostly missed the media frenzy. But now that I’ve managed to get ahold of some of the data, it seems like a good time to start playing around with it. I’m going to start with Vancouver, of course.

Returning to the coverage by David Ball, one of the big themes is “if you build it, they will come.” In broad outline, this seems pretty true! Nearly all of the municipalities across Metro Vancouver built new housing and gained new population. The one exception was West Vancouver, which actually lost dwellings and correspondingly lost population. So far so good. But curious puzzles remain. For instance, the City of Vancouver actually added more new dwellings (just over 22,000) than the City of Surrey (just over 17,000), but the latter added more people. Why should that be? More specifically, just how many people should you expect to gain for every new dwelling you add?

A good starting point to answer this question would be average household size. Across Metro Vancouver as a whole, there is an average of about 2.6 persons per household. This average is pretty stable (it was about the same in 2011 as in 2016), but the average conceals considerable variation across municipalities, as detailed in the chart below.

census-2016-hhsize

Just looking at municipalities over 100,000 residents in size, Vancouver, in particular, has smaller households than most of the rest of the Metro Area. Surrey, on the other hand, tends to have bigger households. So if you build it, there’s not just one answer to the question of how many people you should expect will come! Existing household size provides an important part of the picture, providing some indication of both what kinds of households are already in a given location, and what kinds of dwellings have already been built.

But does this determine how many people you should expect from building more? In part this depends upon what kinds of households you’re attracting (singles, retirees, couples, young families, etc.) – are they similar to those already there? It also depends upon what kinds of dwellings are being constructed (studio suites, townhouses, etc.), are they more of what’s already been built?  It makes sense that Surrey, which tends to have a lot of families – many extended – living in a lot of single-family houses, has larger households on average than Vancouver. Vancouver is home to a more diverse set of households (made up of young hipsters, old retirees, etc.) and many a shoe-box apartment, meaning much smaller household sizes – not unusual for the central city in a metropolis.

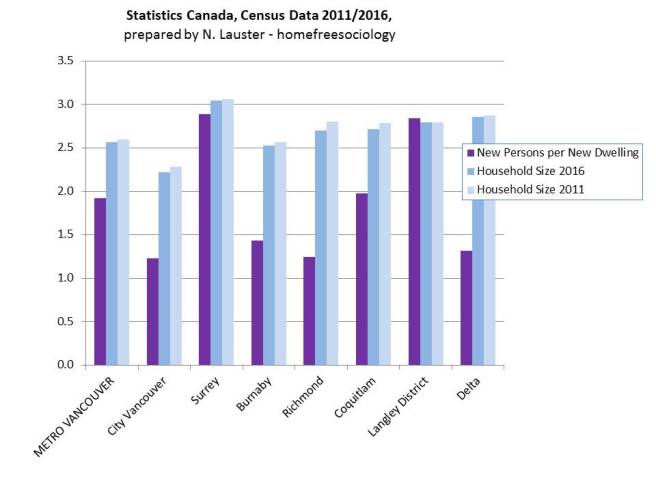
So let’s see how our expectations based on current household size might match up to the number of new residents we can actually see arriving for every new dwelling added. How many people are showing up?

census-2016-hhsize-newpopdwell

Strikingly, nearly every big municipality fails to add as many people per new dwelling as might be expected! The District of Langley is the only one adding more, and Surrey comes pretty close. But otherwise we seem to be missing a lot of the people we should’ve expected. Why? One big reason, of course, is that not all dwellings get lived in at any one point in time. There are many reasons why this might be the case (as I’ve detailed in a previous post). But if new dwellings aren’t being occupied, then they don’t bring new people. Correspondingly, even if new dwellings are being occupied, but older dwellings are increasingly going empty, then growth won’t match expectations. Here’s where it’s worth noting that the City of Vancouver added about 22,169 new dwellings in the past five years, more than any other municipality. But Vancouver also had 25,502 dwellings that showed up as unoccupied in the 2016 Census. A lot more residents could’ve been housed!

So let’s look at the percentage of dwellings remaining unoccupied in 2016!

census-2016-unoccupied

There are big differences between municipalities in terms of unoccupied dwellings.Wherever the rates have gone up (Vancouver, Burnaby, Richmond, Coquitlam, Delta), that’s created a real drag on how many new people could be added per new dwelling. By contrast, municipalities where the proportion of homes left unoccupied has declined (Surrey, Langley), have received an extra boost in new residents per new dwelling!

It’s worth noting that it’s hard to say how many of these unoccupied dwellings will ultimately show up as “empty” and hence become subject to the City of Vancouver’s forthcoming “Empty Homes Tax,” but it appears there’s definitely some revenue waiting to be generated out there (or some new rentals waiting to enter the market, which would also be good!)

If we want to focus more specifically on whether newer households tend to look like older ones, we can look solely at new residents per new occupied dwellings. As demonstrated below, it still varies!  But it generally gets us closer to existing household size.  Outlying suburbs like Surrey, Langley District, and Delta, tend to add more people per new dwelling. Places generally moving toward greater density, like Vancouver, Burnaby, and Richmond, are adding fewer people per new dwelling – often because those new dwellings tend to be smaller (number of rooms matters!).

census-2016-newpopperoccup

So if you build it, will they come? YES! But you can’t always tell how many. Occupancy matters, as does what gets built and who can afford it (or who it attracts).

But there are other things happening too, like aging of existing households. If I get the time, I might move on to considering how background aging in neighbourhoods tends to influence their changing composition in future posts. LOTS of fun things to think about there.