How often do people move, and why? Canada has ok data on the first question, and as of yesterday (!) also some ok data on the second. The USA just released its most recent data, with even better answers for both questions. The big finding out of the USA data, attracting significant media coverage, is that Americans just aren’t moving as much as they used to… which is pretty interesting.
Let’s start by comparing the USA to Canada in broad terms. Here I’m looking only at moves over the course of a year (the one-year mover rate), and I’ll just pull from the USA data on movers for recent Canadian census years (2001, 2006, 2011, 2016), and add the most recent year available (for 2018-2019). I’ll also break the numbers down into their component types of moves: short-distance mobility (within county in the USA, within municipality in Canada), longer-distance migration (between counties and states, or within and across provincial lines), and immigration (from another country).*

Overall mobility for both Canadians and Americans dropped between 2006 and 2011, with the intervening Great Recession likely a big explanation for the decline (as well as its greater severity in the USA). But Canadian mobility rebounded, while the Americans continued to… well… stay at home. Just under 10% of Americans moved in the last year, compared to just over 11% in 2015-2016, when a comparable 13% of Canadians moved.
What’s apparent for both countries is that short-distance moves (within the same county or municipality) dominate moves overall, and correspondingly tend to drive broader trends in mobility and migration. Even though geographies of moving can be funky (and US counties are especially weird in this regard), this is a pretty stable pattern. Given the different geographies, it’s hard to read too much into the differences in longer-distance moves between Canada and the USA, but more long-distance moves cross state lines in the USA than provincial lines in Canada. And finally, while still small overall, immigrants (crossing international lines in the last year) make up a bigger proportion of movers in Canada than the United States, actually exceeding the proportion of movers crossing provincial lines.
But why do people move? The USA has good data on that! (Tables 17-18). Here we’ve got the main reason for a given move (often there are more than one), divided into a set of common categories. Let’s break it down by distance moved to show off some general patterns and how short-distance moves are different than longer distance and international moves.

Pretty neat! Short-distance moves (within counties) are dominated by those moving for housing reasons. Longer-distance moves (between counties) are much more heavily focused on work reasons, chief among these moving for a new job. International movers respond primarily to other concerns, with education being a big one! (Housing reasons drop away almost entirely). Strikingly, moves for family reasons are pretty constant across all distances. Thinking about immigration, the categories we get, including: Work, Family, Education, and Other (including refugees) map onto a variety of federal immigration programs, both in the USA and Canada.
Let’s also talk a little bit about the actual reasons given, starting with the work-related categories (in green), including moves because of a new job, moves because of looking for work or recently losing a job, moves to be closer to work (reducing a commute), moves because of retirement, and other job moves. Most work-related moves are for a new job or to be closer to work. Next come family-related categories (in yellow), including moves because of changes in marital status (e.g., moving in, getting a divorce), starting a new household (e.g. moving out of the parental home), and other family (e.g. moving to be closer to a parent, needing room for more kids, etc.). After that I’ve placed a variety of miscellaneous reasons for moving in shades of brown and red. The largest of these, separated out from a generalized “other,” are moving for school (e.g. university), moving for health reasons (e.g. closer to care), and change of climate (e.g. moving to Florida). But natural disasters also motivate a significant number of moves, especially for international movers, and in a world of climate change that’s definitely a category to keep an eye on. Finally let’s turn to housing-related categories (in blue). Here we see people moving because they wanted to own a home (usually after renting), because they wanted a better home, to live in a better neighbourhood, to live in cheaper housing, or because they were evicted or foreclosed upon, with a residual of other housing-related reasons bringing up the rear.
Let’s look at historical variation in reasons for move with handy data from the past twenty years.

Work-related and Family-related reasons for moving seem to have declined only slightly over time. The big decline in American mobility is strikingly concentrated in the decline in moving for Housing-related reasons. We might think of this as reflecting a real decline in housing opportunities, leaving younger people, in particular, “stuck in place,” as per this Brookings report. “Other” reasons for moving may have gone up slightly in recent years, though it’s difficult to fully compare given a variety of changes to survey instruments and coding (e.g., an instrument error may explain truncation in the 2012-2015 era, and new coding procedures for write-in reasons were adopted in 2016).
What’s the new Canadian data on reason for move look like? Unfortunately, it’s different and slightly less useful for some questions than the US data. But it’s something! (Hat tip to Jens, who told me it was out & already wrote up a blog post about it). What the Canadian Housing Survey has done is ask people about whether they’ve moved in the last FIVE years (rather than the last one year). If they’ve moved, the survey asked the reasons for their last move. Canadians could report more than one, which reflects the complexity behind peoples’ actual moves, but unfortunately also makes it difficult to distinguish and compare the main reason for peoples’ move. But let’s look at reasons overall. We don’t have quite the same set of reasons codified in Canada as in the USA, but there is significant overlap, and broad categories can be grouped in more or less similar fashion. Here (for selfish reasons) I also provide a cut-out for my province of British Columbia (BC).
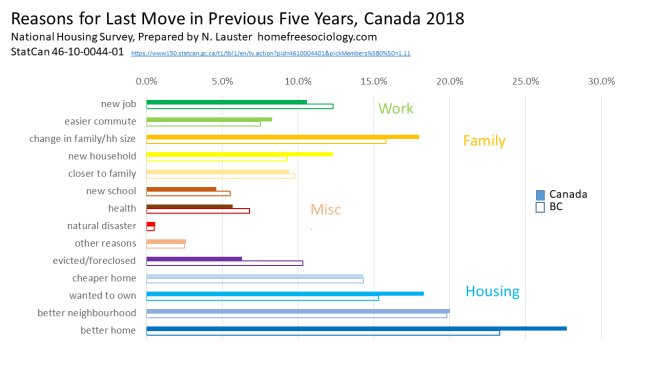
In broad terms, we can see that the categories and their relative importance match up pretty well with what we get in the USA. Housing factors dominate reasons for move, and the largest reason people in Canada give for their moves is that they moved “to upgrade to a larger dwelling or better quality dwelling,” an explanation involved in over a quarter of all moves. Moving for family-related reasons comes next, followed by moving for work-related reasons, as in the data for the USA. Leftover “other reasons” in Canada is a little more inclusive in Canada than in the USA, but we can see that it’s still a residual category, without as much overall explanatory power as the others.
Looking at specific reasons, where they match up to reasons in the USA data, they tend to carry the same general explanatory power. Most moves are about finding housing, matching it to one’s family or household, and matching up to a job. But there’s one reason for move that really jumps out in the Canadian data, despite playing a much smaller role in the American data. So let’s talk more about evictions and foreclosures!
Being “forced to move by a landlord, a bank or other financial institution or the government” is a factor in over 6% of Canadian moves, jumping up to a staggering 10% of moves in British Columbia. One-in-ten moves involves a shove out the door! Those are big numbers. I’ve got ninety-nine reasons for why we might expect BC to see a higher proportion of moves involving these kinds of interactions than Canada as a whole (e.g., we don’t have enough homes, we’re dominated by Metro Vancouver‘s super-tight housing market, and we rely much too heavily on unstable secondary suites and condo rentals that can be reclaimed for use by their owners). But assuming this is mostly about eviction and foreclosure, I really don’t have any good explanation for why they would be playing such an outsized role in explaining moves in Canada relative to the USA. It’s a mystery!
To get a sense of how big of a difference we’re talking about, let’s go back to the data from the USA. In the most recent year, less than 1% of moves (an estimated 216,000 in total) were mainly the result of an eviction or foreclosure. We can go back further. The USA only began providing and recording evictions and foreclosures as a standard option in 2012, but they include a coding of write-in answers in 2011. Good timing, with respect to the aftermath of the Great Recession, as foreclosures piled up, weighing heavily on peoples’ lives as well as the post-Recession recovery more broadly. In the peak year of 2011-2012, an astonishing 792,000 Americans reported moving due to eviction or foreclosure. And yet… that number still represented just over 2% of all movers, with over 35 million moving in that year.

By contrast with the USA, Canada has low mortgage arrears and foreclosure rates and tends toward relatively strong tenant protections. It might simply come down to the survey options available for people to choose. “Forced to move” may be read as more inclusive than “eviction or foreclosure” in such a way that people more readily recognize their circumstances in the former (language of everyday life) than in the latter (legal language). Canadians may also be expanding the range of reasons they were forced to move to encapsulate more ambiguous situations like “my landlord kept trying to sell the place, with showings every week, so we had to get out of there.” So maybe the US and Canadian data just aren’t fully comparable here.
Returning to my ninety-nine reasons for BC’s high rate of forced moves relative to Canada as a whole, it’s worth noting that we do actually have some data on evictions, thanks to Nick Blomley’s team at SFU. Eviction proceedings mostly follow missed rent checks, just as foreclosures almost entirely follow borrowers missing their mortgage payments. Overall, even in Metro Vancouver, the proportion of evictions related to landlords reclaiming dwellings for their own use appears to be pretty small, involving less than 4% of tenant-landlord disputes between 2006-2017 (compared to nearly 40% involving missed rental payments, p. 9 & 12). That said, landlords reclaiming dwellings for their own use seems to be on the rise (p. 10). But overall, the informal ways people feel forced to move by their landlords, banks, or governments, may play a significantly larger role than formal eviction or foreclosures, perhaps even pointing to some shortcomings of the US data for missing a more expansive understanding of forced moves. Can you guess what I’m going to say next? We need more research on this topic!
Forced moves attract attention because they’re the kinds of outcomes we should be working hard to prevent, and it’s important to provide strong protections enabling and supporting people to stay put in their housing where possible. There are good reasons to support an anti-displacement agenda, especially providing for tenant protections. But bearing this in mind, it’s also important to recognize and normalize moving.
Most moves represent positive experiences for people: leaving home, getting married, making room for a child, getting a new job, moving closer to work, moving to better housing or a better neighbourhood. Sometimes such moves are vital, as when people need to escape from a bad family situation. The right to move is protected in some form or another in both the USA and Canada (Charter of Rights!). But it’s largely meaningless without the right to housing. We should be protecting the right to move, together with the right to housing in places people want to move.
To put the matter differently, an anti-displacement agenda is important to protect peoples’ existing housing arrangements, focused on those currently lacking legal standing to remain in place (i.e. most tenants). But anti-displacement efforts must be coupled with a broad pro-mobility, pro-housing agenda in order to fully enact, protect and expand peoples’ right to move and right to housing. Fortunately, evictions and foreclosures seem to be declining in the USA, but moving overall has also declined. Evidence suggests that the decline in moving in America may be most strongly related to a decline in housing opportunities (e.g. Glaeser & Gyourko). We know moving overall has rebounded in Canada, though we don’t yet know if people are increasingly feeling forced to move. The numbers out of BC are certainly disturbing. Pushing for an expansive right to housing means continuing to work toward strong protections for existing tenants, but also – and crucially – working to make sure people can move pretty close to the places they want and need to go.
Let me end by proposing a simple motto for our governments to work toward: Freedom to move and freedom to stay, we’ll get you housing either way.
*- I use the data with the most recent base in the US dataset (e.g., 2010 census for 2010-2011 year in USA), and for the 2001 Census year in Canada I extrapolate the finer categories here from cruder categories available using the corresponding proportions in the 2006 Census year. Check original files for a variety of other cautions with the data.


.png)