
I’m always both fascinated by and wary of the data produced by real estate associations. I initially had a whole chapter in my book devoted to taking apart survey data on consumer preferences put together by real estate organizations (sadly, but probably correctly, it got cut). Here’s one of my favourite such survey questions (see slide 8) based on what Vancouverites might want to buy if, inspired by the Bare Naked Ladies, they had a million dollars. (Nearly a quarter chose to keep the $1 million and rent!)
I notice that such data is back in the news again, this time based on surveys of realtors, from April 2016 to April 2017, who’ve recently represented buyers in sales. The write-up leaves a lot to be desired in terms of methods (what’s the sample size of realtors and buyers? what’s the response rate? are there warning flags in terms of representation of realtors and buyers?) It’s also unclear whether this represents entirely re-sale or also sales of new residential real estate. This makes it difficult to evaluate the quality of the data. But it’s still kind of fun to play around with it.
I’ve broken the data, as presented by REBGV, down into my own categories. Here’s type of sale:

According to recent surveys of REBGV realtors, investment purchases make up about one in five sales. The role of foreign investment (largely, but not entirely post-Foreign Buyer Tax) is relatively small. But survey quality, about which we know little, likely matters a lot for these estimates. Are some realtors and real estate companies more likely to respond than others (especially those, like New Coast, likely to especially target overseas buyers)? Other important details are also missing: Are sales of newly constructed properties included? How do realtors decide who counts as a foreign investor vs. a domestic one?
Setting investment purchases aside, first-time buyers, targeted by a much-derided recent BC Liberal finance assistance program, make up nearly a third of buyers. That’s a pretty big chunk of sales! But here it’s not clear quite what counts as “first-time.” First time in Vancouver, first time in Canada, first time at all anywhere? Other moves, making up nearly half of all purchases, tend to be from buyers moving around from one dwelling to another.
Finally, there’s really interesting data breaking down moves of owners moving from one property to another by type (condo apartment, townhouse, and detached house) at old home and new. I simplified this into lateral moves, moves to likely bigger units (upsizing), and moves to likely smaller units (downsizing). Many general life cycle models of housing assume households tend to upsize over time as they grow, the better to fit with children. Downsizing only (maybe) occurs after retirement or when children move out. But with Vancouver steadily moving away from single-detached houses, upsizing is the least likely type of move between owned units. Instead, most moves are either lateral (e.g. apartment to apartment) or downsizing. That’s pretty interesting, and likely reflects, in part, how people moving here from elsewhere in North America typically find a house out of reach.
And just where are people coming from?
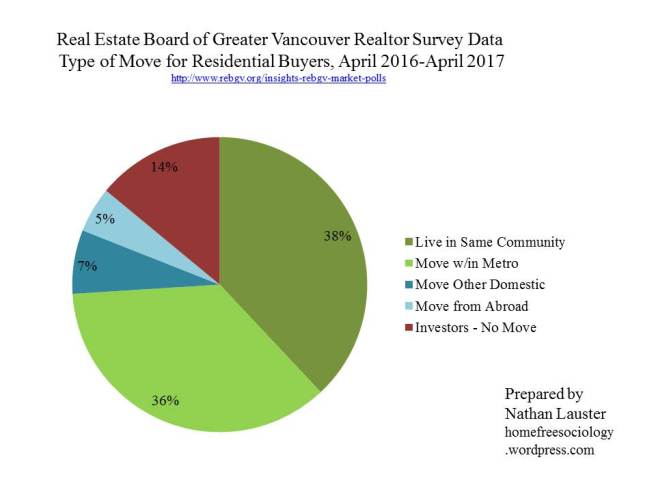
Hmmm… returning to the data quality issue, it’s a little concerning to me that the “investors” category in this question is so much smaller (14%) than in the previous question about type of sale (20.8%). Where did the extra investors go? Did some of them move as they made investment purchases? Were others counted as living in the same community? Weird.
But we get some idea about what proportion of sales represent people moving here from beyond the Metro area, and it’s about 12%. That could account for many of the downsizers, as they reckon with the realities of Vancouver’s pricey market (esp. for single-family detached homes). Another healthy chunk might involve retirees (more on that in a second).
Setting aside investors, we can actually do a comparison of where moving buyers are coming from by looking to Census data (or more accurately, National Household Survey data). The 2016 data on mobility and migration aren’t out yet, but the 2011 data (limited access here, but also recently out in IPUMS) provides a breakdown for those who’ve moved in the past year. Limiting the sample to those in Metro Vancouver, I looked at household heads who’d moved in the past year and owned their own home. How did where came from match up to REBGV data in 2016-2017?

That’s actually a pretty good match! There is some difference in terms of who the Census thinks is moving within their own community relative to who realtors think of as moving within their own community. This likely relates to shifting definitions of communities (again, not defined in the REBGV data). But looking at the proportion of new buyers moving within the metro area (in green) relative to those moving in from away (blue and pink), the figures are actually quite close, at about 86% of non-investment residential sales being to local buyers.
The Census from 2011 would suggest slightly more recent buyers moving to the area came from outside Canada than the REBGV data from 2016-2017, but not by a lot (7.4% to 5.8%), and the disparity could arise from either historical change (including the imposition of foreign-buyer tax) or from issues with data quality (see above). Still, a pretty good match.
It’s actually harder to match up the “demographic” categories used by REBGV data to census equivalents. But playing around with the community profile data from BC Stats, I did my best. Here’s how new buyer households in the REBGV surveys from 2016-2017 kinda, sorta stacked up against all households in Metro Vancouver by household types in 2011.

Again, it’s tricky to make sense of REBGV categories and match them up to Census categories (the census, for instance, does not differentiate between “young couples without children” and “empty-nesters,” and I’ve no idea how these were defined for the realtor survey either). I also don’t know how demographics on investors were tabulated, or where they fall relative to households looking to buy a place to live. But the general match-up between all households (from 2011 Census) and new buyer households (from 2016-17 REBGV survey) looks plausible to me in terms of what I might expect. New household formation drives a lot of sales. So couples without children are disproportionately likely to buy a place while retirees (or those age 65+ in the Census) don’t actually move all that much (there’s a lot of aging-in-place).
I don’t know that I have a big takeaway from all of this data exploration. I think the REBGV data remains kind of sketchy for estimating investment purchases until we get some basic information about data quality and representativeness out of the way. But setting aside investors, the data on where new buyers are coming from when they move within or to Vancouver lines up well with what I’d expect from the census, which is reassuring and kind of cool.
