Checking in with CHSP

With some new data out from the Canadian Housing Statistics Program (CHSP), it’s time to check some of my past work! Let’s see how it holds up.

First off, I suggested all the way back in January of 2018 that we focus way too much on “foreign” investors as a housing problem in Vancouver. As I noted at the time, I’m not sure why we care if our housing investors are foreign or domestic. But even if we did care, the evidence at the time (compiled from combining data sources) suggested the vast majority of investors were domestic. How does that hold up?

CHSP-checkup-1

Pretty well! According to CHSP data about four-fifths of real estate investment in Vancouver appears to be domestic, with the remaining fifth is foreign (a.k.a. “non-resident” in Canada*). While I explored this issue by total property value, this matches with Jens von Bergmann’s corresponding estimates by number of owners. I was looking at Metro Vancouver (CMA) as a whole, of course, rather than the City. But the estimates are pretty much the same between the proportion of investors that are non-residents in the City of Vancouver (21.3%) and the CMA (20.9%). The level of foreign investment is high for the parts of Canada studied here, speaking to Vancouver’s transnational connections as a Gateway to Canada. But the differences aren’t that large. Outside Vancouver the range of investment considered non-resident runs from 3.4% in London to 15.7% in the City of Toronto. But returning to my initial point, I’m still not sure why we should care too much which investors are foreign or domestic.

What about investment overall. Are there reasons to privilege owner-occupiers over investors? To the extent investors are offering up their properties for rent we might actually want to encourage investment. After all, renters are generally the most disadvantaged in Canadian housing markets, making up the vast bulk of those in core housing need. So long as investors are renting out their properties, that’s providing more options to renters, which is especially important insofar as Canada’s more or less stopped building purpose-built rental apartments in recent decades and Vancouver has especially low vacancy rates. If investors aren’t renting out their properties, then maybe consider putting in place an empty homes tax! They seem to be gaining in popularity!

But maybe you still want to give people interested in buying a home to live in a leg-up over people interested in buying a home to rent out? This is a common policy choice (see, e.g., principal residence tax exemptions), often justified as building the middle class, helping the young in their aspirations, etc. Theoretically it could also work to challenge landlord monopolies. But in practice, it tends to advantage households in one economic strata (aspiring middle class) over two others (tenants and small-time landlords), while the big-time landlords owning purpose-built rentals may actually benefit from the reduced competition for tenants. Setting aside the various justifications, is there much difference between places in terms of overall investment?

What really jumps out in the CHSP data is the non-metropolitan parts of NS, ON, and BC. Many of the properties in these locations are probably vacation homes. Next comes the City of Vancouver, where 34% of properties appear to be investor owned, followed by London, ON (CMA) at 30%. Yes, just to emphasize the point: the City of Vancouver (highest foreign investment) and London CMA (lowest foreign investment) have remarkably similar rates of investment overall. Huh. (GOTO: why should we care which investors are foreign or domestic?)

But it’s also worth noting that the City of Vancouver is unusual insofar as it’s at the heart of a much broader metropolitan area. We only have data on two other municipalities here: Halifax and Toronto. For Halifax, the City and the Metro Area are exactly the same thing. For Toronto, after amalgamation, the City includes a full 44% of the properties within its broader Metro Area. For Vancouver that figure is only 25%. In short, the City of Vancouver is a very particular slice of its broader Metro Area, while the City of Toronto includes more of its suburbs and Halifax offers the whole enchilada. Looking at broader Metro Areas (CMAs), Vancouver doesn’t stand out much. It’s still on the higher end of CMAs studied, but there’s greater investment overall in nearby Kelowna, not to mention London and Kingston.

Let’s look at another recent blog post, this time exploring condominium apartment use, and co-authored with Jens and UBC’s Douglas Harris. This was a lot of fun! We drew on census data from 2016 and contemporaneous rental vacancy data to estimate empty condos as well as those occupied by renters and owner-occupiers. One of our main findings was that for every ten condominium apartments in a place like Vancouver, we get about six owner-occupied, three rented out, and one left “empty” at any given point in time. Jens turned this into some beautiful “waffle” charts, demonstrating variation across some major metro areas.

condo_usage-1


Looking only at our estimates of owner-occupation for some of the metro areas covered, we see our estimates from 2016 line up pretty well (within a couple percentage points) with CHSP data for 2018 in the metro areas of Vancouver, Toronto, Hamilton, Victoria and Kelowna. Greater Victoria Ottawa-Gatineau** saw the biggest difference between our estimates from 2016 and CHSP estimates from 2018, with the latter showing higher owner-occupation. This might reflect either historical change or differences in methods, or a combination of the two. All and all I’m counting this as a win!

CHSP-checkup-2-condo

I also enjoy validation with regard to another one of our key points: investment in condominium apartments is generally much higher than in other forms of housing. Compare the two figures above! Non-owner-occupied condos range from a low of 36% (Peterborough CMA) all the way up to 87% (London CMA). Wow! That’s much higher than the range for properties as a whole, maxing out at 42% in non-metro Nova Scotia. The heavy investment in condominium apartments probably has to do with the financing model, which is heavily dependent upon pre-sales. Usually people buying a place to live need it immediately. But investors can afford to wait and thereby take a stronger role in providing the capital to help develop new housing. Overall, this accords with the effective replacement of purpose-built rental apartments (held by big landlords) with condominium apartments as rental stock (distributed among small landlords). There may still be very good reasons to favor purpose-built rental apartments (security of tenure being a big one), but until financial models and incentives for them catch up to the attractiveness of condo developments, we’re kind of stuck with the latter as a big source of market rentals.

The shift to condominiums as rental stock also demonstrates an important compositional issue. Places with lots of condominiums can have much higher rates of investment overall, even if their condominium stock is more often lived in by owner-occupiers. Where do we see the most condominium stock? Hello Vancouver!


CHSP-checkup-4

In terms of use of condominium apartments, both metropolitan Vancouver and Toronto are both at the low end for investor ownership, just a percentage point ahead of Peterborough (37%). The City of Vancouver is a little closer to the middle (46%), but still on the low side. But condominium apartments dominate the overall stock of properties in Vancouver, driving up the overall investment we observe. Just to round things out, let’s drop condominium apartments from the mix, and look at other residential properties that could potentially be occupied. Dropping condominium apartments (where Vancouver is on the low side of investor ownership), we see that the Vancouver CMA is decidedly in the middle of the pack on other kinds of property investment. The City of Vancouver still runs a little bit high (up there with the Kingston CMA), but nowhere near the non-metropolitan areas. The dominance of condominium apartments explains away a lot of the investment patterns we see in Vancouver.


CHSP-checkup-3


Overall I’m feeling pretty good about my past work! (And even better about the work of my collaborators – they’re sharp!) But I’m not quite as excited about the way the CHSP data has been reported on in the media. Given a barrage of stories about foreign investors and “toxic demand” driving broader Vancouver housing crises, it might be time to look at the data in comparison and see that we don’t really stand out in most ways.

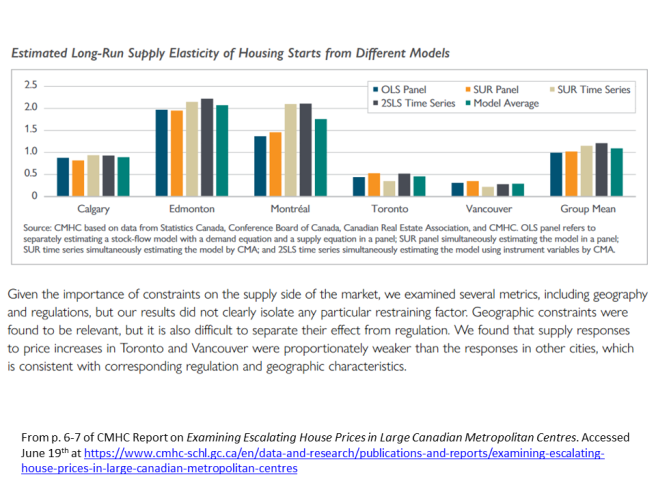
Where do we really stand out? Well, as the CMHC notes it’s not about toxic demand so much as toxic supply elasticity.
CHSP-checkup-5

Translating that finding: we’re a city and region where a lot of people want to live that hasn’t built enough housing, market and non-market alike, to maintain affordability and keep everyone who wants to live here well-housed. Guess there’s only so many times that’s going to make for good headlines.


Want to play around with the data yourself, but not ready for R? Go to the Statistics Canada’s portal to run your own cross-tabs, or see my handy excel spreadsheet here.

*- “Resident” vs. “Non-resident” status refers to where owners are located in CHSP data, rather than to their citizenship. Owners located abroad are considered non-resident, even if they’re Canadian citizens. I only look at “applicable” properties eligible to be occupied by their owners in this analysis, ignoring the minority of properties where occupancy is considered “not applicable.” For a look at corporate ownership structures, have a look over at Jens’ recent post!

**- Oops! Initially somehow mixed up Ottawa-Gatineau with Greater Victoria. Looking more carefully at the geography here, it appears that CHSP only tracked data on the part of Ottawa-Gatineau inside of Ontario, which may also account for the larger variation from our 2016 findings, where we included the Quebec part of the CMA as well.

What does livability mean?

Livability is a big, important concept in both planning and housing. But what does it mean? As it turns out, the concept of livability gets articulated in lots of different ways, and there’s not a great deal of agreement. In no small part, this is because people are different and want different things out of life, creating a definitional conundrum. But livability is also a really important concept. Livability sits at the heart of articulations of human rights, including the right to housing. It’s used to rank cities and set them competing with one another. It’s a key concept in planning, and embedded within a wide range of hyper-local by-laws determining how people can live.

I was recently asked to write a book chapter discussing the concept of livability, and it was actually pretty fun. Here I just want to make public my basic takeaways (spoiler alert*).

I explored conceptualizations and metrics of livability across different scales and agencies, moving from the United Nations articulation of housing as a human right (with origins in the Habitat ’76 conference right here in Vancouver!) through the various international rankings of livability (Economist, Mercer, Numbeo) that often rank Vancouver near the top (except Numbeo), through the nation-state of Canada (that relies upon Core Housing Need as its key measure of livability as it applies to housing) to Metro Vancouver and its Livable Region strategy (again back to the 70s!) to the City of Vancouver and its by-laws specifying livability as it pertains to housing via minimum dwelling standards (applied to the whole city) and even more hyper-local zoning standards (applied lot by lot). I compared all the ways livability gets conceptualized, articulated, and put to use, as well as all the different dimensions captured by each conceptualization. Like I said, fun! Here’s the big takeaway table:

Table-blog

Don’t stare too long or you’ll hurt your eyes (though you should be able to click for a bigger version). But there are some interesting points from this comparison that reflect the fundamental tension at the heart of defining a singular concept of livability across the differences that make us human and speak to issues if scale.

At the international level, the differences between people and their living situations are all too plain. The only way to really harness livability to a common, culturally and socially inclusive definition of human rights is to keep definitions ambiguous and aspirational. As we move over into different uses for livability (e.g. commercial uses) and down in scale, we tend to get clearer articulations of livability that speak to more specific standards. Correspondingly, we start to lose some of the cultural openness to difference. We also start to see real closure emerge, with Metro Vancouver using livability as a control upon growth and the City of Vancouver’s by-laws outright excluding versions of livability deemed unacceptable. Ultimately, as livability becomes more carefully defined, it also becomes increasingly exclusionary. Put differently, the standardization of living overwhelms acceptance and inclusion for different lifestyles.

What’s that you say? Put it into an animated .gif?

AnimatedGIF


So be careful in working with livability as a concept. Think hard about both the inclusionary and the exclusionary aspects of relevant definitions. At the international and national levels, livability often works toward shoring up a right to housing, which is super-important.** I’m a firm believer that housing should be a right! But it’s not at all clear how you move toward defining precisely what that right entails on the ground. And in practice, the closer we get to local specifics, the more we see the articulation of livability twisted away from inclusion and toward exclusion.


*- for the seven people that might actually read my book chapter besides the very patient editor!

**- Notionally, that’s the work that Core Housing Needs should be doing within Canada, though it mostly just directs funding priorities. I’ve elsewhere written about both the promise and some of the problems of the Core Housing Needs measure.

A Very Imby Election

Vancouver’s heading into an exciting municipal election!

Yes, yes, it’s exciting in all the normal ways elections are exciting: rah, rah, I really want my team to win! Strategy, strategy, wonder what messaging will work? Etc. (I’m a bit of a political junkie).

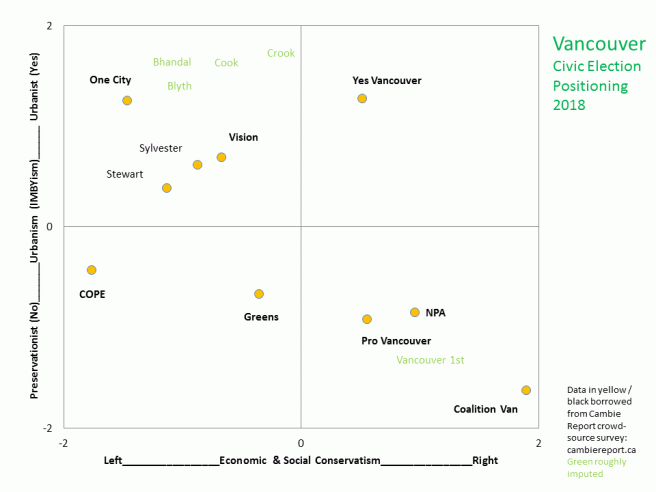
BUT this election is also super interesting to me as a major test of backyard building (-IMBY) coalitions and positioning. There are parties that tend toward Yes! build more housing in-my-backyard (YIMBY), and there are parties that tend toward No, No, No more building in-my-backyard (NIMBY). What’s great about this election is that there are SO many parties involved that we can actually fill out a scatterplot of IMBYism positioned within more traditional left-right coalitions. The folks over the Cambie Report did a bang-up job of illustrating this, with their crowd-sourcing of positioning for the parties (and major independent mayoral candidates). Borrowing from their crowd-sourced scoring of party and major mayoral candidate positions (but centering the scores and inverting the urbanism scoring), here’s pretty much what the political landscape looks like:

Election-2018-positions1

The election is very exciting because there’s someone in every corner! Assuming everyone shares these perceptions of the parties and they’ve been able to get their message out, we get a real test of how urbanist welcome (YIMBY) coalitions line up with more traditional left/right divides in terms of voting strength.

Do most (voting) free-market fiscal conservatives vote YIMBY? We’ll be able to compare the Yes Vancouver! vote relative to the NPA/Pro Vancouver/Coalition Vancouver vote to find out. Are most NIMBY voters progressive-leaning or conservative-leaning (or somewhere in the middle)? We can look to compare COPE to the N/P/C vote to the Greens. Do left-leaning YIMBYs outnumber left-leaning preservationists? Compare OneCity & Vision turnout to COPE/Greens.

And just who makes up YIMBY coalitions anyway? This, I think, is perhaps the most interesting question, primarily because debates sometimes frame YIMBYs as anti-regulation free-marketeers, when in fact there appears to be a rather large group of re-regulation socialist-friendly YIMBYs out there. This election should provide some insight into just how large these different facets of YIMBY coalitions might be by comparing OneCity & Vision votes to Yes Vancouver votes. Fun!

Of course, there’s also bound to be a lot of noise. The chaos in this election suggests that low-information voters, in particular, may fall back on familiar rubrics, perhaps benefiting parties that have been around awhile (NPA, Vision, Greens). The Greens, in particular, may benefit from their mixture of party recognition at other levels of government and progressive sheen mixed with centrist positions historically appealing to many homeowners (there’s a reason Carr was the most popular candidate in the last election). There are also real efforts underway to retain the strength of more traditional left-right divides, at least on the left, where the Vancouver District Labour Council (VDLC) has attempted to broker an alliance. (Does Labour have a stake in this election? Oh yes! Lots of contracts coming up…)

Election-2018-positions2

In order to form their slate, the VDLC had to choose between the two mayoral candidacies of Sylvester and Stewart (setting aside left-leaning alternates like Campbell and Condon, who’ve now dropped out). They chose Stewart, previously an NDP parliamentary politician representing nearby Burnaby. You can scroll through their fancy collector cards (cute gimmick!) on twitter.

In addition to the more organized efforts of parties and labour organizations, it’s worth noting that this year’s election is just a bonanza of independent candidates. Aside from Stewart and Sylvester, the two serious independent mayoral candidates, there’s just a ton of independent council candidates. I can’t fit them all on here, but just to demonstrate a couple of candidates (and a party) missed by the Cambie Report survey, I’ll estimate positions from following folks on twitter as below.

Election-2018-positions3

Bhandal has positioned herself close to OneCity. Cook and Crook are proud YIMBYs and look closer to somewhere between OneCity and Yes Vancouver. Blyth has mostly focused on calling attention to the opiod crisis (to her everlasting credit!) but also seems to have placed herself (or been placed) close to OneCity. Altogether, you could fill out significantly more quadrants using independent candidates. (I just don’t have the time or energy to do it!)

So… where do I fall? Relying heavily on my read of Iris Marion Young’s* brilliant Justice and the Politics of Difference, and in particular, her understanding of the City as an Ideal for Justice, I very clearly fall into what I’d call the “inclusive urbanism” camp, exemplified by OneCity (note: it’s possible I have a sign supporting OneCity out on my balcony right now). I swoon over their campaign slogan of Every Neighbourhood for Everyone. And what do you know, when you add in independents, there’s enough other candidates in that quadrant to fill out a whole ballot! This includes the reigning Vision party, who in my view does not get enough credit for tacking against the broader North American winds to move Vancouver in a more inclusive and urbanist direction.

Election-2018-positions4

That’s not to say there aren’t lots of other good ideas floating around out there in urbanist camps (hi Yes Vancouver!), and good energy in other left-leaning parties (COPE gets full credit for making politics built around fighting class inequities look like fun!) Speaking of fun, I’m gonna do an animated gif thing to round things off. Here you go.

Election-2018-position-animated

Some Related Takes:

Cambie Report Data: google doc

Tom Davidoff‘s gradesheet approach: google doc

Christopher Porter’s (nicely done!): housing platform comparison

Allen Pike’s: breakdown


*- Worth noting: Iris Marion Young practically takes an anarchist stance on zoning: that it challenges the urban diversity she dearly wants to foster. As I discuss in my book, I’d rather reform zoning than abolish it, but overall she’s not wrong. She also thinks all planning should be done at a regional level (kinda like Metro Vancouver!).


Fall Talks

I’m talking about stuff this Fall! Here’s a quick run-down (in no small part to remind myself of what I need to be working on)

Richmond Public Library

author_events-bibliobanner

I’m excited to be giving a lecture about my book at the Richmond Public Library on Oct. 27th, 2.30-4pm, as part of their local author events. From the listing:

Nathanael Lauster, author of The Death and Life of the Single-Family House: Lessons from Vancouver on Building a Livable City, will be talking about how the single-family house came to acquire special protection across the Lower Mainland, why people are so attached to houses, and also how Metro Vancouver has moved further away from this specific housing form than any other metropolis in North America. In addition, he will also discuss two common questions with the audiences:

Why is acquiring a single-family house so important to so many people? What lessons, if any, does Vancouver hold for other metro areas?

Full listing and a registration sign-up here!


Pacific Housing Research Network (PHRN) / Housing Central Meetings

Turning to November, on Monday, November 19th, from 10.30-12pm, I’ll be speaking as part of the PHRN panels held within the annual Housing Central meetings at Vancouver’s Sheraton Wall Centre. I’ll be veering into my observations on evolving IMBY political coalitions and their role in inclusive housing provision.

Title: Backyard politics: A tour of evolving IMBY coalitions and rights frameworks supporting (and eroding) social inclusion
Abstract: NIMBY (Not In My Backyard) movements have been a longstanding concern for all housing developers, but especially those engaged in non-profit and low-income housing construction. Frequently NIMBY movements dominate and mobilize neighbourhood associations against developments that might “change the character” of “their” neighbourhoods. Recently a variety of YIMBY (Yes in My Backyard) movements have been organized to support developments in response to a variety of concerns, including the exclusionary aspects of NIMBYism and its failure to represent the diversity and interests of both local neighbourhoods and cities as a whole. Other IMBY movements, like PHIMBY (Public Housing In My Backyard) or QIMBY (Quality in My Backyard), shift between more general NIMBY and YIMBY coalitions depending upon what’s being built or proposed. In this paper, I provide a brief tour of the IMBY zoo and also attempt to decipher how rights claims and concerns for social inclusion get built into or left out of different kinds of coalitions. Where possible, I draw upon examples to illustrate claims and coalition-building dynamics both in BC and abroad.


Let’s Talk Housing: CMHC National Housing Conference

Almost immediately after the PHRN panels, I’ll be going to the National Housing Conference in Ottawa for a panel on Nov 22, 11.15-12.30pm on building an affordable future for rental housing.

I’ll be presenting on an ongoing research project I’m working on with Jens von Bergmann (mountainmath) and Douglas Harris (UBC Law), attempting to get a better sense of Who Lives in Condos?

Submission Title: Who Lives in Condos?

Summary: Theoretically, condominium developments offer a relatively new and exceptionally flexible form of housing stock. By legal innovation and subdivision of land costs, they enable a broader range of people to enter home ownership. This makes condominiums competitive with purpose-built rental buildings in high land-value areas, but when rented out by investor-landlords condominiums can also contribute to rental markets. Yet the flexibility of condominium housing stock comes at the cost of making the rights associated with both ownership and rental tenures more precarious. Moreover, condominiums are often vilified in debates over development. In the urban imaginary, new condominium developments are often assumed to bring only gentrifiers, fail to meet the needs of families, or go empty, serving merely as safety-deposit boxes in the sky. It’s useful to establish who lives in condominiums, both in terms of understanding who’s at risk of condominium-induced forms of precarity and how condominiums respond to housing needs more broadly. In this paper, we explore the socio-legal flexibility of condominiums and draw upon a mix of Canadian census data and administrative data to investigate how who lives in them has varied through time and across different Canadian cities. Where possible, we provide comparisons with other forms of development (e.g., freehold, purpose-built rental), holding other features constant (e.g., age, structure, location, number of bedrooms), to evaluate how condominium residents differ from others.


Should be fun! I’d love to connect with folks interested in my research at any and all upcoming events – or just drop me a line!

From Vancouver With Love

The Old Arbutus Corridor Out of Town

Dear Leaving Vancouver,

It’s not that I’m not into you. It’s just that I’m having a hard time committing.

I mean, don’t get me wrong. I’ve made some big decisions in my short life. I decided I wasn’t going to be just another sprawling North American city back in the early 1970s. That’s when I ditched the freeway and put in place boundaries, like the Agricultural Land Reserve, meant to preserve my livable figure. I’m proud to say that despite splurging on a few mansions here and there, I’ve pretty much stuck with it. And good news! People like me! They really, really like me!

VancouverUrbanBoundary
Urban Containment Boundary

But that’s part of the problem now, isn’t it? You feel like too many people like me, and since I’m not growing outward there’s just no room for you. Instead, it’s all about the bling. Like only the fast crowd can catch my attention any more.

I have to admit, there’s some truth to that. You see, I’m struggling with some family stuff. The olds aren’t always happy with the ways I’ve changed. And they’re terrible snobs. Like they think they should get to choose who I live with! And the only ones they think deserve me are those who can afford my most expensive tastes – fancy cars, detached houses, you know the drill. And, ok, I admit that with so many suitors my most expensive tastes have gotten really, really expensive!

Is it any wonder I’ve grown a little… high maintenance?

But I’m here to tell you that you don’t have to be rich! You don’t even have to be cool! It’s not you, it’s me, and I’m working on it. I really want you to stay. I do! As a matter of fact, I NEED you to stay. Someone’s got to work around here.

ResortCityZoning
Reserving Land for Millionaires?

So what has to happen? If I want you in my life, I think my tastes need to change. A little public transit here, some social housing over there. If I raise my property taxes, I can cover it. I mean, have you SEEN how low my taxes are? Lots of potential there. Then I just need to stop reserving so much room for that fancy-pants in-crowd. Like, why can’t I have low-rise rental housing everywhere? If I just work on myself a bit, I know I could make room for you!

That’s what I want, you know.

So help me follow-through on my commitments. Like I said, I’ve done it before. I can do it again. I can be sustainable, livable, AND inclusively welcoming. So encourage me to be the city I want to be. Stick around. Vote.

As for me, maybe all I really need to do is… grow up.

Love and Kisses,

Vancouver

Fleeing Millennial Zombies

We are plagued with zombie factoids. You can kill them over and over again with evidence of their falsehood, but they keep resurrecting and coming back because they fit prevalent narratives.

The “fleeing millennial” is one of Vancouver’s key zombie factoids. The basic idea is that the city is getting so expensive that it’s driving out millennials. Vancouver is sacrificing its own future! The detritus of uneaten avocado toast will ruin our tidy streets! (I kid, that’s what seagulls are for). The problem with this factoid is that it’s false. I’ve previously attempted to kill this idea here, here, here, and here. But it keeps coming back. It’s a zombie; undead and on the lookout for brains to eat.

As factoids go, this one highlights a real and pressing problem: the local unaffordability of housing. But it does so in a misleading and harmful fashion. It’s misleading because there is NO data anywhere suggesting that we’re selectively losing people in the age groups reasonably corresponding to millennials. It’s harmful because every time it re-appears, the fine print reveals that it necessarily valorizes some millennials over others.

The most recent resurrection of the fleeing millennial zombie factoid arrives via the folks at Better Dwelling, running their headline: See Ya! Local Millennials Are Abandoning Toronto and Vancouver. The valorization of a particular set of millennials receives a nod in the headline: we’re dealing with “local” millennials. Within the body of the piece, this is fleshed out: we’re dealing with intraprovincial migration patterns, between Metro Vancouver and other parts of BC, and between Metro Toronto and other parts of Ontario. Intraprovincial migration leaves out international immigration and interprovincial migration, the two other main components of migration overall (as described by Statistics Canada). Given that Toronto and Vancouver are Canada’s premier gateway cities, this is a pretty big oversight! Immigrants flood into these cities, with some staying while others move on to other parts of Canada.

I’ll come back to this problem, but let’s start with Better Dwelling’s focus, on intraprovincial migration. Can I replicate their findings drawing upon Statistics Canada components of population change data (StatCan 051-0057)? Nope.

Intraprovincial-Migration-MetVan

I can get the same pattern, but not the same numbers. Here’s what I get looking at intraprovincial migration (summing net change for the years and age groups covered and adding the historical context from 2002-2007 just because it’s there!) This worries me a bit, and I asked Better Dwelling for clarification, but they have yet to respond (I also checked my numbers with the ever-helpful Jens over at MountainMath, who also couldn’t reproduce Better Dwelling’s numbers).

At any rate, the pattern is the same. But the pattern is misleading. After all, we’re only looking at a single component of migration. What happens if we add them all in?

MigrationComponents-MetVan

Wow. That looks quite different! If anything, net migration from millennials (age 20-34) is soaring to all new heights in the latest five year period estimation. It’s just that intraprovincial migration has a slight drag on this pattern (compared to a more steady drag across other age groups). What to make of this?

As a gateway city, Vancouver’s population growth is driven first and foremost by international migration. Both interprovincial and intraprovincial migration play a role at the margins. We are definitely not losing millennials. But what about the claim that we’re losing “local” millennials? It’s a weird claim. It’s likely the case that many of the millennials showing up as international migrants in one period might later show up as intraprovincial or intraprovincial migrants in another. Ideally that’s what gateway cities do: take in huge numbers of migrants, keep some, and send others toward the broader set of communities in the province (and the rest of Canada) looking for workers and growth. Personally, I happen to know at least one Chinese immigrant to Vancouver now working and residing in Kelowna. It might be fun to break down intraprovincial migration by place of birth or the like, but absent that kind of careful analysis there’s no reason to imagine intraprovincial migration patterns identify “locals” or are uniquely informative about the state of millennials in Vancouver or Toronto.

As a methodological aside, it also feels a little odd to sum up the components of growth from Statistics Canada models in the time periods specified without acknowledging that they’re calibrated to the census years (2001, 2006, 2011, 2016). So 2012-2017 provides an estimated breakdown of components of change drawn from the combination of a 2011-2016 comparison with various sources of administrative data. The 2016-2017 estimations are especially subject to change! Still, it’s neat to see how Stats Can does this work. As a bonus, here’s what you get in terms of Statistics Canada’s model of population change by age group in Metro Vancouver moving forward from the the Census year (2016) to the next (2017), but setting births aside.

PopChangeComponents-2016-17-MetVan

What really jumps out is the contribution non-permanent residents are making! They don’t show up in net migration figures here, but wow! Look at how much they’re contributing to growth, especially in the late teens. See the CMHC’s write-up about the effects non-permanent residents might be having on housing demand, but keep in mind that many will transform (like I did) into permanent residents.

And in the meantime: watch out for zombies! Don’t let them near your brains!


[UPDATE: May 25th, 2018. This blog post was combined with a couple of others in its own The Tyee article! No, Vancouver Is Not Losing Its Millennials. Thanks to awesome local reporter Christopher Cheung for reaching out and pulling that together. After the Tyee piece went up, I’m told that Better Dwelling contacted them to report that they’d used the CANSIM table 051-0060 rather than CANSIM 051-0057, as above. This seems to explain the disjuncture in specific numbers, which is good! But the problems with ignoring interprovincial and international migration of millennials remain. Also, CANSIM 051-0060 covers a HUGE amount of territory. Rather than just looking at Metro Vancouver, it looks at an economic region defined as the “Lower Mainland-Southwest, British Columbia.” Unlike a metro regions, which build their integrity largely around daily commute-sheds, economic regions seem to work more like ways of dividing up the entire country into manageable, if somewhat arbitrary, contiguously defined units. So the economic region of “Lower Mainland-Southwest” combines the Census Divisions of Greater Vancouver, the Fraser Valley, the Sunshine Coast, and Squamish-Lillooet. Full Statistics Canada map here (it’s big!). The Immigration Settlement and Integration Program (ISIP) has put up a smaller map illustrating the economic regions of BC which I borrow below, showing what nice things you can do when you work to recognize and welcome international immigrants!]


BC Regions Map


Talking cool old maps

Here’s my talk from February 2018 for the Vancouver Historical Society, now preserved for posterity! I was really delighted to receive the invitation, and the crowd was fun. I’d really encourage others to check out their series of talks.

I concentrated on the earlier sections of my book, and found an awesome old fire insurance map of land use for downtown Vancouver in 1889, available at the Vancouver Archives. I used it as an illustration of how land uses mixed in Vancouver’s early years, much to the concern of reformers and the evolving middle class. Now, of course, it’s the block of Chinatown bounded by Main St (then Westminster) between Keefer and Pender (then Dupont). I’m hopeful I can track down more of these maps soon. Tips welcome!

OldVancouverFireMap-1889


Overbuilding vs. Undercounting

As mentioned in my previous post, the sensational claim that Vancouver has built 1.19 dwelling units for every new household added since 2001 has been making the rounds, leading many people to suggest Vancouver has over-built for the past fifteen years. We don’t need any more supply, they suggest! First, make better use of what we’ve got!

Here I want to offer an alternative theory: We haven’t been overbuilding at all. But we have been undercounting.

First let me reproduce the numbers behind the claim. Here’s what happens when we compare counts of dwellings in 2001 and 2016 to counts of households across the same years. (*correction: as pointed out in a later blog post, my #s are off here compared to Rose’s #s, likely a result of different sourcing and errors introduced in hasty tracking down/transcription – see also addendum below. These errors don’t change the substance of the broader critique introduced later in the post. See Jens for better replication!*)

RatioNewDwellingsNewHHs-2001-2016

Sure enough, Vancouver clocks in at a ratio of 1.19 Newly Counted Dwellings to Newly Counted Households between 2001 and 2016. BUT two things bear observing. 1) Vancouver isn’t especially unusual in this regard, and 2) I used the words “Newly Counted” rather than “Newly Built” for a reason.

It’s hard to count dwellings. I used to work cleaning up census data for public release as a post-doc with the Minnesota Population Center (beloved home of IPUMS census microdata files freely available to everyone). As a result, I have some idea how messy census data can be. Counting people is difficult at the scales at which censuses operate. Counting and classifying dwellings is only the first part of that endeavor. But every census year, the folks at Statistics Canada work toward getting better and better at their jobs. Everyone there deserves a raise!

Unfortunately, sometimes when people at the Census get better at counting, it screws up our ability to perform decent historical comparisons using the data. (A similar problem, of course, plagues homeless counts). In 2001 and again in 2006, the people working on the Canadian Census tried out some new techniques for counting dwellings. They footnoted these techniques, and raised flags about data comparability (for more follow-up on the links above), but I don’t think anyone has adequately accounted for their effects on our estimates of occupancy rates. So let’s do a little comparison. Here’s the proportion of dwellings occupied by usual residents from 1991-2016.

PercentDwellingsOccupied1991-2016

Notice how EVERY single one of our top fifteen metropolises shifts down together in occupancy between 1996 and 2006? By 2011, nowhere in the country had an occupancy rate anywhere near the (frankly unrealistic) highs of 1996. That’s a big old red flag that the methods Statistics Canada incorporated into the census for counting dwellings across these years underwent some pretty important changes, challenging comparability across different Censuses.

So, if friends shouldn’t let friends run historical comparisons of Dwelling Occupancy (by usual residents) using the 2001 and 2006 census years, then what data SHOULD we use to assess new supply? Fortunately, we have CMHC construction data! This is provided to Statistics Canada via surveys of municipal permits. Not all metro areas have this data made public, but metro Toronto, Montreal, Vancouver, and Winnipeg do! Let’s test construction against some census data, shall we?

First, let’s look at completions data (referring to new dwelling units added to the market) for five year periods. How well does this compare with the number of people who report living in a new dwelling unit in the Census at the end of the period? I matched up the timelines for census data (which always uses the past five years leading up to the Census, which happens in May) and completions data (reported on a monthly basis). Are we building a lot of homes that no one reports living in?

Completions2NewHousing1991-2016

Wow! Quite the opposite, it would seem. In early census years, more people report living in new homes than we have permitting data for.* Nevertheless, overall there’s a very close match between permitting data for new homes completed and census data on who reports living in a new home! This makes me feel better about both data sources. I read this to suggest that the permitting data is probably our best source for how much new housing we’re adding in a given metro area. For sure, it may miss internal subdivision of units and other sneaky additions that can be made to our housing stock, but it probably captures most new supply. Moreover – and this is important – very few new homes would appear to be empty – or even occupied by anything but their usual permanent residents. What do you know? When you build new homes for people, they report moving into them!

Ok, ok, so people like new homes. But what about the old homes destroyed to make the new homes? Good question. We haven’t really matched up new households between census years to new building stock yet. With both completions and demolitions data we should be able to track how many net dwellings we’re adding. I’m having a hard time getting all of the demolitions data I’d like, but drawing from the Metro Vancouver housing data books from 2010 and 2017, I can pull together enough demolitions data to get us back to 1999, and then impute the rest of the way back to 1996. Let’s compare new households counted across census years to net dwellings constructed during the same time periods** in Metro Vancouver. Just for kicks, we’ll throw in the additional number of dwellings counted during the same period.

NetConstructiontoNewHHs1996-2016

Wow! New households occupied by usual (or normal) residents very closely tracks net construction (completions – demolitions). In recent years, the relationship is almost one to one. In earlier years, we actually added more new households than we did net permitted housing units. Why? Well, we probably found and/or counted some new households living in basement suites and other internal subdivisions not captured by the permitting data. After all, the census would appear to be getting better and better at finding these things! Yay!

Key points for the day:

  1. Census workers should be paid more.
  2. Friends don’t let friends use intercensal comparisons of dwelling counts to establish trends during years when dwelling count procedures change.
  3. People move into new housing when we build it!
  4. There is very little “slack” in the relationship between household formation and supply of housing in Vancouver – so adding new supply is definitely something we should be looking to do.


* could be a weighting issue, an inaccurate reporting issue, or an incomplete permitting data issue.

**- this time I’m being a little more conservative in matching, using net data on previous years and just ignoring the period from Jan-May of the census year in gathering completion data.

[Thanks to Richard Wittstock for sharing his spreadsheet on permitting data, which helped me track down sources for the above!]

[Addendum, Dec. 4th, footnoting sources: After some frustration trying to find dwelling and occupied by usual resident household data for 1996 and 1991, I used hard copies of Census reports for 1991 and 1996 from UBC Library to find dwelling count data, then compared to household counts from Census reports in on-line community profiles to find households occupied by usual residents. This looks notably different from results produced by Andy Yan in the Vancouver Sun earlier this year. His results – for Vancouver only – look much more realistic! The underlying issues with comparing dwelling counts across 2001 and 2006 census years remain (though the trend may vary – in Andy’s data there’s actually a marked drop in non-occupied units in 2001, which I find fascinating), but I’m following up to try and track down better stats on these years. Other sourcing and data matching should be apparent from the descriptions above, but it’s worth noting that the proportion of residents identifying themselves as living in housing built in the five years leading up to each census comes mostly from census profiles, drawn from census long-form information, weighted to reflect households. I also drew this data from on-line analyses using UBC’s subscription to the CHASS interface with public-use census micro-data for some earlier years. Then I compared these figures to Metro Area-specific construction data for the five years leading up to the Census, including the months of January-April in the Census Year itself. Censuses, of course, are usually carried out in May. I was more conservative in estimating net dwellings constructed, counting only completed units up to the year ahead of the census year rather then extending into May, which allowed me to link up yearly demolitions data from Metro Handbook(s) – linked above. This means there may be slightly more net units added over a given time period – four months worth – than are tracked here. At the same time, I’m not entirely certain how and when newly constructed units get added to Census counts of dwellings and households in the process of preparing the Census! I’d really love to get a better handle on how Census counts of dwellings work… and possibly fail to work… in a practical and time-lined sense. I’m a big fan of their illustrations for how to classify units! Aren’t they vaguely adorable?]

Media Coverage of My Book

The Death and Life of the Single-Family House: Lessons from Vancouver on Building a Livable City (winner of the John Porter Tradition of Excellence Book Award from the CSA) has now been covered by:

BOOK REVIEWS (as of Sep 24th, 2018)

  • BOOK REVIEW: Housing Studies TBD – 2018 – Hazel Easthope
  • BOOK REVIEW: Contemporary Sociology 47(1) – 2018 – Brian J. McCabe
  • BOOK REVIEW: Journal of Urban Affairs TBD – 2018 – Wayne Beggs
  • BOOK REVIEW: Canadian Journal of Urban Research 26(1) – Summer 2017 – Joshua Evans
  • BOOK REVIEW: Choice 54(10) – June Issue (2017) – M. Gunter, Jr.
  • BOOK REVIEW: Spacing Vancouver (Feb 14, 2017) – Yuri Artibise
  • BOOK REVIEW: New York Journal of Books (Nov 28, 2016) – Marilyn Gates

TV/RADIO/PODCAST (as of Sept 30th, 2017)

  • Roundhouse Radio (The Real Estate Therapist, Sept 30, 2017) – Interview with Joannah Connolly.
  • Science for the People (podcast, Apr 28, 2017) – Interview with Rachelle Saunders
  • Metropolis (Metro podcast, Nov 28, 2016) – Interview with Luke Simcoe & Matt Elliott
  • Arts on Air (CiTR 101.9, UBC Arts podcast, Nov 28, 2016) – Interview with Rachel Sanders & Brittany Duggan
  • C-FAX Radio (1070 AM, Victoria, Nov 7, 2016) – Interview with Adam Stirling
  • CBC Radio (The 180, Oct 30, 2016) – Interview with Jim Brown
  • Global TV (Global News at Noon BC, Oct 21, 2016) – interview with Sophie Lui (re-posted Jan 19, 2017, in support of piece on home prices)
  • Business News Network TV (Oct 14, 2016) – interview
  • CKNW/Omni Radio (The Jon McComb Show, Oct. 12, 2016) – interview with Jon McComb
  • Vancouver Real Estate Podcast (Oct 5, 2016) – interview with Matt and Adam Scalena
  • CBC Radio (On the Coast, Aug 11, 2016) – interview with Stephen Quinn [listen to just my clip here]

PRINT/ON-LINE (as of Jan 6th, 2017)


Pre-sale Media Coverage: The Death and Life of the Single-Family House

A few local media outlets have picked up interest in my book since I announced it was available for pre-sale on twitter and this blog.  On the one hand, this is great!  I really welcome the exposure for both the book and the ideas it contains.  On the other hand, I worry (together with my publisher’s media rep) about too much early exposure before the book is actually available (October!).  I don’t really know what the right balance is – we don’t get a lot of media training in academia – but I’ll keep working on figuring it out.  In the meantime, I ask for patience from interested reporters with my ham-fisted efforts to manage the roll out of the book and its ideas, and I’m hopeful interest continues into when the book is actually ready to fall into readers’ hands.

For now here’s the audio clip from a recent interview talking about my forthcoming book with Stephen Quinn on CBC’s On The Coast.  (Or you can just listen to the whole August 11th, 2016 show).  I’m a regular listener, so it was really fun to meet Stephen Quinn and Amy Bell and see the inside of the CBC studio. [Update: and here’s the CBC write-up].

Prior to the radio interview, Jen St. Denis also interviewed me about the book for the Metro News, in a nice little piece posted here.  I think the piece was good, but it’s worth making two quick clarifications:

1) The 80% of land base figure speaks to 80% of land set aside to support residential uses (rather than 80% of all land as a whole), and covers the municipality of Vancouver. Metro Vancouver has data on land use broken down by municipality (and a lot of other data besides!)  Also Jens von Bergmann over at MountainMath (mentioned in the piece) has a beautiful map breaking down land use by lot within the City of Vancouver, which everyone should check out.  It really demonstrates just how much land has been set aside for single-family detached houses (almost entirely in protected RS zones, though there are also duplexes in RT zones and houses in Shaughnessy included, along with a scattering of old houses remaining in places unprotected by zoning).

2) The accompanying photo for the piece, as multiple people have pointed out, looks like it was taken at Mole Hill, which is a lovely little development preserving and rehabilitating old houses downtown by subdividing them up into apartments.  To be clear, the census would not consider these to be single-family detached houses, nor would the city.  But the ambiguity of how they LOOK like houses (and very photogenic ones at that) is really interesting.  This speaks to the focus of my first chapter in the book, laying out just what we talk about when we talk about single-family detached houses, and how the legal categories don’t always match people’s lay understandings of what counts as a house.  It also speaks to the many possibilities for subdividing existing houses to support more households – if zoning laws were modified to allow such a thing (it’s already the case, of course, that most RS zoned lots in Vancouver can now already support up to three households through secondary suite and laneway housing provisions).