

We most commonly hear about homelessness as a big city housing issue. But are big cities where people are most at risk of becoming homeless? Comparing homeless count data enables us to start answering this and related questions.
Homeless counts draw upon volunteers and service-providers to provide point-in-time (one night) estimates of people without regular access to long-term housing. People are typically defined to be experiencing homelessness, as in the BC Homeless Count from 2018, “if they do not have a place of their own where they pay rent and can expect to stay for at least 30 days” (p. 11). People counted as homeless include both those staying in shelters and transition houses (counted by service providers) as well as those sleeping in “…alleys, doorways, parkades, parks, and vehicles or people who were staying temporarily at someone else’s place (couch surfing)….” (p. 11-12). Suffice it to say, this is not an easy population to find or track on any given night, and people are often also asked about where they spent the prior night during visits to service providers the next day. As a result, the “hidden” homeless population is always going to be larger than the number of people counted through homeless counts, meaning counts are always underestimates.
Homeless counts are also a lot of work, and even with the generosity of volunteers, they require significant funding and coordination to carry out in a defensible manner. We tend to know a lot more about homelessness in big cities in part because they’ve got more resources to direct toward tracking the issue. So it’s great news that BC Housing has been working with partners to provide counts for smaller communities. The BC Homeless Report, delivered in December of 2018, summarized much of what’s been learned so far.
The report is worth a read, and the count data, all by itself, is useful in assessing where urgent need for more supportive housing can be found. Here’s a lovely summary map of the data for BC, bringing together new counts funded for smaller communities with the most recent (at the time) data from other counts, funded by the Federal Government or independently (often from larger communities like Metro Vancouver and the Fraser Valley).
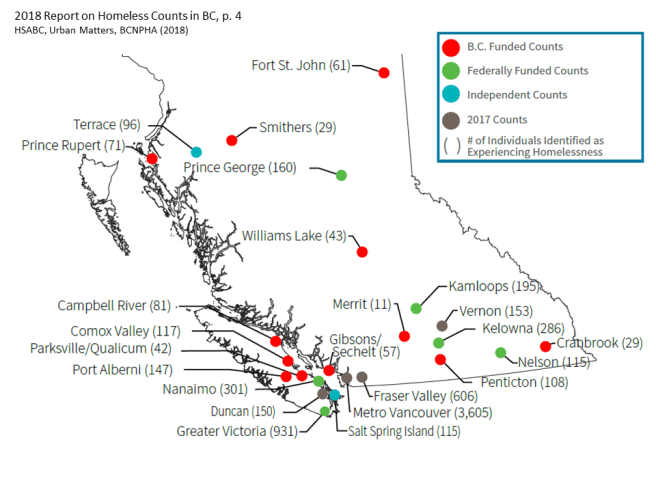
We can clearly see from the numbers that more people are homeless in Metro Vancouver than anywhere else in BC. But Metro Vancouver is larger than anywhere else, so this doesn’t seem too surprising. What’s more, adding all of the communities covered, more people appear to be homeless outside of Metro Vancouver (3,904) than within (3,605), despite the fact that Metro Vancouver contains over half of the total provincial population within its boundaries. And we haven’t even got homeless counts here for several large communities in BC (e.g. Squamish, Whistler, Powell River, Trail). So already we know homelessness seems bigger outside of Metro Vancouver than within. Maybe not just a big city problem after all!
But we can try and do better than that. Let’s try and create a rough baseline risk of experiencing homelessness at a given point in time for each community covered by a homeless count. We can do this by dividing the number of people counted as homeless by the total number of residents in each community. This seems pretty simple, but there are actually a number of considerations that go into creating this baseline risk (which is perhaps why the report itself does not attempt it). First, are most people experiencing homelessness coming from the community where they’re being counted? In fact, we know that they are. Check table 3.9 (p. 37). In no community studied in the report do the majority of people counted as homeless report living there for less than a year. In most communities studied, the majority counted as homeless have lived in the area for five years or longer. Homelessness is mostly local. So we’re on sound footing assessing the risk of homelessness as local.
But what do we mean by local? Local can easily cross municipal boundaries to include broader catchment areas (e.g. metropolitan areas). And there may be clustering of homelessness within broader catchment areas, following services and shelters. We know, for instance, that while the City of Vancouver contains around a quarter of the Metro Area’s population, it includes well over half of the region’s homeless counted, (table 34, p. 39). So fitting local base population to local homeless count isn’t entirely straightforward. Still, outside of metro areas these problems are diminished.
In the chart below, I draw upon homeless count data while making a best guess as to what constitutes a local population to set a baseline risk of experiencing homelessness in each community where counts took place. I mostly use municipalities here, but switch to metro area or regional district where suggested by the Homeless Count Report. For BC communities, I order by population size. But I also include, for comparison purposes, baseline risks calculated from homeless counts for a few other big cities (Calgary, New York City) as well as King County (Seattle) and LA County (Los Angeles). Data for US cities come from a big report to Congress also released in 2018.
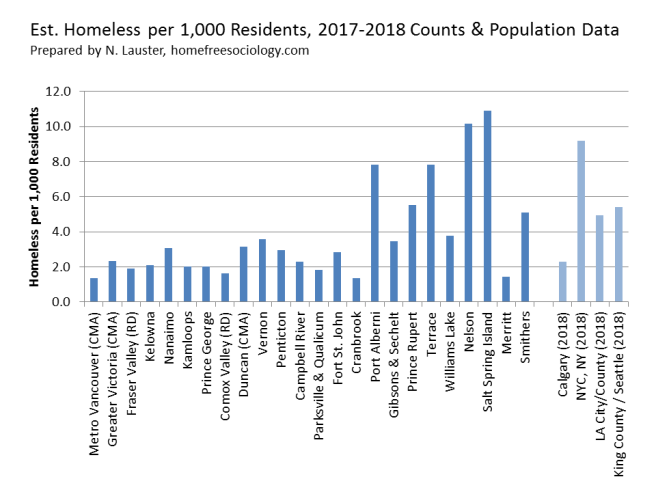
Pulling all the data together, it appears that homelessness is definitely not just a big city problem. Tiny little Merritt, BC, appears to have the same baseline risk of homelessness (1.4 in 1,000) as Metro Vancouver. More strikingly, the little communities of Nelson and Salt Spring Island seem to have nearly 8x the risk for people experiencing homelessness as Metro Vancouver. These estimates reveal greater prevalence of homelessness for these places than we get from population-adjusted counts in New York City, Los Angeles, or Seattle.

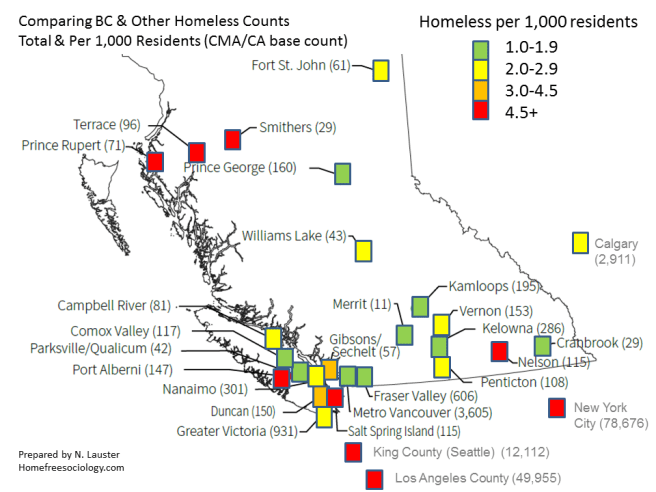
Let’s put some bands around these estimates and put them back on the map, where the southern half of BC (rightfully) takes its place as centre of the world. In comparative perspective, while Metro Vancouver contains a LOT of people experiencing homelessness, the overall risk of experiencing homelessness at any point in time seems strikingly low, putting the area on par with other communities like Cranbrook, Merritt, and Comox Valley. The risks of homelessness seem higher in other large communities, including Nanaimo, Greater Victoria, and Kelowna. But it’s the high risks in small communities; Smithers, Terrace, Prince Rupert, Port Alberni, Nelson, and Salt Spring Island, that really stand out. Each of these little communities looks like the big cities to our South in terms of the base risk of experiencing homelessness.
For comparison’s sake, let’s see what happens if we use the (more generous) base populations of Metro Areas (CMAs and CAs) from BC Stats in dividing count data to assess risks of homelessness. Does much change?
Not really. A few communities (e.g. Nanaimo, Williams Lake, Vernon) move down a category, but we don’t see major shifts, which is encouraging. Still lots of caveats remain with respect to the data: is the quality the same across communities? How do count methods differ? Check the reports for these and other details, and by all means have a look at the reports and play with the data yourself! I’ll park my little excel datasheet here in case anyone wants to check my work or use it.
(And yes, yes, in case you’re wondering I’m still hoping to transition to a nice transparent R system with GitHub support later this year, but I’m… slow… and sometimes excel with hand-entered data – it’s artisanal! – works ok too).
