Overbuilding vs. Undercounting

As mentioned in my previous post, the sensational claim that Vancouver has built 1.19 dwelling units for every new household added since 2001 has been making the rounds, leading many people to suggest Vancouver has over-built for the past fifteen years. We don’t need any more supply, they suggest! First, make better use of what we’ve got!

Here I want to offer an alternative theory: We haven’t been overbuilding at all. But we have been undercounting.

First let me reproduce the numbers behind the claim. Here’s what happens when we compare counts of dwellings in 2001 and 2016 to counts of households across the same years. (*correction: as pointed out in a later blog post, my #s are off here compared to Rose’s #s, likely a result of different sourcing and errors introduced in hasty tracking down/transcription – see also addendum below. These errors don’t change the substance of the broader critique introduced later in the post. See Jens for better replication!*)

RatioNewDwellingsNewHHs-2001-2016

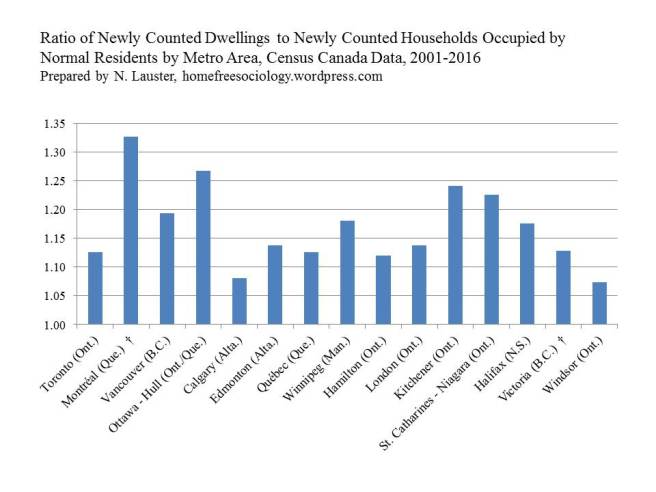
Sure enough, Vancouver clocks in at a ratio of 1.19 Newly Counted Dwellings to Newly Counted Households between 2001 and 2016. BUT two things bear observing. 1) Vancouver isn’t especially unusual in this regard, and 2) I used the words “Newly Counted” rather than “Newly Built” for a reason.

It’s hard to count dwellings. I used to work cleaning up census data for public release as a post-doc with the Minnesota Population Center (beloved home of IPUMS census microdata files freely available to everyone). As a result, I have some idea how messy census data can be. Counting people is difficult at the scales at which censuses operate. Counting and classifying dwellings is only the first part of that endeavor. But every census year, the folks at Statistics Canada work toward getting better and better at their jobs. Everyone there deserves a raise!

Unfortunately, sometimes when people at the Census get better at counting, it screws up our ability to perform decent historical comparisons using the data. (A similar problem, of course, plagues homeless counts). In 2001 and again in 2006, the people working on the Canadian Census tried out some new techniques for counting dwellings. They footnoted these techniques, and raised flags about data comparability (for more follow-up on the links above), but I don’t think anyone has adequately accounted for their effects on our estimates of occupancy rates. So let’s do a little comparison. Here’s the proportion of dwellings occupied by usual residents from 1991-2016.

PercentDwellingsOccupied1991-2016

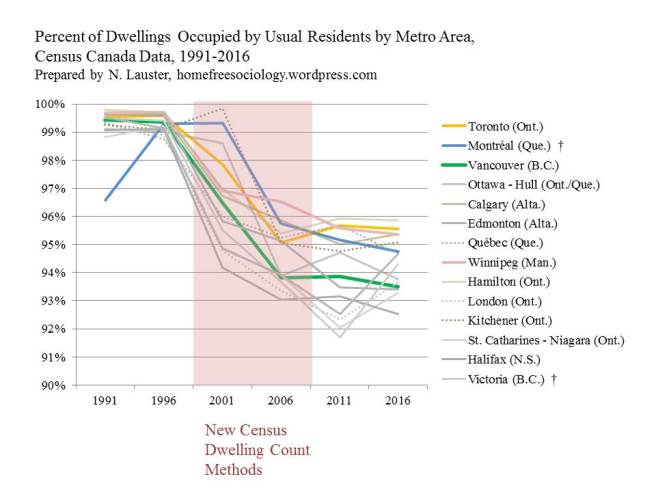
Notice how EVERY single one of our top fifteen metropolises shifts down together in occupancy between 1996 and 2006? By 2011, nowhere in the country had an occupancy rate anywhere near the (frankly unrealistic) highs of 1996. That’s a big old red flag that the methods Statistics Canada incorporated into the census for counting dwellings across these years underwent some pretty important changes, challenging comparability across different Censuses.

So, if friends shouldn’t let friends run historical comparisons of Dwelling Occupancy (by usual residents) using the 2001 and 2006 census years, then what data SHOULD we use to assess new supply? Fortunately, we have CMHC construction data! This is provided to Statistics Canada via surveys of municipal permits. Not all metro areas have this data made public, but metro Toronto, Montreal, Vancouver, and Winnipeg do! Let’s test construction against some census data, shall we?

First, let’s look at completions data (referring to new dwelling units added to the market) for five year periods. How well does this compare with the number of people who report living in a new dwelling unit in the Census at the end of the period? I matched up the timelines for census data (which always uses the past five years leading up to the Census, which happens in May) and completions data (reported on a monthly basis). Are we building a lot of homes that no one reports living in?

Completions2NewHousing1991-2016

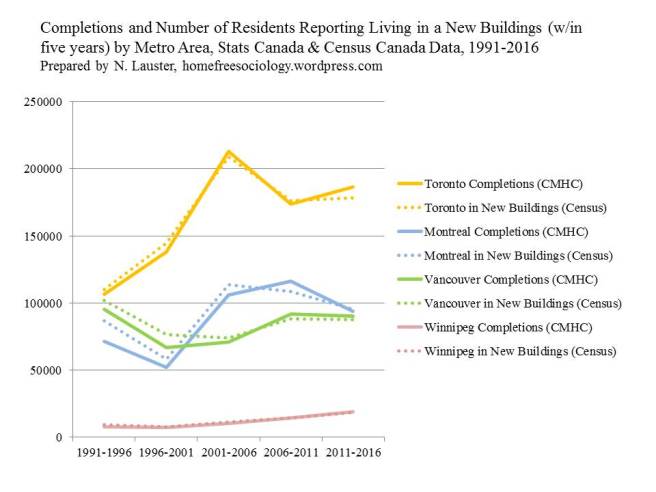
Wow! Quite the opposite, it would seem. In early census years, more people report living in new homes than we have permitting data for.* Nevertheless, overall there’s a very close match between permitting data for new homes completed and census data on who reports living in a new home! This makes me feel better about both data sources. I read this to suggest that the permitting data is probably our best source for how much new housing we’re adding in a given metro area. For sure, it may miss internal subdivision of units and other sneaky additions that can be made to our housing stock, but it probably captures most new supply. Moreover – and this is important – very few new homes would appear to be empty – or even occupied by anything but their usual permanent residents. What do you know? When you build new homes for people, they report moving into them!

Ok, ok, so people like new homes. But what about the old homes destroyed to make the new homes? Good question. We haven’t really matched up new households between census years to new building stock yet. With both completions and demolitions data we should be able to track how many net dwellings we’re adding. I’m having a hard time getting all of the demolitions data I’d like, but drawing from the Metro Vancouver housing data books from 2010 and 2017, I can pull together enough demolitions data to get us back to 1999, and then impute the rest of the way back to 1996. Let’s compare new households counted across census years to net dwellings constructed during the same time periods** in Metro Vancouver. Just for kicks, we’ll throw in the additional number of dwellings counted during the same period.

NetConstructiontoNewHHs1996-2016

Wow! New households occupied by usual (or normal) residents very closely tracks net construction (completions – demolitions). In recent years, the relationship is almost one to one. In earlier years, we actually added more new households than we did net permitted housing units. Why? Well, we probably found and/or counted some new households living in basement suites and other internal subdivisions not captured by the permitting data. After all, the census would appear to be getting better and better at finding these things! Yay!

Key points for the day:

  1. Census workers should be paid more.
  2. Friends don’t let friends use intercensal comparisons of dwelling counts to establish trends during years when dwelling count procedures change.
  3. People move into new housing when we build it!
  4. There is very little “slack” in the relationship between household formation and supply of housing in Vancouver – so adding new supply is definitely something we should be looking to do.


* could be a weighting issue, an inaccurate reporting issue, or an incomplete permitting data issue.

**- this time I’m being a little more conservative in matching, using net data on previous years and just ignoring the period from Jan-May of the census year in gathering completion data.

[Thanks to Richard Wittstock for sharing his spreadsheet on permitting data, which helped me track down sources for the above!]

[Addendum, Dec. 4th, footnoting sources: After some frustration trying to find dwelling and occupied by usual resident household data for 1996 and 1991, I used hard copies of Census reports for 1991 and 1996 from UBC Library to find dwelling count data, then compared to household counts from Census reports in on-line community profiles to find households occupied by usual residents. This looks notably different from results produced by Andy Yan in the Vancouver Sun earlier this year. His results – for Vancouver only – look much more realistic! The underlying issues with comparing dwelling counts across 2001 and 2006 census years remain (though the trend may vary – in Andy’s data there’s actually a marked drop in non-occupied units in 2001, which I find fascinating), but I’m following up to try and track down better stats on these years. Other sourcing and data matching should be apparent from the descriptions above, but it’s worth noting that the proportion of residents identifying themselves as living in housing built in the five years leading up to each census comes mostly from census profiles, drawn from census long-form information, weighted to reflect households. I also drew this data from on-line analyses using UBC’s subscription to the CHASS interface with public-use census micro-data for some earlier years. Then I compared these figures to Metro Area-specific construction data for the five years leading up to the Census, including the months of January-April in the Census Year itself. Censuses, of course, are usually carried out in May. I was more conservative in estimating net dwellings constructed, counting only completed units up to the year ahead of the census year rather then extending into May, which allowed me to link up yearly demolitions data from Metro Handbook(s) – linked above. This means there may be slightly more net units added over a given time period – four months worth – than are tracked here. At the same time, I’m not entirely certain how and when newly constructed units get added to Census counts of dwellings and households in the process of preparing the Census! I’d really love to get a better handle on how Census counts of dwellings work… and possibly fail to work… in a practical and time-lined sense. I’m a big fan of their illustrations for how to classify units! Aren’t they vaguely adorable?]

Notes on the “Myth” of housing supply

Much has been made of a recent study purporting to demonstrate that adding to supply has done little to nothing to bring greater affordability to Canada’s most unaffordable cities. Though I’m loathe to keep it in the limelight, I feel some responsibility to respond to the study, both because I was quoted in its initial media roll-out (despite not having had a chance to see the study), and because once the study was finally written and released it cited me – kind of – through an old press release for my book (To the author: thanks for citing me, though I might also recommend actually reading my book!).

Unfortunately, I need to start by noting that the study itself is not high quality, either theoretically or methodologically. The terms supply and demand are not conceptualized in the way the economists who more or less invented them use them (i.e., as terms in the balancing equation that constitutes the market pricing mechanism), but rather in somewhat idiosyncratic fashion. In part as a result, I initially found it a little confusing to respond to the study. I certainly agree that widening inequality makes our general reliance upon market-distribution of housing problematic for insuring equitable outcomes. In other words, the whims of rich people for a second or third home carry way more weight in the market than the shelter needs of poor people. That is a real problem that would be entirely consistent as an interpretation of the study’s findings. But that’s not the same as arguing that supply doesn’t matter, and indeed would even suggest that adding lots of non-market housing (new supply!) would be a direct way of insuring the housing needs of poor people outside of the market.

It would seem to me that the only reason to suggest supply DOESN’T matter is to effectively take off the table many policy options that might help address our current housing affordability issues. It’s kind of like we’re all in a sinking boat. Most of us are saying, “we’ve got to bail out this water and plug that leak in order to stay afloat!” But someone in the boat is picking a fight, arguing, “No! Look, we’ve tried bailing out water. Look at all the water we’ve bailed out! But now we’ve still got water in the boat. We should stop bailing out and just focus on plugging the leak.” That’s an interesting strategy, but I’d rather stick with bailing out and plugging up at the same time. (I’ll leave the economists out there to keep providing other metaphors).

So yes, I’ll continue to argue for more supply – especially by enabling more housing options on all that single-family residential (RS-zoned) land in and around Vancouver currently reserved only for millionaires. But I’ll ALSO continue to suggest we should be doing things to make the housing market work better, including (but not limited to):

  • Taxing Vacant Homes (and vacant lots!) like Vancouver’s new Empty Homes Tax
  • Raising Property Taxes, esp. in progressive fashion
  • Rebalancing tax burdens from income to property, as with the clever BC Housing Affordability Fund proposal
  • Cap the currently unlimited tax exemption of capital gains from sale of primary residence

All of these things would make investment in housing as a commodity less profitable and help remove some incentives currently in place to sit on empty properties, without renting them out, in order to accrue the capital gains by doing nothing as the property appreciates (e.g. speculation). But if we’re truly concerned about housing affordability, let’s not tie one hand behind our backs. Let’s keep bailing out water and plugging the leaks in our housing market at the same time.

What about the methods of the study themselves? They need some work. For instance, the author uses different measures and different data sources to compare affordability across time, with the most recent data (taken from Demographia – not gonna link to them) also the least transparent. The author also only focuses on market purchase price (as opposed to rent and/or cooperative share price), effectively setting aside those for whom affordability is a more life and death matter. I’m not going to do a deep dive here, in part because with respect to purchasing affordability, even had the comparison been carried out more carefully, the same results would obtain. There’s no doubt Vancouver has gotten more expensive in recent years!

But what about that supply issue? Have we been overbuilding as much as the author suggests, adding an eye-popping 1.19 dwellings for every new household created since 2001? I replicated this result based on census data I gathered right after the first media report came out, and it deserves its own blog-post (up next! spoiler: I’m pretty sure we’re not overbuilding). Before I get there let me leave you with recent vacancy rates for rentals in Metro Vancouver. If we’ve got too much supply, it sure hasn’t hit the purpose-built rental market. Latest update just came out. Good news! We’re almost back up to 1%.

Vacancy-MetVanHouseBook


Losing my religion

From the start, sociologists have been fascinated with how city-living influenced morality, religion, and mental life. Even medieval proto-sociologists, like Ibn Khaldun, wrote about the “natural groups” of Bedouins and sedentary town folk, chastising the latter for the corrupt state of their souls:

Sedentary people are much concerned with all kinds of pleasures. They are accustomed to luxury and success in worldly occupations and to indulgence in worldly desires. Therefore, their souls are colored with all kinds of blameworthy and evil qualities. The more of them they possess, the more remote do the ways and means of goodness become to them. Eventually they lose all sense of restraint. [link]

Where Khaldun saw moral decay in the settled urban life, Simmel (1903) saw the rise of individualism and a blasé attitude.

If one asks for the historical position of the two forms of individualism which are nourished by the quantitative relation of the metropolis, namely, individual independence and the elaboration of individuality itself, then the metropolis assumes an entirely new rank order in the world history of the spirit. The eighteenth century found the individual in oppressive bonds which had become meaningless-bonds of a political, agrarian, guild, and religious character. They were restraints which, so to speak, forced upon man an unnatural form and outmoded, unjust inequalities.

Put differently, Khaldun and Simmel roughly agree on the underlying urban dynamics, if not on their desirability. Left to its own devices, city-living reduces the hold of organized religion upon the soul. And yet, the very organization of religion demands a certain gathering together of like-minded people. In effect, organized religion requires the kind of density only really found in cities. Bit of a conundrum.

At any rate, this is really just setting up my curiosity over how religion is distributed by metropolitan area in Canada. Unlike in the US, we’ve got Census data (or in the case of 2011, National Housing Survey Data) on religious affiliation. It’s definitely not the same as religiosity or fervor or spiritual life. But it does tell us something about the reach of organized religion. As it turns out, all across Canada, most Canadians still have some religious affiliation.


Religion-Metro

Quebec remains decidedly Catholic, even if in many cases this marks more of a cultural affiliation than any belief or strict adherence to dogma. The vast majority of Quebecois still identify as Catholic, even in Montreal (64%), the Canadian capital of all things blasé. Nevertheless, Montreal, like other big (one million plus) metros, is far more diverse in the kinds of religion people practice than the rest of Quebec, with vibrant Jewish and Muslim communities. Metro Toronto adds large Hindu, Sikh, and Buddhist constituencies to the mix, and is also (no surprise) decidedly less Catholic than Montreal.

In general, moving westward from Toronto, metropolitan residents are more and more likely to have no religious affiliation whatsoever. At the far western edge of Canada, little Victoria is the least religious of all, with fewer than half of its residents declaring any affiliation! Of note, Vancouver remains the least religious of the big metro areas, beating out Calgary, Edmonton, Toronto, Ottawa, and Montreal in roughly that order and following a West to East trajectory. Kind of interesting!

Yet Vancouver is also the most Sikh and most Buddhist part of Canada. Here the gateway status of Vancouver mixes in interesting fashion with its history of immigration. This leaves open an interesting question. As different immigrant groups arrive in Vancouver, are they making it more religious? Does Vancouver’s overwhelming secularism affect minority communities the same way it does everyone else? Or are new religious communities expanding in Vancouver as different groups gain density and the ability to organize more effectively?

Here I’ll just use visible minority status as an (imperfect) shortcut for different groups in Vancouver, breaking down religious affiliation accordingly, and comparing to the distribution we see across Canada.

Religion-Metro-VisMin

The figure above really demonstrates the assortment of religious tradition by different minority groups (as well as non-minorities). South Asians in Metro Vancouver are much more Sikh than in the rest of Canada. Arabs and West Asians are mostly – but not entirely – Muslim just about everywhere you go. South Asians, Filipinos, and Arabs are the most religious minority groups, despite their differing religious profiles. By contrast, Chinese and Japanese minority groups are the least religious (in marked contrast to Koreans – see the research of Judy Han on this, or just watch Kim’s Convenience).

Vancouver as a big metro area really is less religious, across nearly every visible minority group, than we see for Canada as a whole. The proportion of people identifying as having “No Religious Affiliation” averages almost 50% higher across visible minority categories in Vancouver, as compared to Canada.

Why? Good question. Has Vancouver led us to become too “accustomed to luxury and success in worldly occupations and to indulgence in worldly desires,” As Khaldun might have it? Or maybe Vancouver is just the Canadian epicentre of, “individual independence and the elaboration of individuality itself,” as suggested by Simmel. That western gradient might suggest a potent mixture of frontier-mythologizing, migrant self-selection, and Simmel-style urbanism at work. But I have to admit, I’ve got no problem going with Khaldun if it means I can pit local churches, mosques, and temples against the sheer ubiquity of Vancouver’s fancy sports cars.

Ok, here’s REM: