Bright Lights, Big City, Bigger Metro Area

The young are generally drawn to the central cities of big metropolitan areas in North America. That’s where the bright lights can be found! The action! The scene! And also most of the universities, the majority of metropolitan rental stock, lots of the jobs, etc.

Vancouver is no exception. As revealed in previous posts looking at net migration patterns, the City of Vancouver really draws in the young people, both from the surrounding suburbs and further abroad. Then many of those young people gradually have kids and settle down into the surrounding suburbs again. Others remain, renewing the population of children and middle-aged stalwarts in the city. For the metro region as a whole, just how many people remain in the central city as they age and how many move out to the suburbs might not matter a great deal. But for a variety of municipal purposes (including the vitality of school districts), these patterns can matter a lot!

So is Vancouver weird in its age distribution with respect to what proportion of people live in its central city?

One issue in answering this question is the relative size of the City of Vancouver relative to the metro area as a whole. The City of Vancouver, in 2016, reached just over 630,000 people. But the metro area (CMA) of Greater Vancouver is much larger, reaching nearly 2.5 million people. In other words, the City of Vancouver is at the centre of a fragmented metro area much larger than itself. This is quite different from the situation of many other central cities where their boundaries contain large portions of their own suburbs (like Edmonton or even Toronto), obscuring the mobility of the young. Ideally we’d want to compare Vancouver with other metropolitan areas with central cities of about the same size to get a feel for how weird we might be.

Cascadia to the rescue! Let’s look to our sister cities to the south. The City of Portland’s population, at just over 610,000 in 2015, is quite comparable to the City of Vancouver. The Metro population of Portland, at just over 2.3 million, is also nearly the same. For good measure, let’s also throw in Seattle, with a city of similar size (just over 650,000), but a significantly larger metro area (3.6 million).

So how does the proportion of various age groups residing in the eponymous central cities compare across these three metropolitan areas?

Cascadia-AgeGroupCentralCity

There’s definitely a pattern here. Central university cities within much larger metro areas tend to concentrate young adults. They also concentrate the elderly, though to a lesser extent. But they consistently lose those in middle age (and their school-aged children) to the more suburban parts of the metropolitan area.

Overall Vancouver looks a lot like Portland and Seattle to me. This despite quite different housing markets and housing stock. If anything, what stands out is that the City of Vancouver seems to be retaining MORE of its school-aged children than its similarly positioned neighbours to the south. And it’s also attracting a greater proportion of the elderly.

What else have I learned? Cascadian comparisons are actually pretty cool! Bring on the Cascadia Urban Analytics Cooperative!

My award-winning book wins an award!

The Death and Life of the Single-Family House just won the Canadian Sociological Association‘s John Porter Tradition of Excellent Book Award. I’m truly honoured by this award, especially by the company it allows me and my book to keep! My thanks go out to the review committee, and also to my very supportive team at Temple University Press., especially the editors of the Urban Life, Landscape, and Policy series.

I’m joined by three other members of the UBC Sociology Department on the list of awards handed out by CSA this year, including my good friend Sean Lauer who won the Angus Reid Applied Sociology award as a Practitioner. Incidentally, he and fellow faculty member Carrie Yodanis also have a book out this year, called Getting Married: The Public Nature of Our Private Relationships. Two of our graduate students, François Lachapelle and Patrick Burnett also won an award for their paper, “Canadianization Movement, American Imperialism, and Scholastic Stratification: Professorial Evidence from 1977 to 2017.” To be sure, this is important stuff (and I say that as an American immigrant to Canada and beneficiary of the processes described).

But back to the company my book gets to keep! Through the CSA Awards, I’m excited to discover Dalhousie Prof. Karen Foster‘s new book, Productivity and Prosperity: A Sociological History of Productivist Thought, published by the great team at Univ. of Toronto Press. (I’m also looking forward to reading their recently published Gentrifier, but that’s another story). Prof. Foster’s work looks right up my alley in terms of trying to get at how economic concepts like “productivity” get measured and talked about in ways that are both socially constructed (often in a problematic fashion) and also highly consequential in terms of how they shape public policy. Really cool stuff – I’m looking forward to reading it!

The list of past award winners of the John Porter Award also places my book in brilliant company. I’ve been longing to get a copy of Vic Satzewich‘s book, Points of Entry: How Canada’s Immigration Officers Decide Who Gets In, from the excellent UBC Press, for quite some time now. This is an area of real interest to me (for instance, I regularly have students read some of the training documents for how immigration officers determine which marriages are “real”). Prof. Satzewich’s influential work has been cited by Canadian policy-makers in recent leadership debates (if wrongly), and it’s another I’m really looking forward to reading.

The rest of the list is equally as brilliant (Lesley Wood’s Direct Action, Deliberation, and Diffusion ; Elke Winter’s Us, Them, and Others ; Andrea Doucet’s Do Men Mother? ; Kay Anderson’s Vancouver’s Chinatown – which I cite in my own book! – and many more besides! See the list to fill out your own bedside table).

DeathLifeHouseCover

Now I’ll go back to pettier concerns, like listening to myself repeat the phrase “my award-winning book” over and over again, and envisioning how it will look the next time I revise my CV and find myself with something lovely to plant in the vast, otherwise empty landscape of its “Awards” section.


Good Age-Specific Net Migration Estimates Come in Threes!

Recently I posted on how we’re still not seeing any big age-specific losses in net migration figures in Metro Vancouver following the release of 2016 Census data. To summarize, there is STILL no flight of the millennials, BUT maybe there’s a slow leak of the Baby Boomers, which might be seen as evidence of “cashing out” of the local real estate market.

Today I wanted to provide both some metropolitan comparisons to note how Vancouver’s patterns fit with a couple of similar places, and also some municipal comparisons within the Metro Vancouver area. I also wanted to make some technical adjustments in how I modeled mortality* as I aged people through the past five years to estimate net migration, which really matters for older adults (not so much for the young). Again, I’m using 2011 and 2016 age distributions drawn from census profiles to get at age-specific net migration estimates for each of the metro areas and municipalities below.

First let’s compare Vancouver as a metropolitan area to two other metro areas: Edmonton and Toronto. I like this comparison primarily because Vancouver is nestled nicely between these two areas in terms of size, and they’re all big university towns.

ThreeMetroNetMig-2016

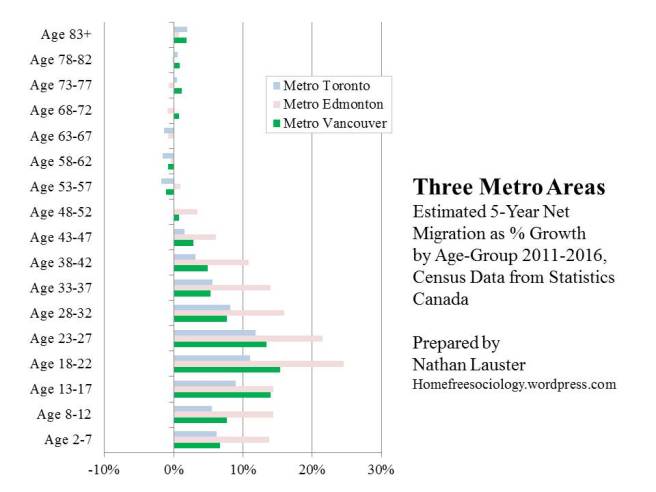
For Vancouver, you may notice that the figure looks very similar to what I posted two days ago, up until you get to folks in the 70s and above. That’s where mortality effects really start to matter! I think the above is a better approximation of those effects, but it’s tricky to get them right.

Comparing Vancouver to Toronto and Edmonton, what stands out most for me is just how similar these three metropolitan areas look! Metro Edmonton has grown faster over the last five years in % growth terms, but age-wise, the basic pattern of growth is the same as in Metro Vancouver or Metro Toronto. Young people (including Millennials) pour into all three of these areas, and then mostly stick around.

I noted in Vancouver there was new evidence (at least new to me) of a slow leak of Baby Boomers over the last five years. It appears this leak is also showing up in Metro Toronto, with a very similar pattern. It appears there are fewer folks in their late fifties and sixties than might be expected, suggesting they’re leaving town (cashing out?). Then people in their seventies and above start returning (probably for the good health care & related facilities).

There is also a later-life leak of Metro Edmontonians, but it starts later and never quite stops until the latest age. This could reflect more of a straightforward retirement and return home effect for the many folks drawn to the region, but it’s hard to say. At any rate, all later life migration patterns are dwarfed by the influx of younger adults (and their children) into these growing regions. I don’t see a lot of cause for concern about any particular age-groups shying away from our rapidly growing metro areas.

What about within Vancouver’s metro area? I’m somewhat ambivalent about emphasizing municipal differences in age-specific net migration patterns insofar as metropolitan areas tend to be tightly integrated. When a group disproportionately moves over the border from one municipality to another, it doesn’t have a big impact on the vitality of the region as a whole. Nevertheless, it’s worth tracking, and it certainly can have big implications for quite local livability, diversity, development, and transportation questions.

Here I’m just going to compare Vancouver and Surrey, the Lower Mainland’s biggest two municipalities, with Maple Ridge, a smaller suburb further out.

ThreeMunisNetMig-2016

Here you really get a sense of how tightly connected central cities and their suburbs can be. As the region’s central city (and biggest university town), Vancouver receives an ENORMOUS influx of young people. Then, as they move into their thirties (and often start having children of their own), they tend to move out again, slowly leaking out of the City thereafter. Nevertheless, so many young adults move to the City of Vancouver that they overwhelm the later leavers. In net terms, the majority of young adult arrivals stick around in the City of Vancouver all through their later lives.

But back to the leavers – where do they go when they leave? Mostly to the suburbs. Maple Ridge is the City of Vancouver’s mirror image in this regard. People in their thirties and beyond account for most of this suburban municipality’s growth. By contrast, young adults, especially of university age, but extending into the twenties, flee Maple Ridge. Where are they going? (see above).

What about Surrey? It’s still a suburb, but also increasingly a centre of action in its own right within a multi-polar metropolis. At the moment it’s hit a sort of demographic sweet spot where it’s gaining people at all ages. Nevertheless, it’s worth noting that while young adults aren’t exactly fleeing Surrey, their contribution to its growth isn’t as strong as for older adults or their children, and it remains nowhere near as strong as what we see in the City of Vancouver.

On the whole, these net migration patterns are not too surprising for a relatively large metropolitan area. Young people tend to leave home and move toward the vibrant city centre. Later they tend to move back to the suburbs as they settle down and start families of their own. If anything, what’s striking here is just how many young people remain in the City of Vancouver as they age, living on their own or in diverse families across a wide array of the different housing options the City is working to provide – if still, typically, at too great an expense!


*- my mortality modeling from my earlier post was really crude – simply applying five years of the expected death rate to the starting (2011) population. Bad demographer, bad! Now I’m using BC Deaths data to apply a survival rate and age the population from 2011 year by year, for each of the past five years, allowing one-fifth of the population in any given age group to age to move to the next mortality risk with each year and then applying the survival rates to the surviving population in sequence. This still doesn’t account for the mortality of recent migrants (in other words, recent arrivals could die and never be counted by the census, and I don’t take into account their mortality in any separate fashion – if I did it would boost the net migration estimates, especially for older adults). I’m also twiddling a bit with my estimates for 0-4 year olds and 85+ year olds, as needed by modeling (infant mortality is much higher than any year afterward until quite late in life, and after 85 I’m dividing the population into about half experiencing 85-89 vs. 90+ mortality). But I think I’ve got most of the technical details now closer to realistic for estimation purposes. As noted previously, none of this really matters much for younger population groups.


Update: The Lifeblood of Vancouver still isn’t leaving!

New Census results out today from the 2016 Census! They include dwelling type, age, and sex figures. The former is of great interest to me, but I’m going to concentrate on the latter just to update my older posts on migration patterns for Metro Vancouver.

Behold, the lifeblood of Vancouver still isn’t leaving!

NetMigration-2016update

I followed the same basic procedure here as I described in previous posts, comparing 5-year age groups across 5-year census periods. For example, given how many 20-24 year olds we had in Vancouver in 2011, how many 25-29 year olds would be expect to be here in 2016? Without any net migration, we’d expect roughly the same number, subtracting a few who died. So if we compare population figures, and make minor adjustments for mortality (I used 2013 figures, drop me a line for details [UPDATE: I think I’ve made better technical assumptions about late life mortality effects in this later post, reducing net migration estimates from age 70+]), then we can estimate net migration by how many more (or less) people show up in 2016 than we’d expect. I use the intervening age intervals (e.g. 23-27 year olds) as labels to demonstrate where most of the in-out movement is taking place between census years, which I find really captures, for instance, those university years (18-22) well.

The big takeaway, given the frequent concerns expressed over millennials leaving Vancouver,* is that it’s STILL NOT HAPPENING! Young people continue to pour into the region (University town, vibrant urban scene, etc.), and they tend to stay well into their forties.

What does appear to be new this year, at least according to my calculations (which are heavily dependent upon mortality assumptions as the population gets older), is that we’re starting to see a net loss of our late-career / early retirees. These are folks in their fifties and sixties. Yes, yes, the slow leak of our Baby Boomers is upon us! Apocalypse Now! (to be fair, it is their movie…) It’s quite possible these are predominantly people cashing out on their investments in the local real estate market and leaving for elsewhere. But if so, that’s about the only age-specific migration trend I’m seeing that seems driven by Vancouver’s widely unaffordable real estate.

*- I’ve still not seen any calculations or corrections on this issue from Bloomberg. Show your work! Tell us where your bad data is coming from! It’s ok to get stuff wrong, but not ok to keep false stories running!