
Co-authored with Jens von Bergmann and cross-posted at MountainMath
TL;DR
We now have three years of Speculation and Vacancy Tax data for BC, demonstrating generally less than one percent of properties pay the tax in most municipalities. We play around with the data we scraped from files released by the BC government to show
- how the federal CHSP program systematically overstates “foreign ownership”
- how source of revenue estimates shift depending upon definitions and tax rates
- how properties are moving into rentals and
- what else we can glean from exemptions and revenue data.
Celebrating Three Years of Data
BC recently released round three of results from its Speculation and Vacancy Tax (SVT) to relatively little fanfare. Understandable, seeing as how we’ve been dealing with some stuff out here.
To recap: the Speculation and Vacancy Tax is an additional property tax mostly levied on a small proportion of properties deemed unjustifiably empty. In this, it’s like the City of Vancouver’s Empty Homes Tax (and is layered over top of that tax for the City). But the Speculation and Vacancy Tax works a little differently insofar as it sets different tax rates by property owner class, with the primary classes including BC Residents, Other Canadians, Foreign Owners, and Satellite Families. Satellite Families include married couples where the spouse making the most money works abroad and pays income tax in a different country.
We’ve explored earlier releases, and it’s worthwhile to dig in and take a look at this one as well, building up a longitudinal database of data over time. Of note, the data also keeps changing, though not (so far) in major ways. In general, each time a new round of the SVT data is released we see a revision resulting in a drop in taxpayers compared to the initial data release. This likely reflects people making late declarations or otherwise being exempted from the tax in a retroactive fashion. Importantly, we have not seen the retroactive rises in taxpayers that would indicate successful audits uncovering a great deal of tax fraud.
Speculation and Vacancy Tax Technical Reports are now available for 2018 ; 2019 ; and 2020, with supplementary data by municipality appended to the end of the 2018 report and separated out for 2019 and 2020, as per links by year. Staying true to BC government form regarding data openness and transparency of housing data, the government does not make this data easily available. Instead it requires scraping out of PDF reports, which we have done for the analysis below.
Validating Foreign Ownership
The first thing we’d like to update is our simple comparison of SVT data with CHSP data on Foreign and Non-Resident Owners for BC. Since it’s based upon auditable declarations, as we’ve noted before, the Speculation and Vacancy Tax offers a valuable check on the Canadian Housing Statistics Program’s (CHSP) estimates of Non-Resident Owners. Often erroneously cast as a measure of “foreign ownership,” the CHSP measure of Non-Resident Owners attempts to match owners on property titles in the provinces of BC, ON, NB, and NS with income tax and related records in Canada. Where it fails to find a good match, it labels the owner Non-Resident. This creates two big possible source of error in the CHSP data as a measure of “foreign ownership.” First, it’s a residual measure, and it’s possible the failure to find a match reflects things as benign as administrative errors in inputting a name correctly rather than an owner’s residence outside of Canada. Second, many owners outside of Canada may still be Canadian citizens and Permanent Residents, and hence not “foreign” despite living abroad. We noted before that comparing SVT to CHSP data, it appeared that somewhere less than half of CHSP’s “Non-Resident Owners” show up as “Foreign Owners” within the SVT data. Using the most recent data from CHSP and SVT, we can see the pattern continues to hold below.
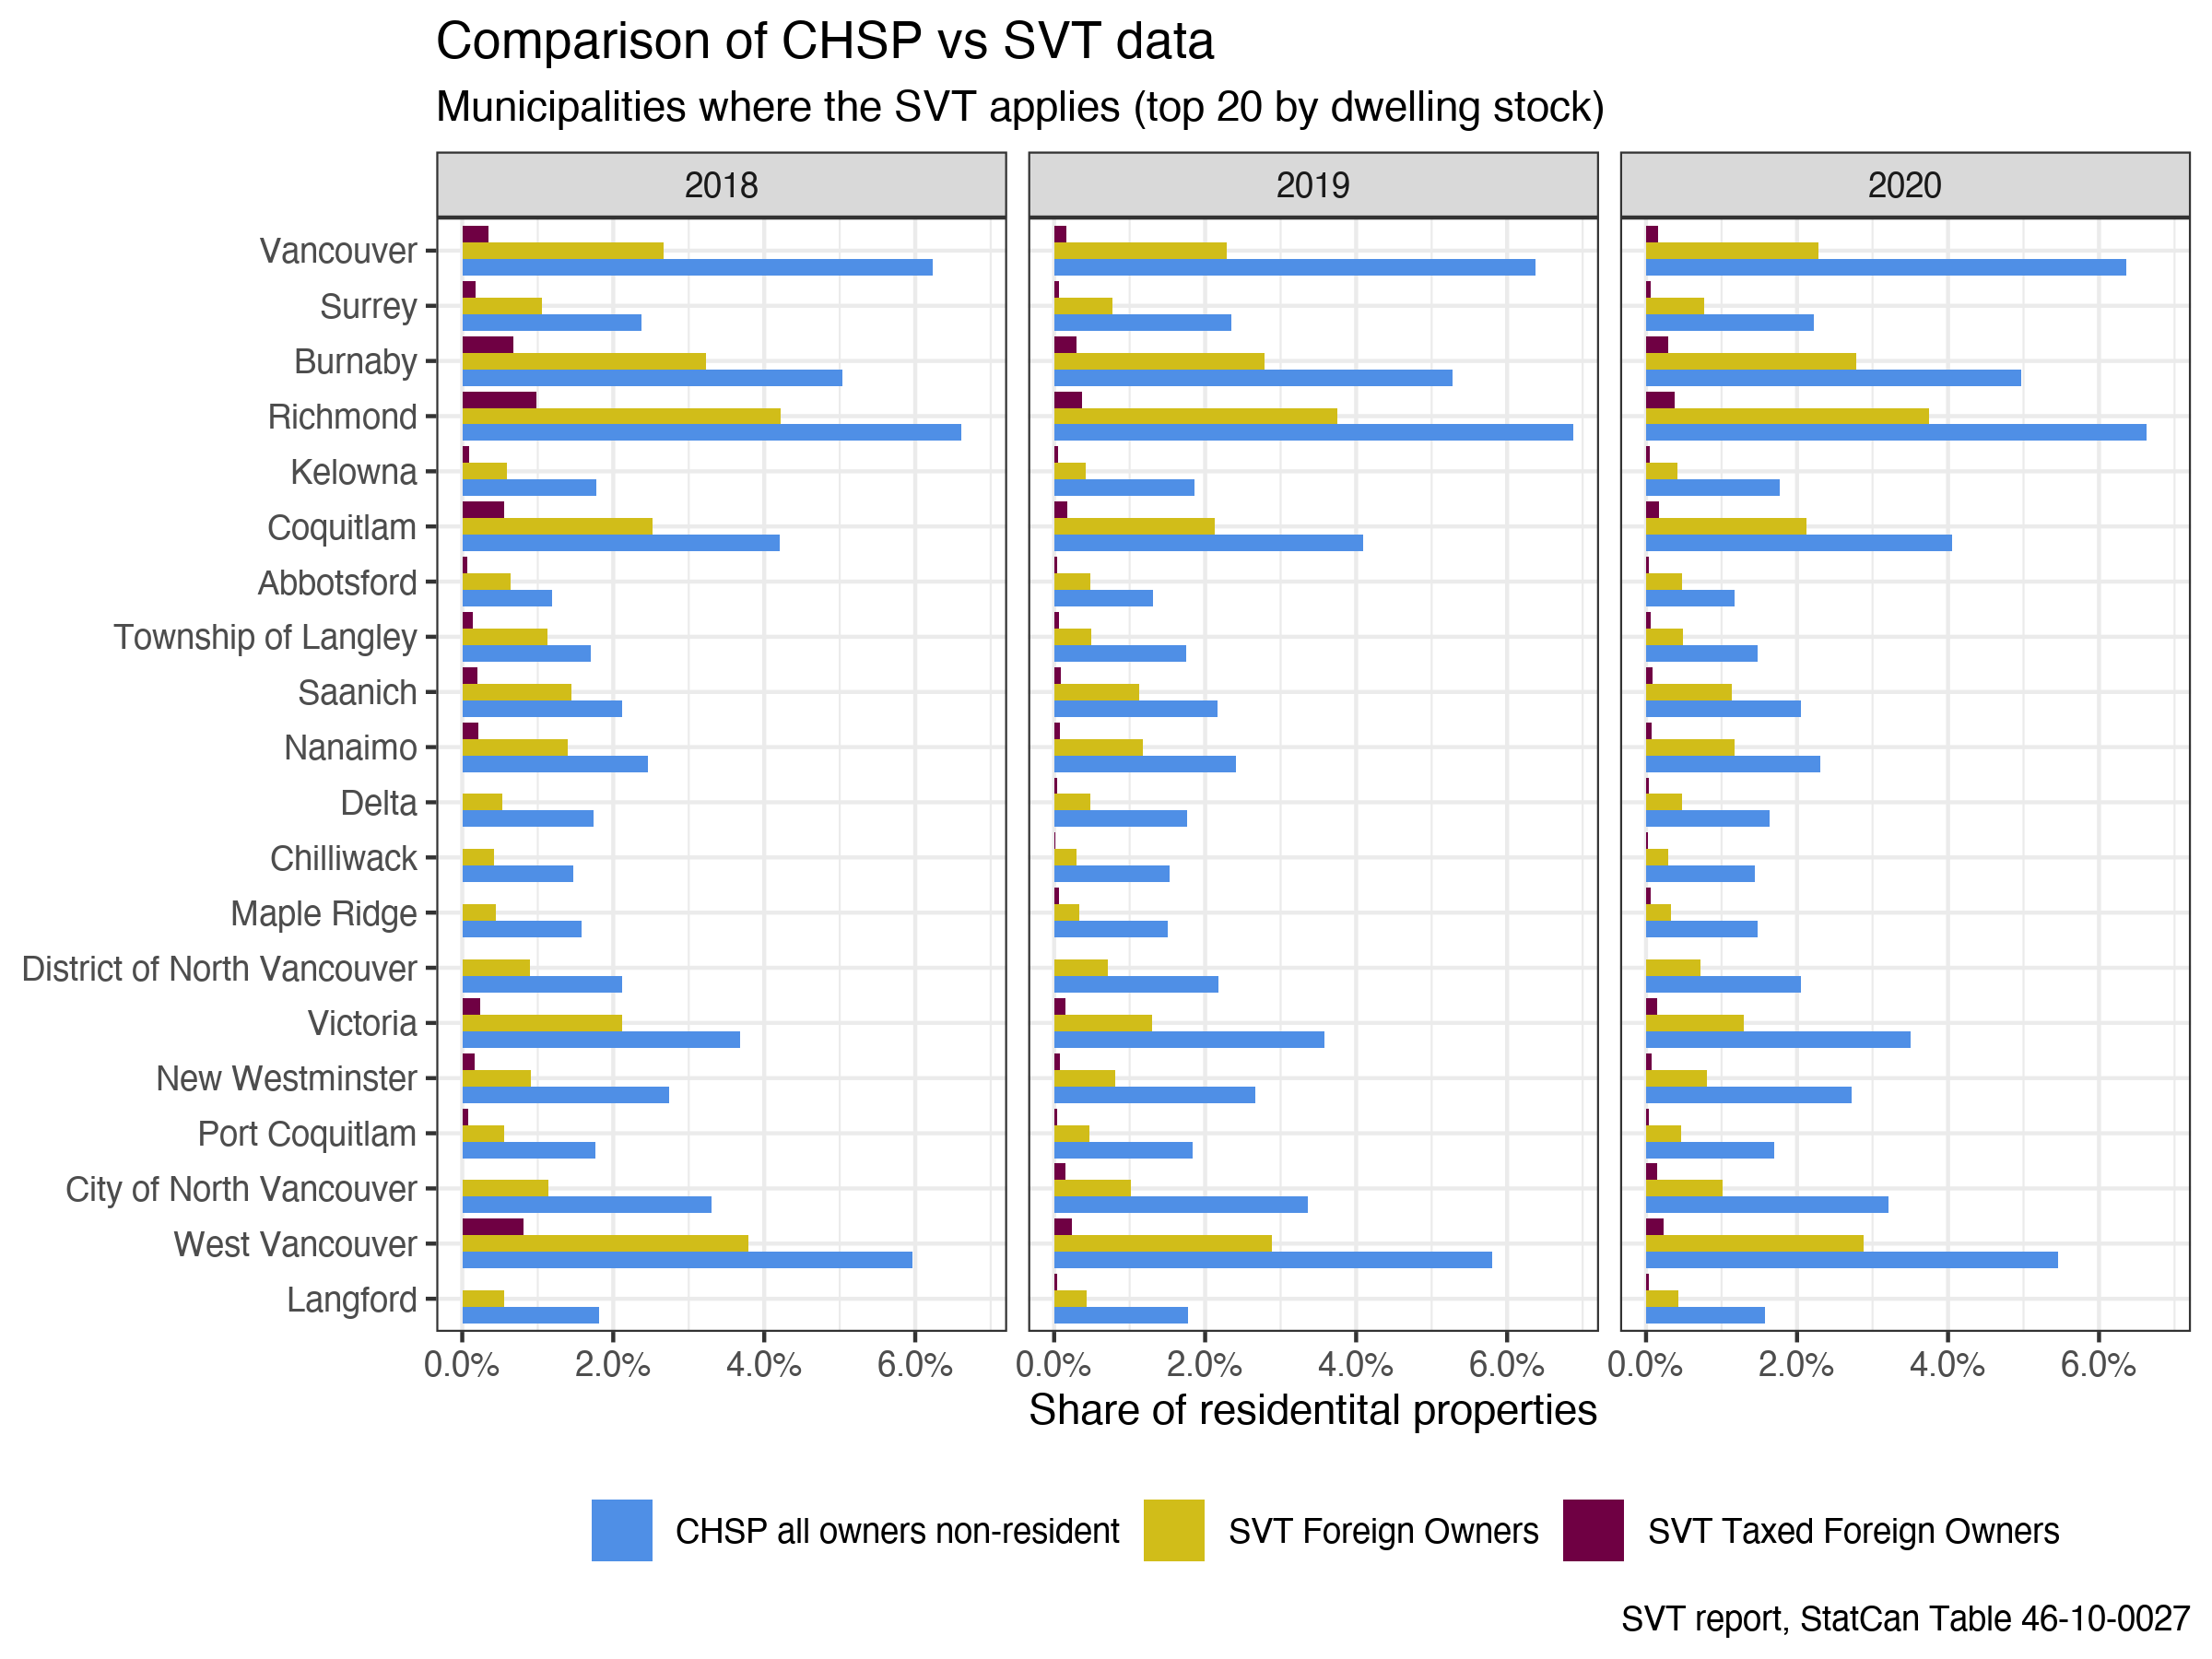
We can see that as a proxy for “foreign owners,” CHSP vastly and systematically overestimates the size of foreign ownership relative to SVT’s auditable declarations. We can also see that only a very small proportion of “Foreign Owned” properties are left vacant, and hence subject to taxation in BC from the SVT. Taxable “Foreign Owned” properties generally ran well below one percent of total properties in all municipalities in 2018, and have dropped even further to generally below half a percentage point by 2020.
Where Does Revenue Come From?
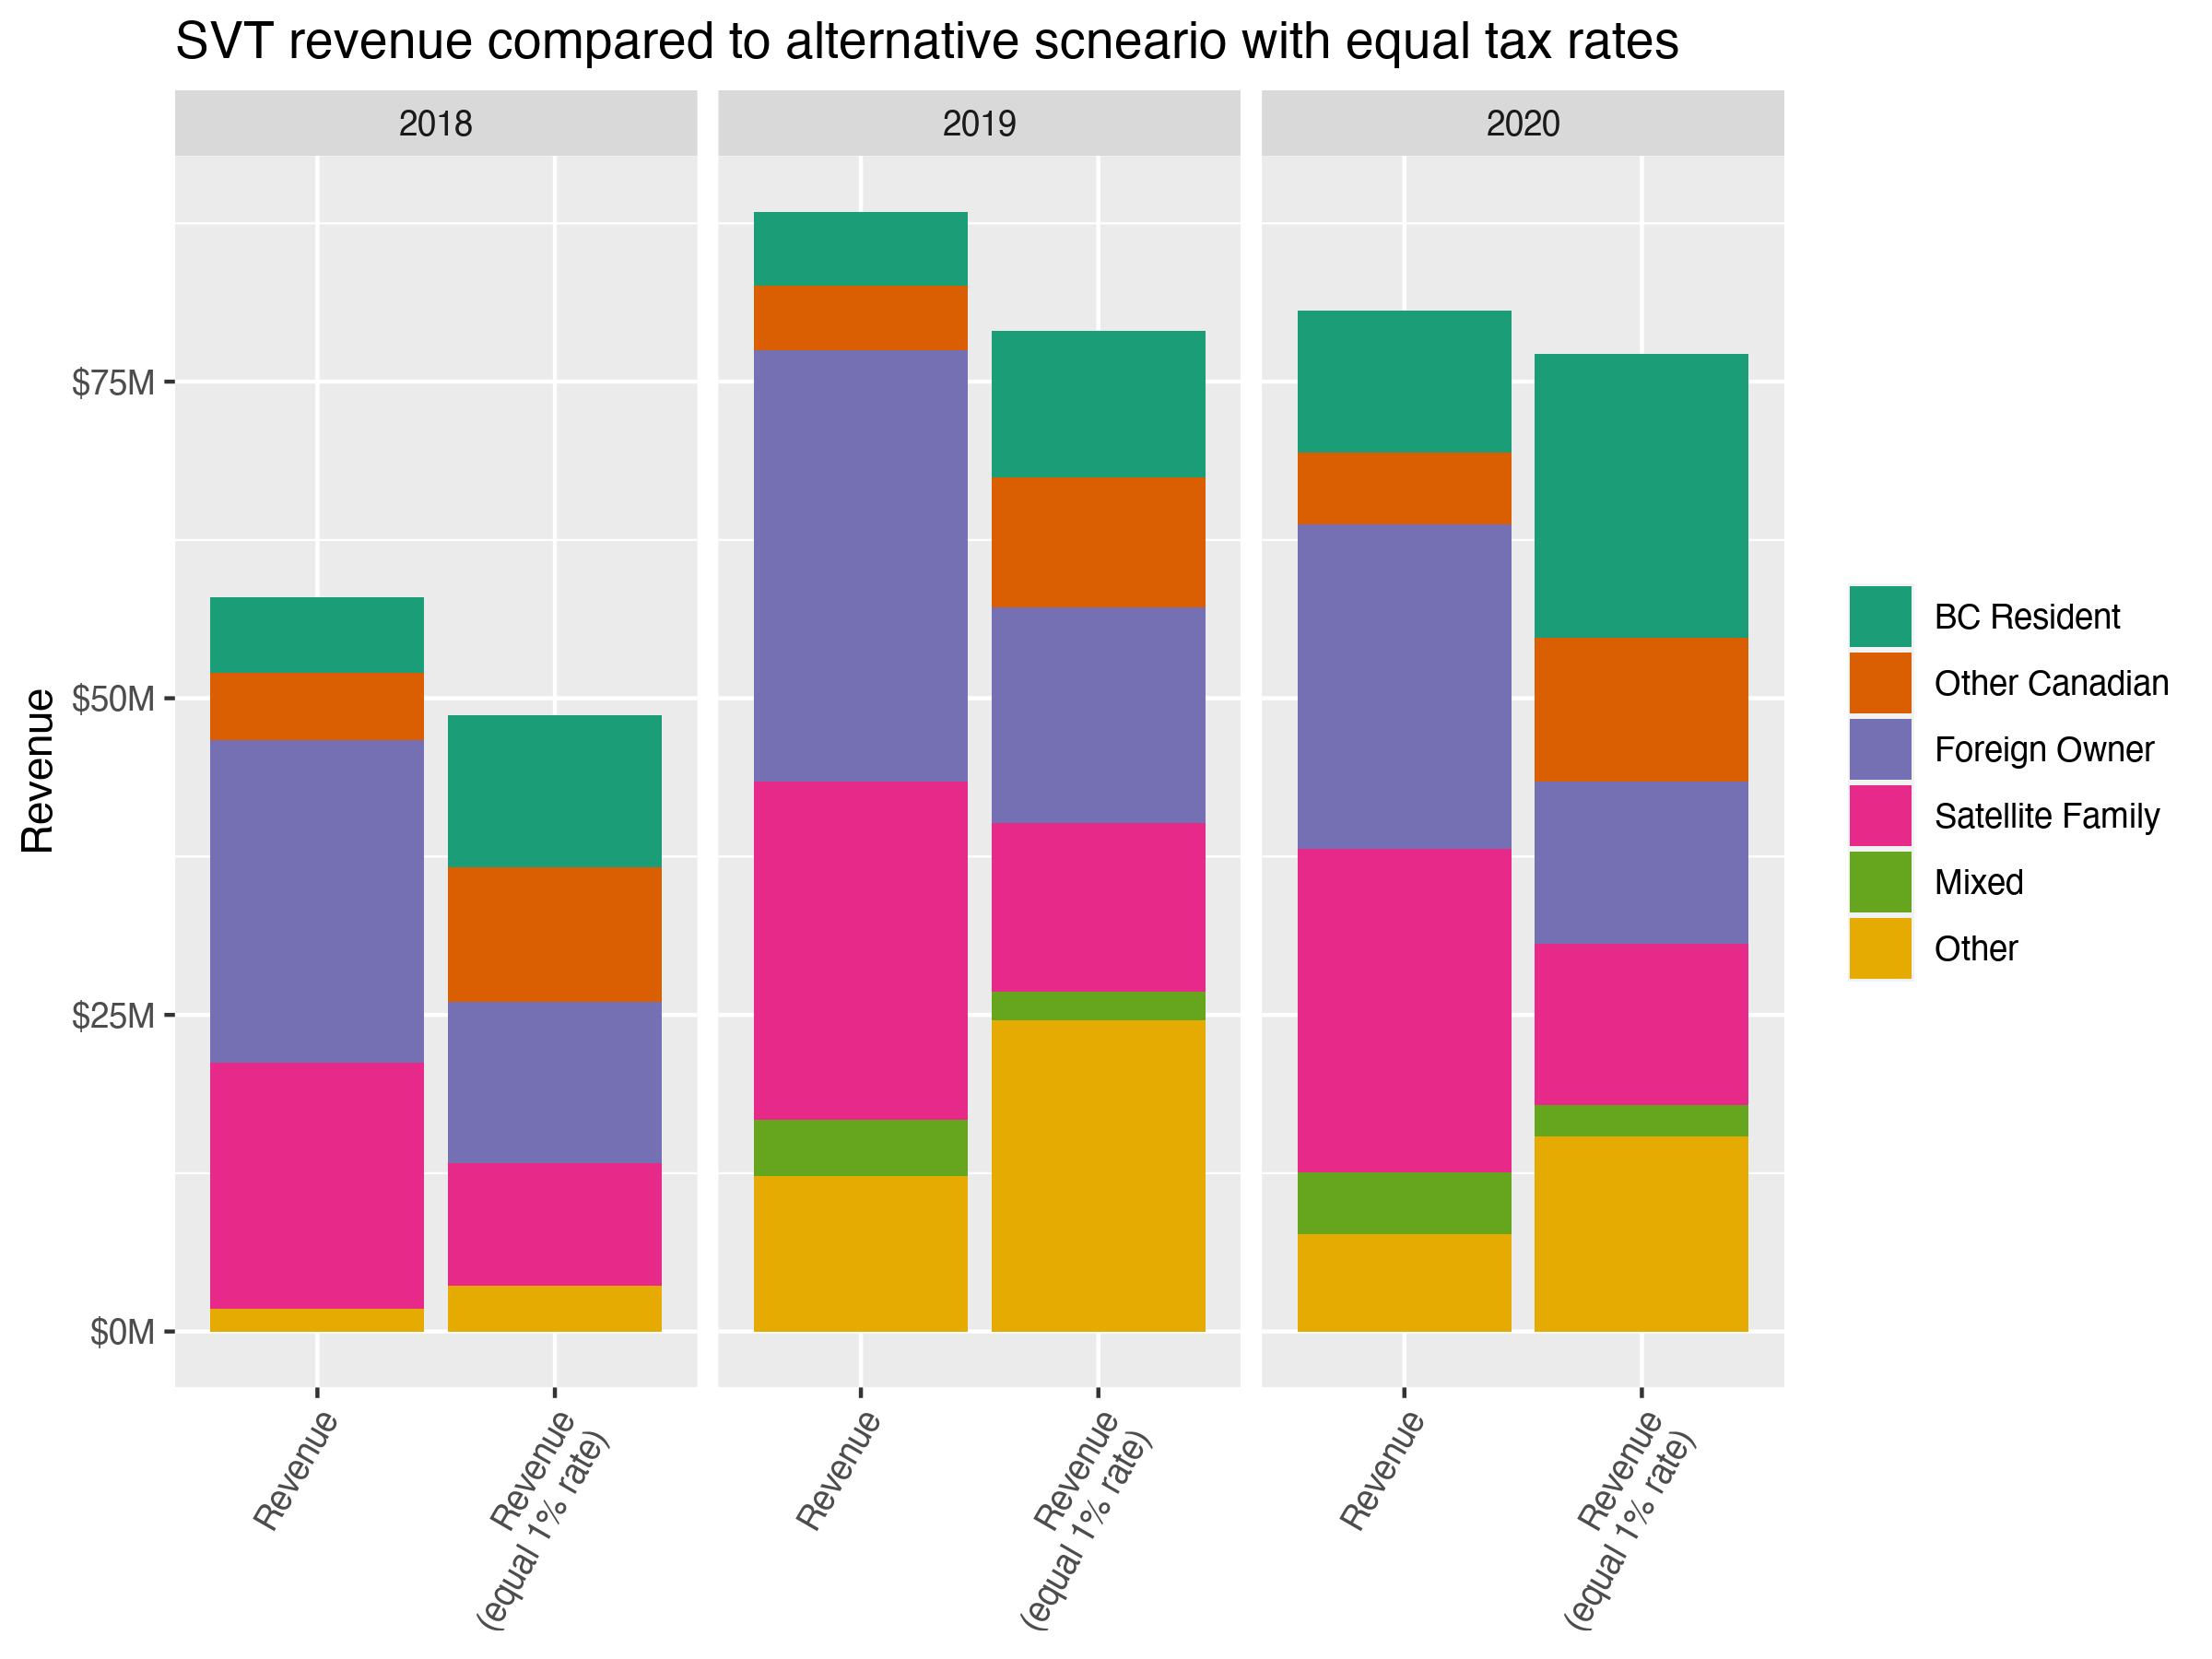
There’s lots of other data in the Speculation and Vacancy Tax technical reports! Let’s look at the revenue, which largely goes into BC Housing. BC’s reporting on the tax revenue has emphasized that relatively little of it comes from BC Residents. Instead the revenue comes mostly from those perceived as outsiders: Foreign Owners and Satellite Families. There are two problems with this way of presenting the data. First, and foremost, it alienates BC Residents who are deemed members of Satellite Families from being considered residents anymore. In our view, this is a serious problem. People should not be removed from consideration as BC Residents because of who they are married to. Period. Second, at this point, given the dramatic drop in foreign owners and satellite families and the rise in BC residents paying the tax, a decisive factor in BC’s revenue claims is that BC Residents pay such a low tax rate on properties left empty relative to other categories. Were tax revenues held constant at 1% for all categories, as per the simulation below, BC Residents would pay more tax than foreign owners, especially if Satellite Families were more correctly considered as Residents.
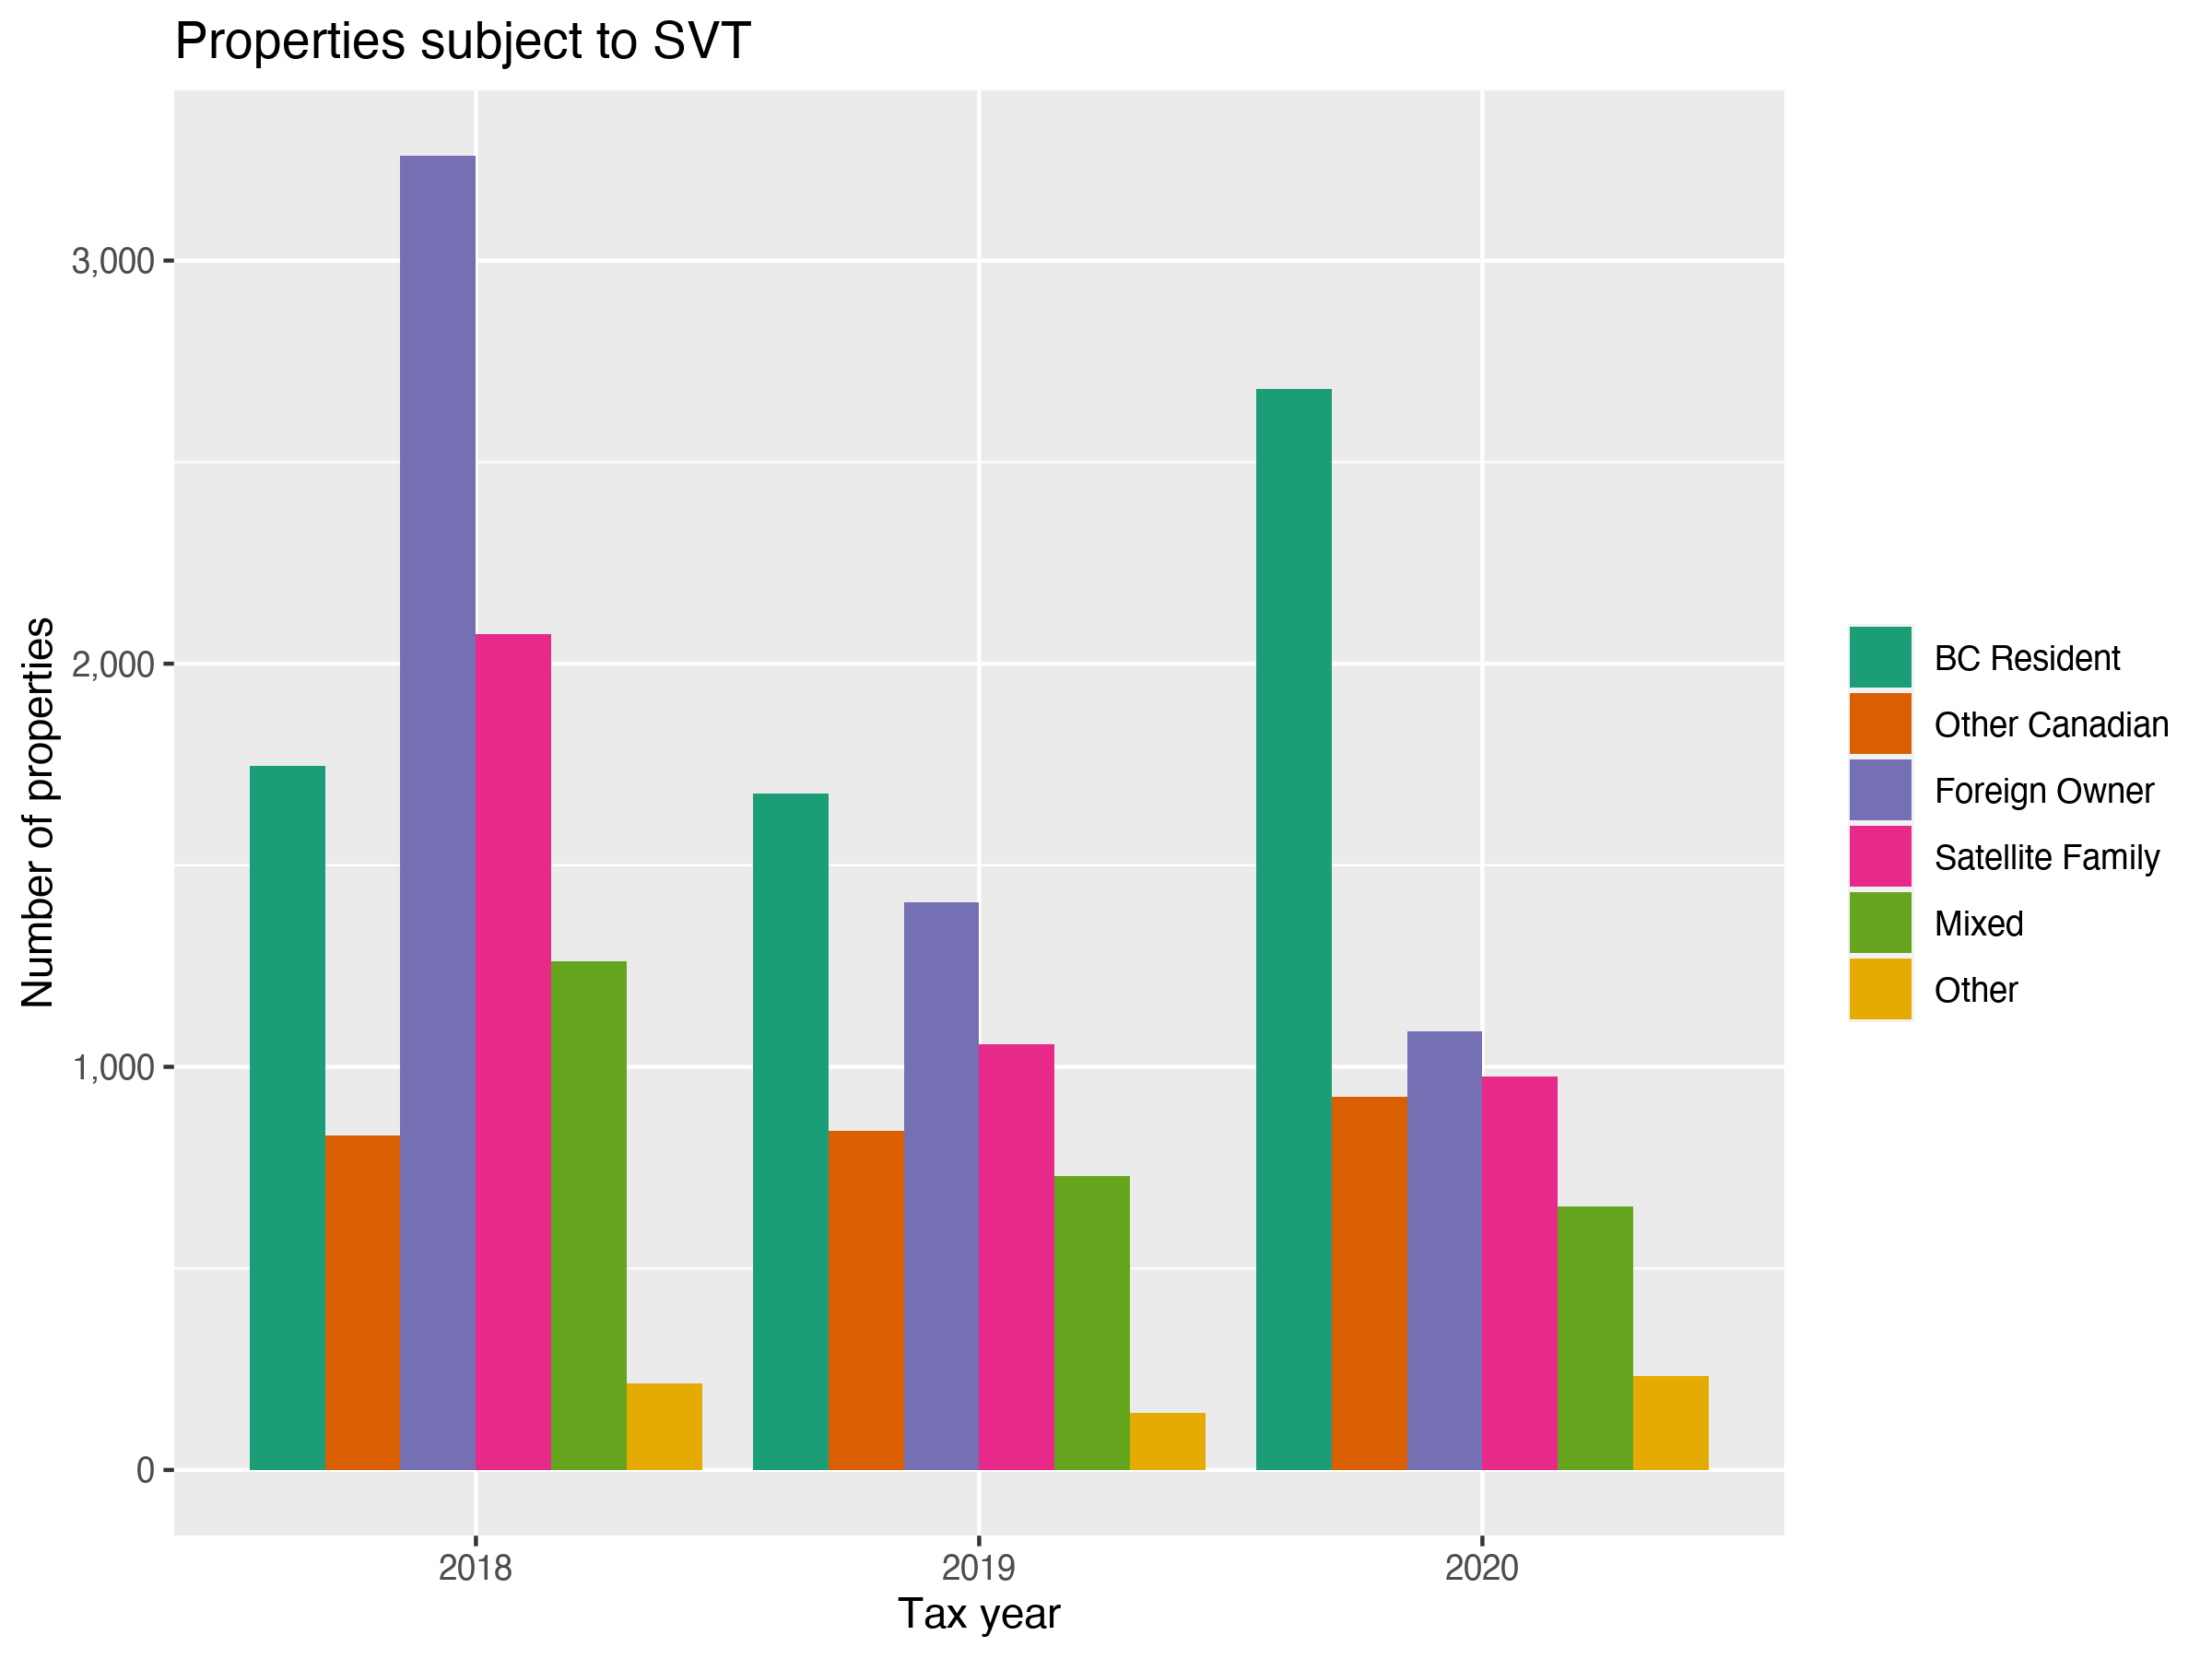
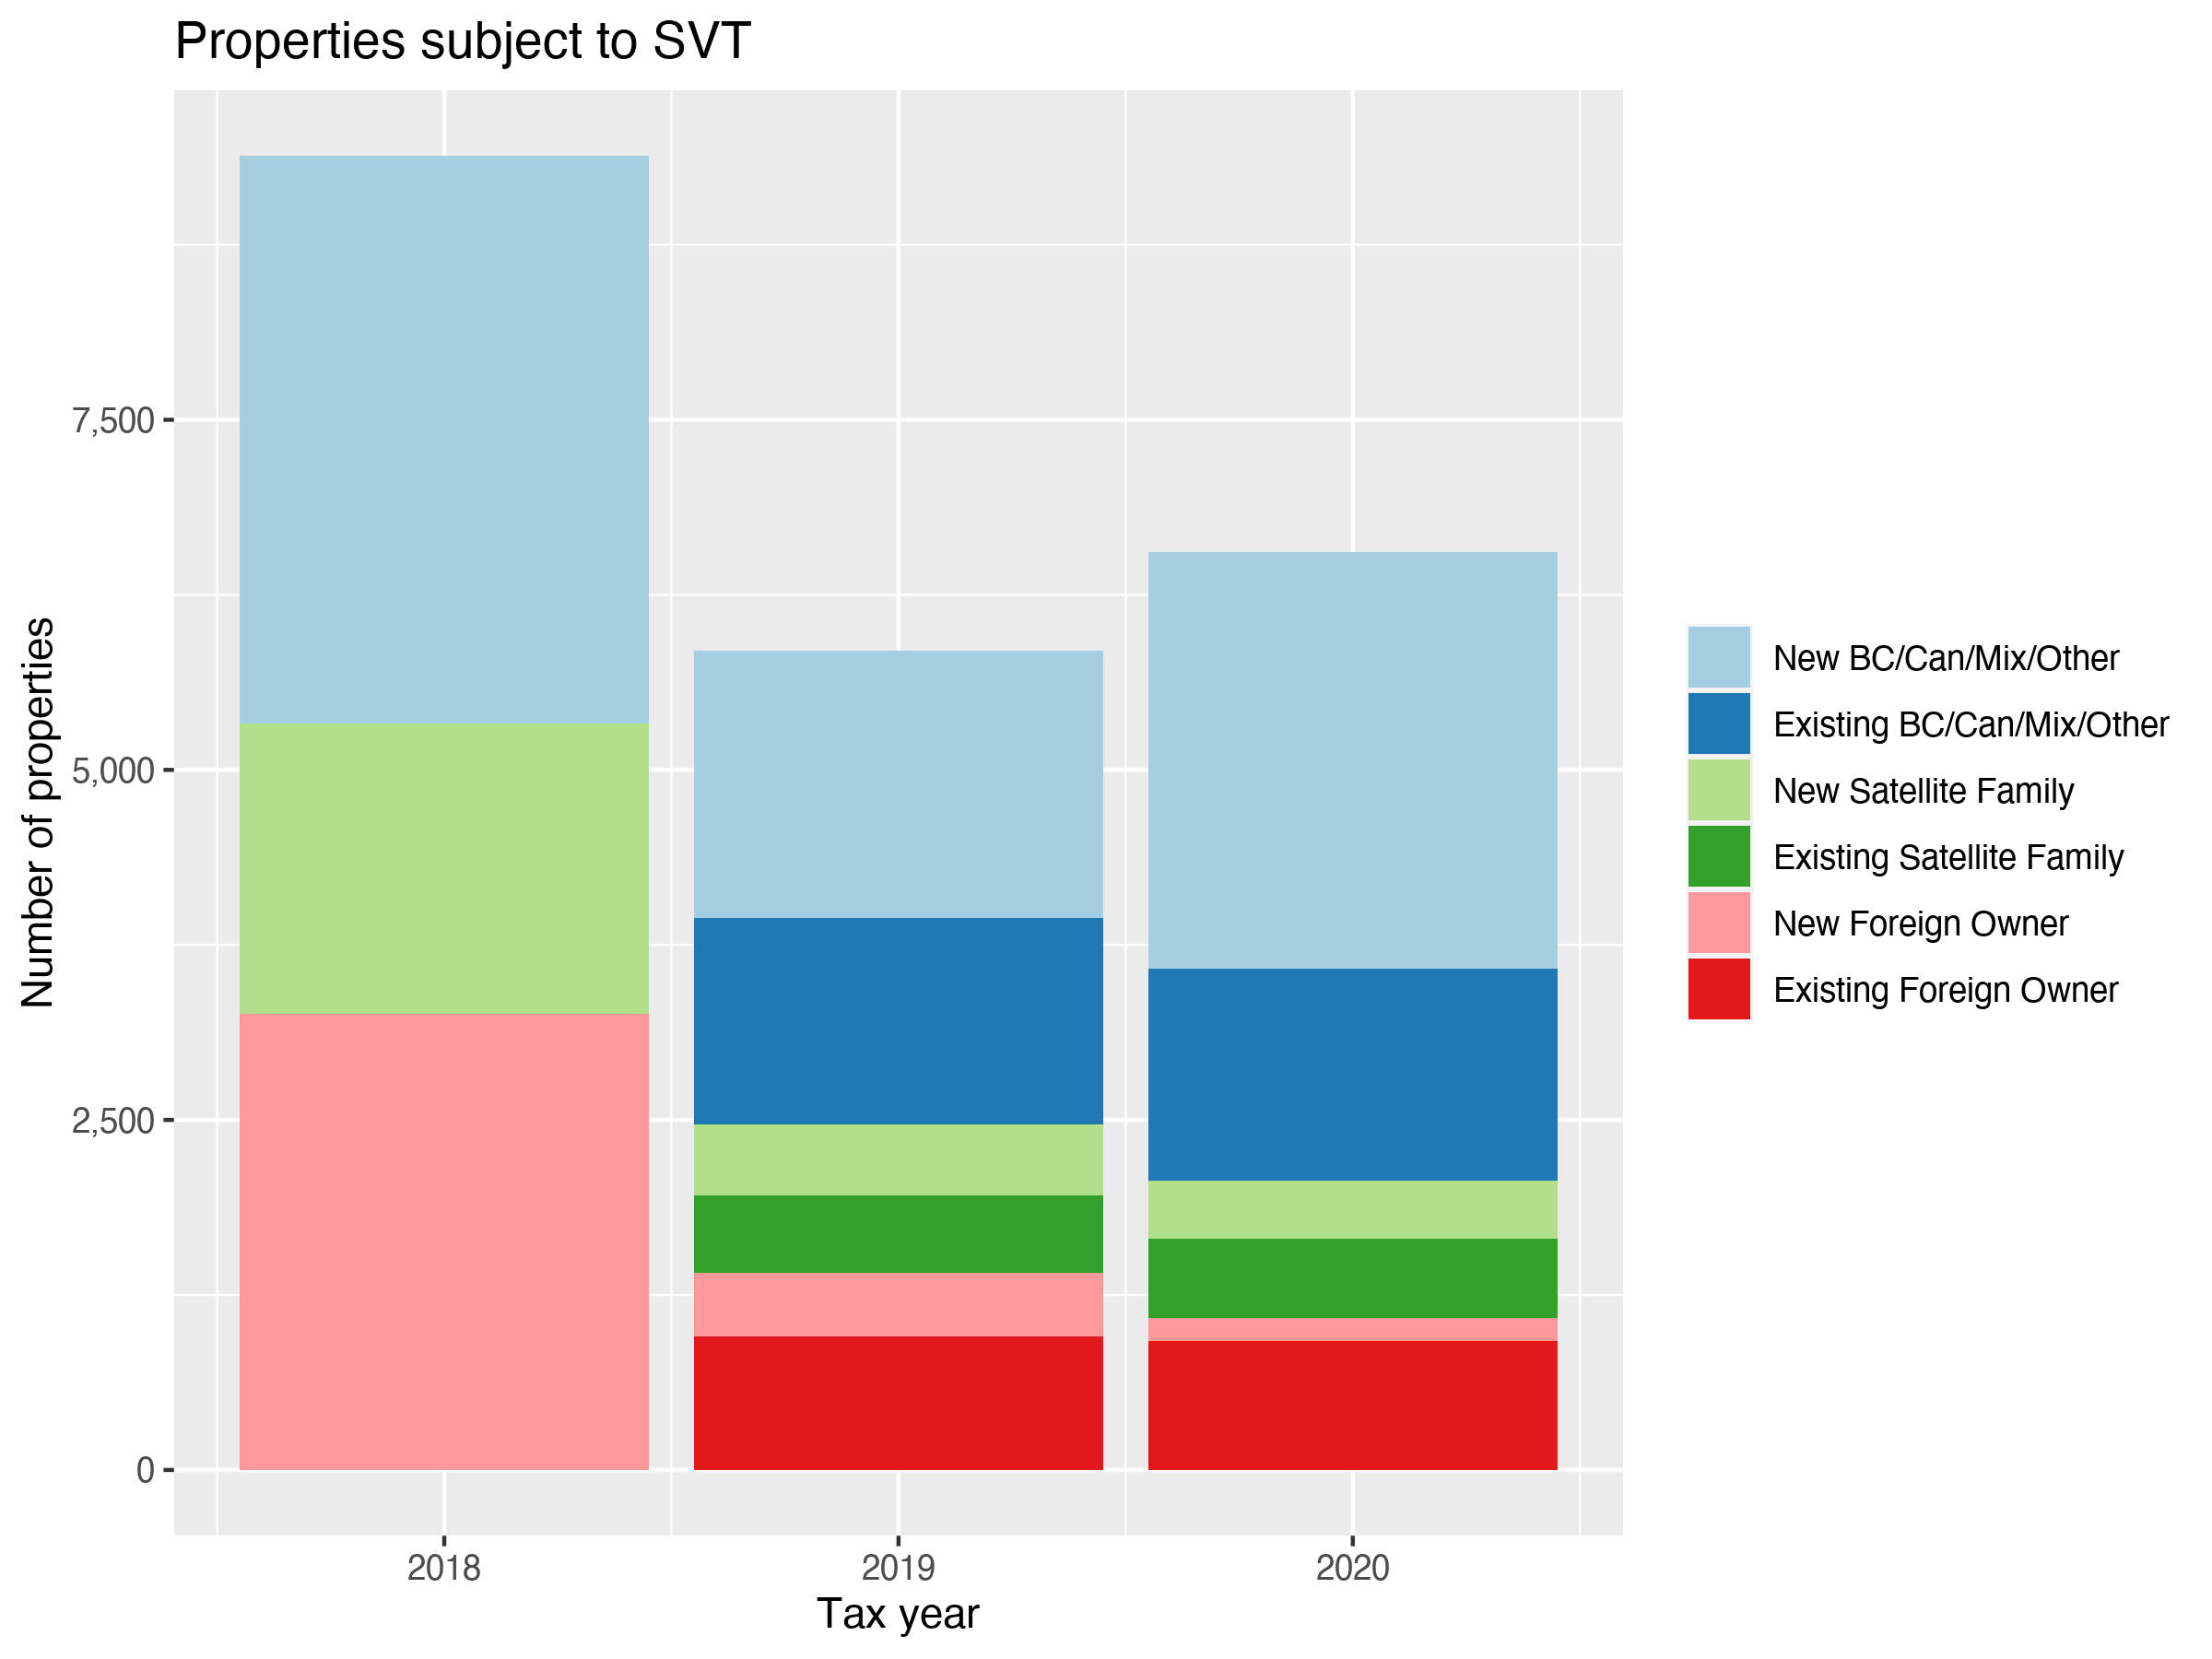
The shift away from Foreign Owners and Satellite Families (and “Mixed”), and toward BC residents can also be seen in the number of properties subject to the tax.
Note that we’re generally supportive of Empty Homes Taxes, and their targeting toward insuring housing is used for long-term residential purposes seems justifiable in tight markets like BC’s. But if we’re treating all those non-exempt from the tax as speculators, then an important question remains as to whether BC is justified favouring its domestic speculators over other sets of speculators. What message is that sending exactly, and why?
Change in Tenant Exemptions
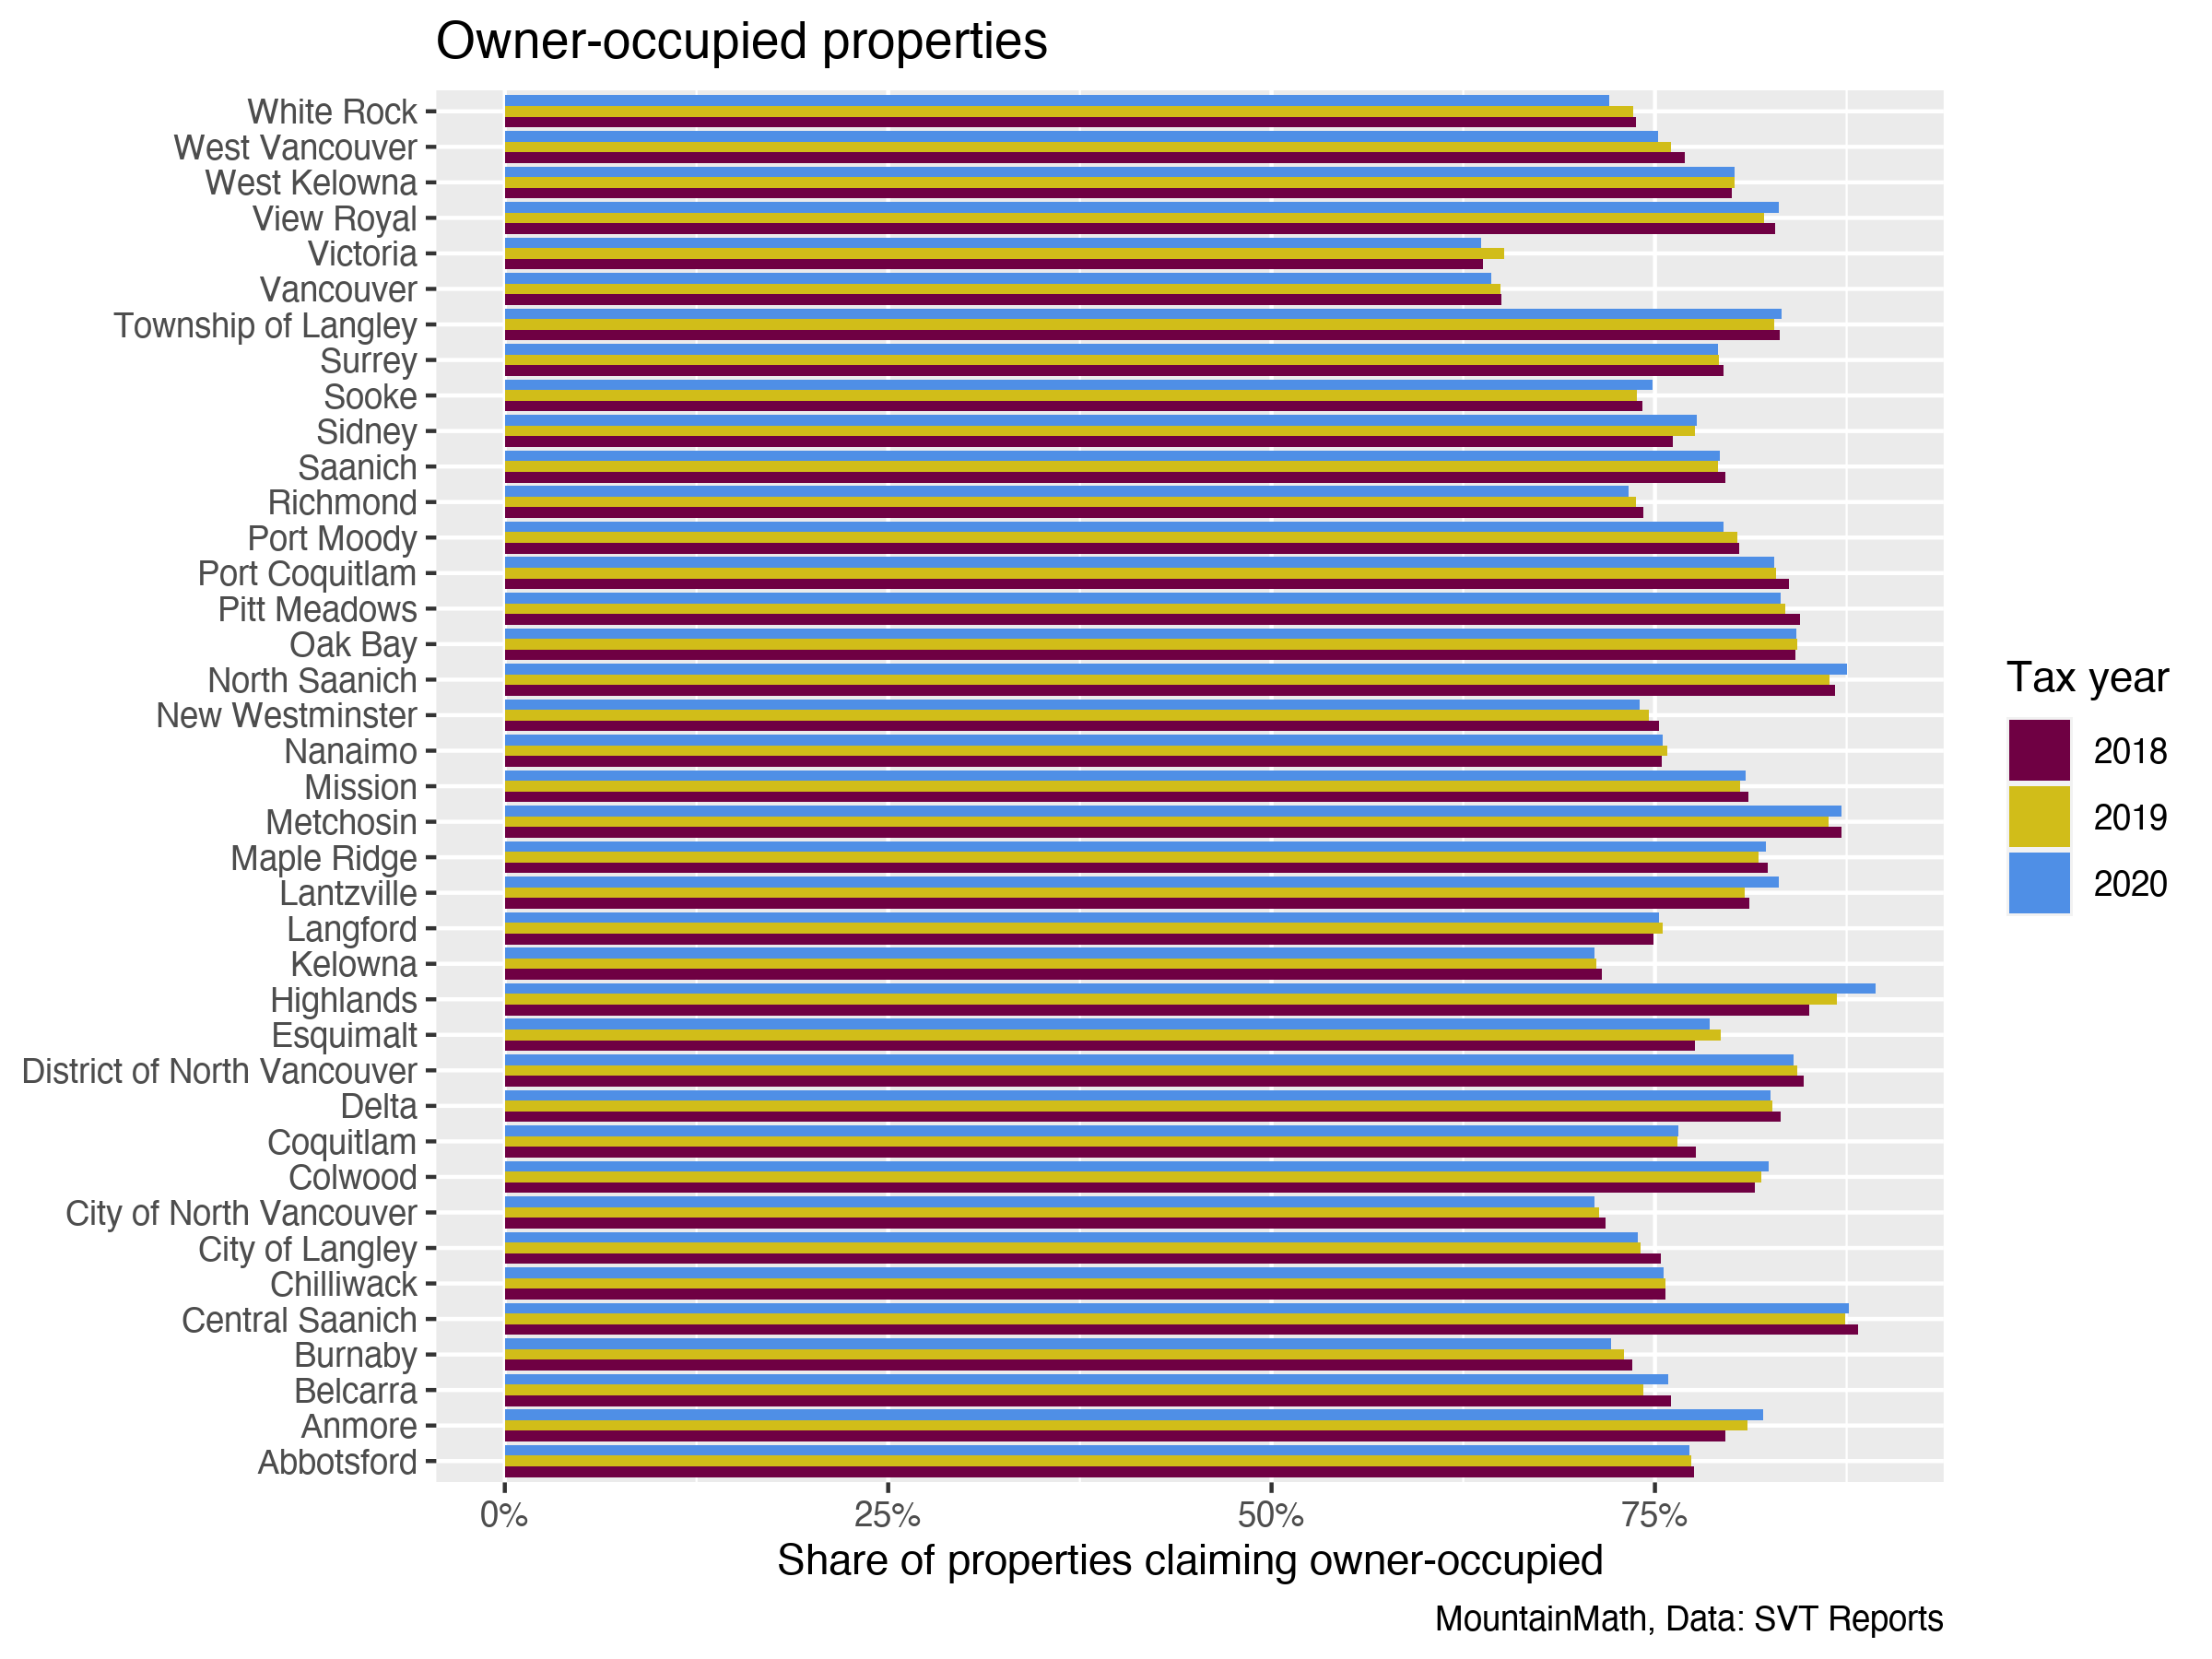
Another often touted aspect of the Speculation and Vacancy Tax is the return of housing to the rental market. As we’ve often noted, this is definitely a potential benefit of vacancy taxes! They add pressure to owners of empty dwellings to rent them out while not in use or between sales. As we’ve noted before, there are multiple ways to attempt to see the relationship between the SVT and rentals. The simplest is to simply look at changes over time in Tenancy Exemptions. Unfortunately, we’re missing the information about tenancy prior to the imposition of the SVT that would be most helpful in assessing its full effects. But we can see how increasing proportions of properties are being rented out over time, as demonstrated via tenancy exemption to the SVT, in larger cities including Vancouver, Burnaby, and Richmond. This fits especially well with what we know about condominiums, insofar as they’re a major source of secondary market rental stock across BC.
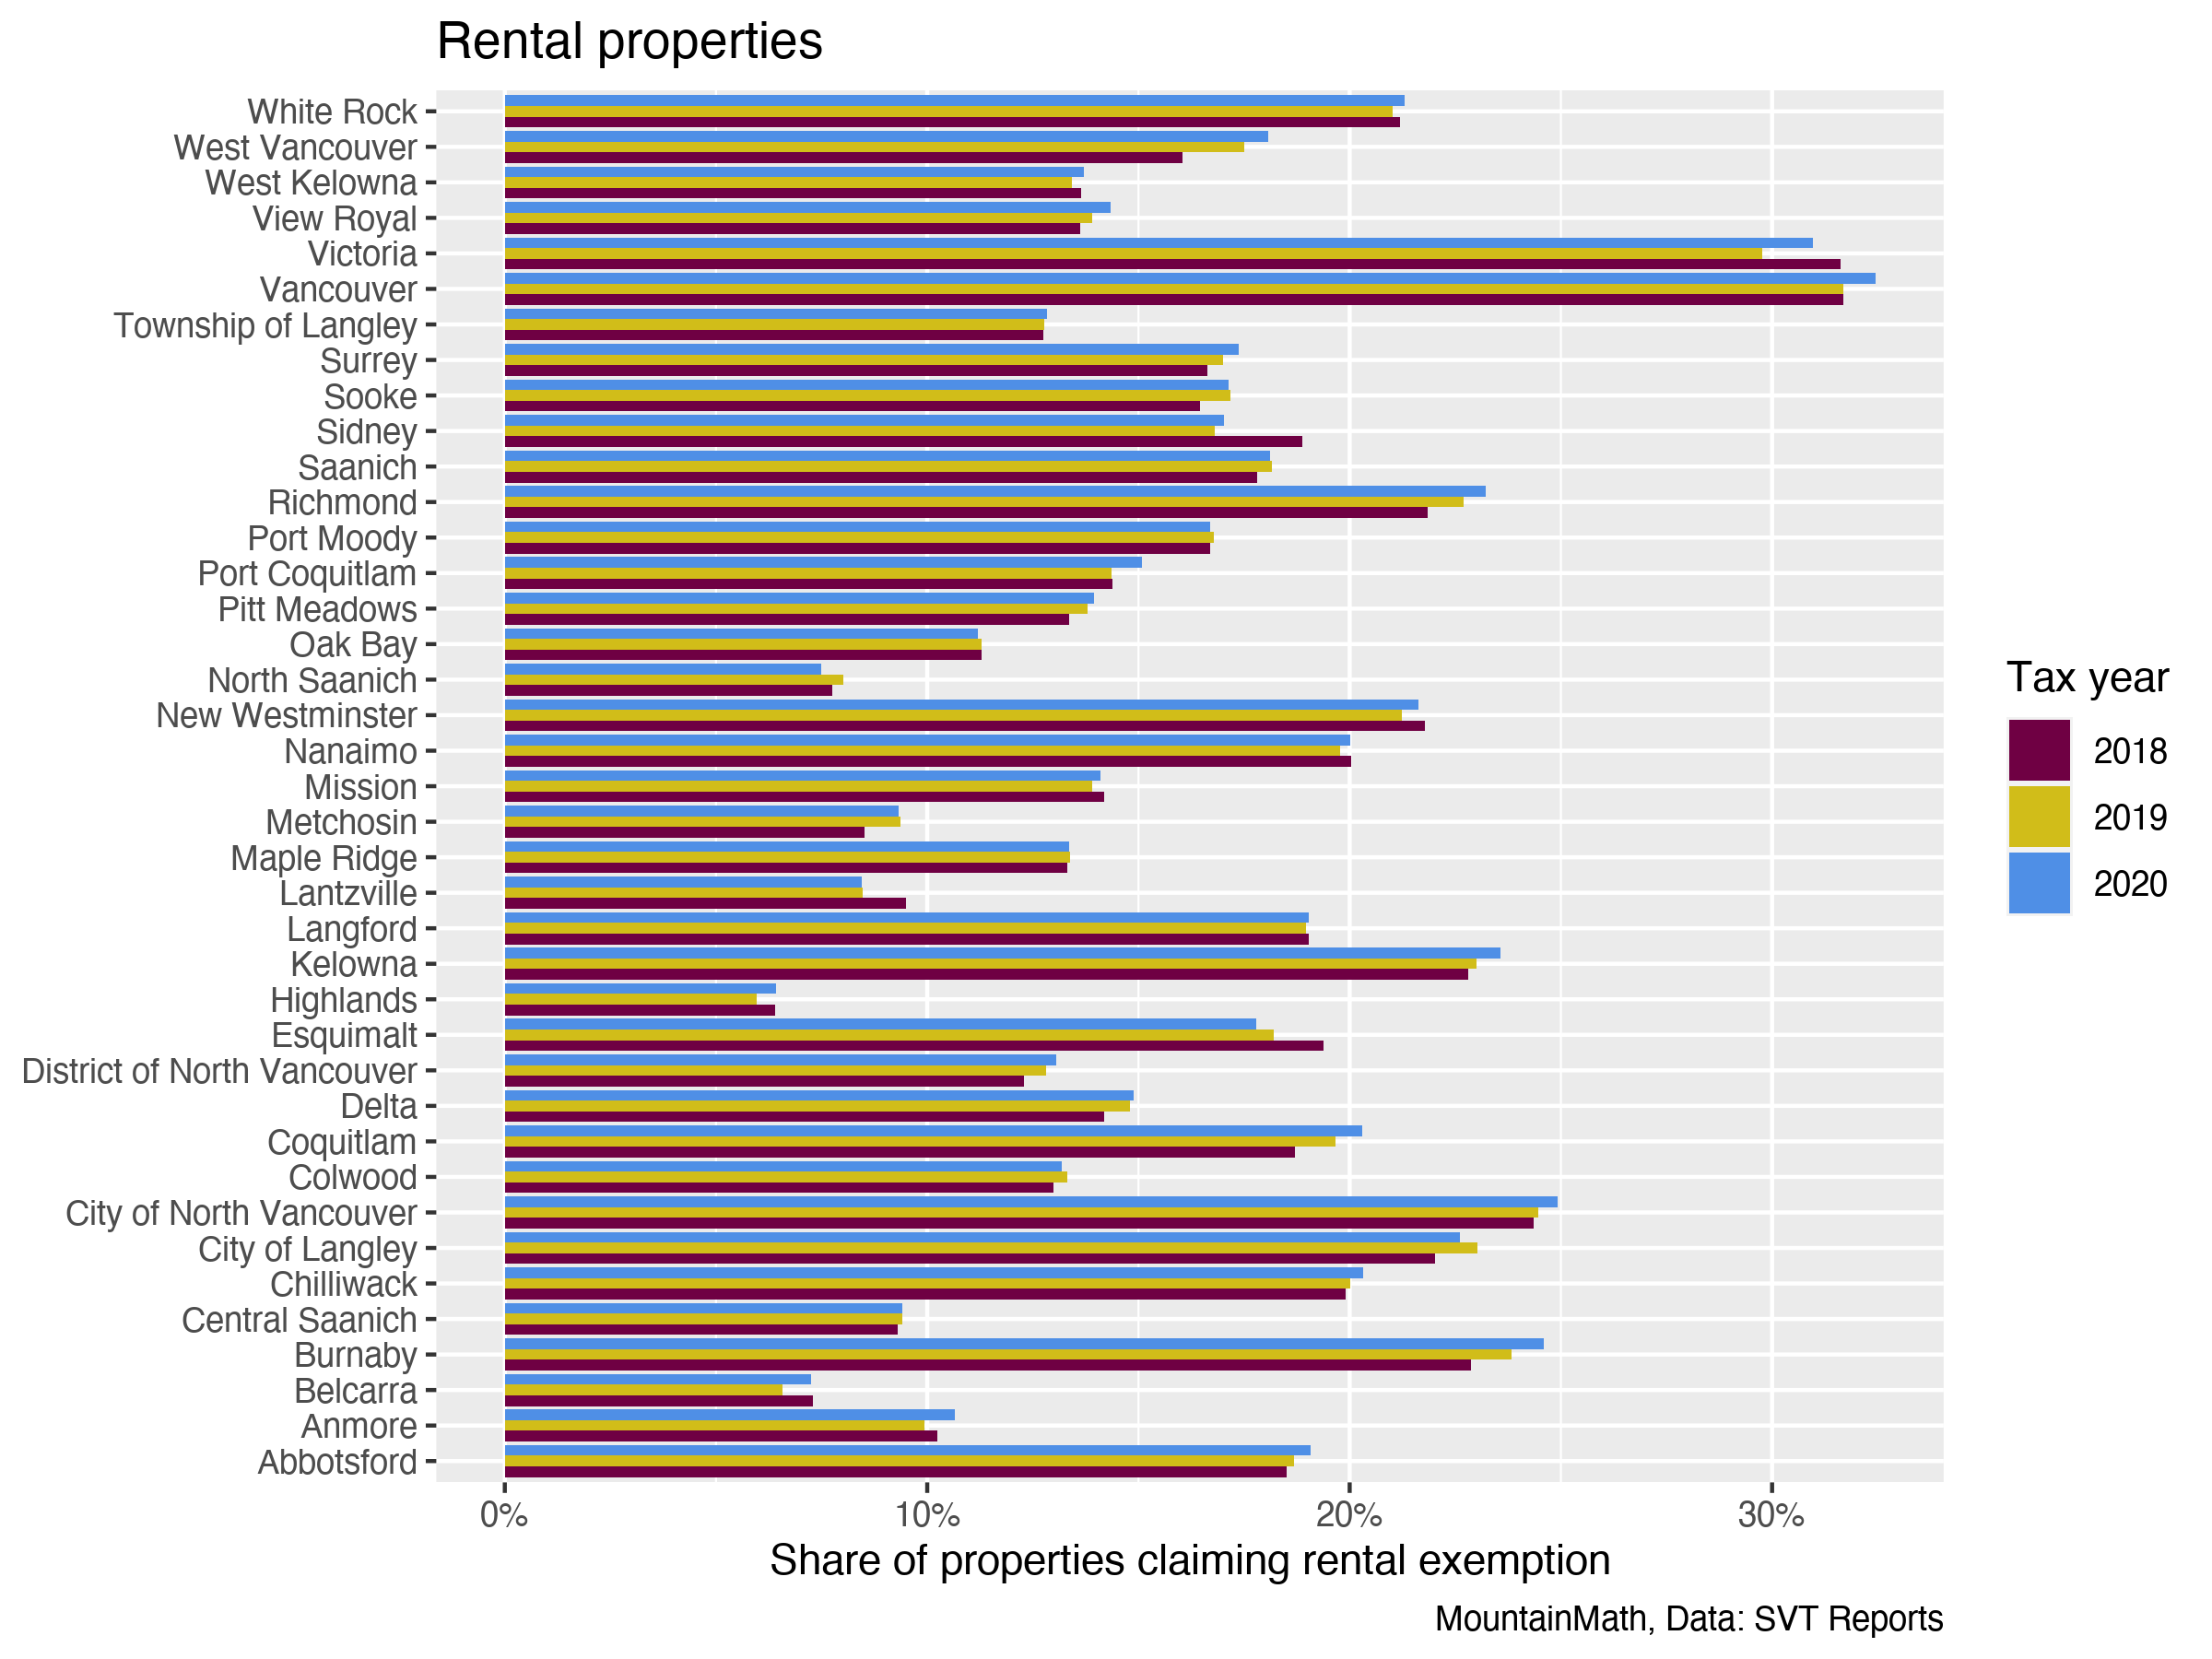
Importantly, the rise in exemptions for tenancy appears to reflect a broad shift toward renting of properties that might’ve happened regardless of SVT imposition. Supporting this interpretation, we see a matching downward trend in homes declared as owner-occupied, so this is likely more a shift from owner to tenant occupied homes than an effect of the SVT moving homes out of vacancy per se.
Flows
What about zooming in on change specific to homes taxed as vacant or otherwise non-exempt from taxation? Through the SVT technical reports released in 2019 and 2020, we can get a broad sense of change over time for taxed properties. In particular, how many properties taxed in 2018 and 2019 shifted to a different status, becoming exempt in 2019 and 2020, by category? This is tricky to do well, given the data provided. In particular, both the 2019 and the 2020 reports have cursed tables where the results, as provided via Technical Reports, are clearly wrong. In each case, the cursed table is Table 8, where totals should match Table 7 in 2019 and Table 9 in 2020. But they don’t. It looks to us like Tables 7 and 9 provide plausibly correct information, though. At the same time, those taxed also change between years. So we drop Table 7 and use the most recent results below, pulling together Table 9 from the 2020 report in conjunction with Tables 10 and 11 (in 2019) and 11 and 12 (in 2020) to provide a sense of change over time in taxed properties. Here we get a direct sense of how many properties taxed in 2018 shifted to a tenancy exemption in 2019. And we get it again between 2019 and 2020. It’s plausible that these properties might’ve shifted into the rental market without the SVT. But it’s also plausible that it helped lead them there.
Flows demonstrate other interesting changes over time. Perhaps surprisingly, only a minority of properties remain persistently subject to taxation between years. But new properties are added to SVT taxation at the same time as most properties from the previous year are removed. In short, there’s substantial fluctuation in tax incidence. This has compositional effects. In particular, it appears that Foreign Owned properties and Satellite Family properties have gradually diminished to a smaller, but relatively stable low level. Between 2018 and 2020, they seem to have been largely replaced by Other properties, mostly owned by residents of BC and other parts of Canada. For the most recent year, a cynical read might suggest that the SVT simply replaced higher-taxed Foreign owners of empty homes with lower-taxed Canadian owners of empty homes.
Worth noting that the 2020 results may end up overstating the final number of non-exempt properties, as has been the case for previous years. But we won’t find out till 2021 results are released! Until then, we can see that part of the rise in properties owned by BC Residents is a rise in “Other Residential” properties, a category containing vacant residential land that became subject to the tax starting with the 2020 tax year.
We can also look more broadly at the declaration status of the 2018 and 2019 SVT properties in the following year, checking in which way SVT properties moved out of the SVT tax paying stock.
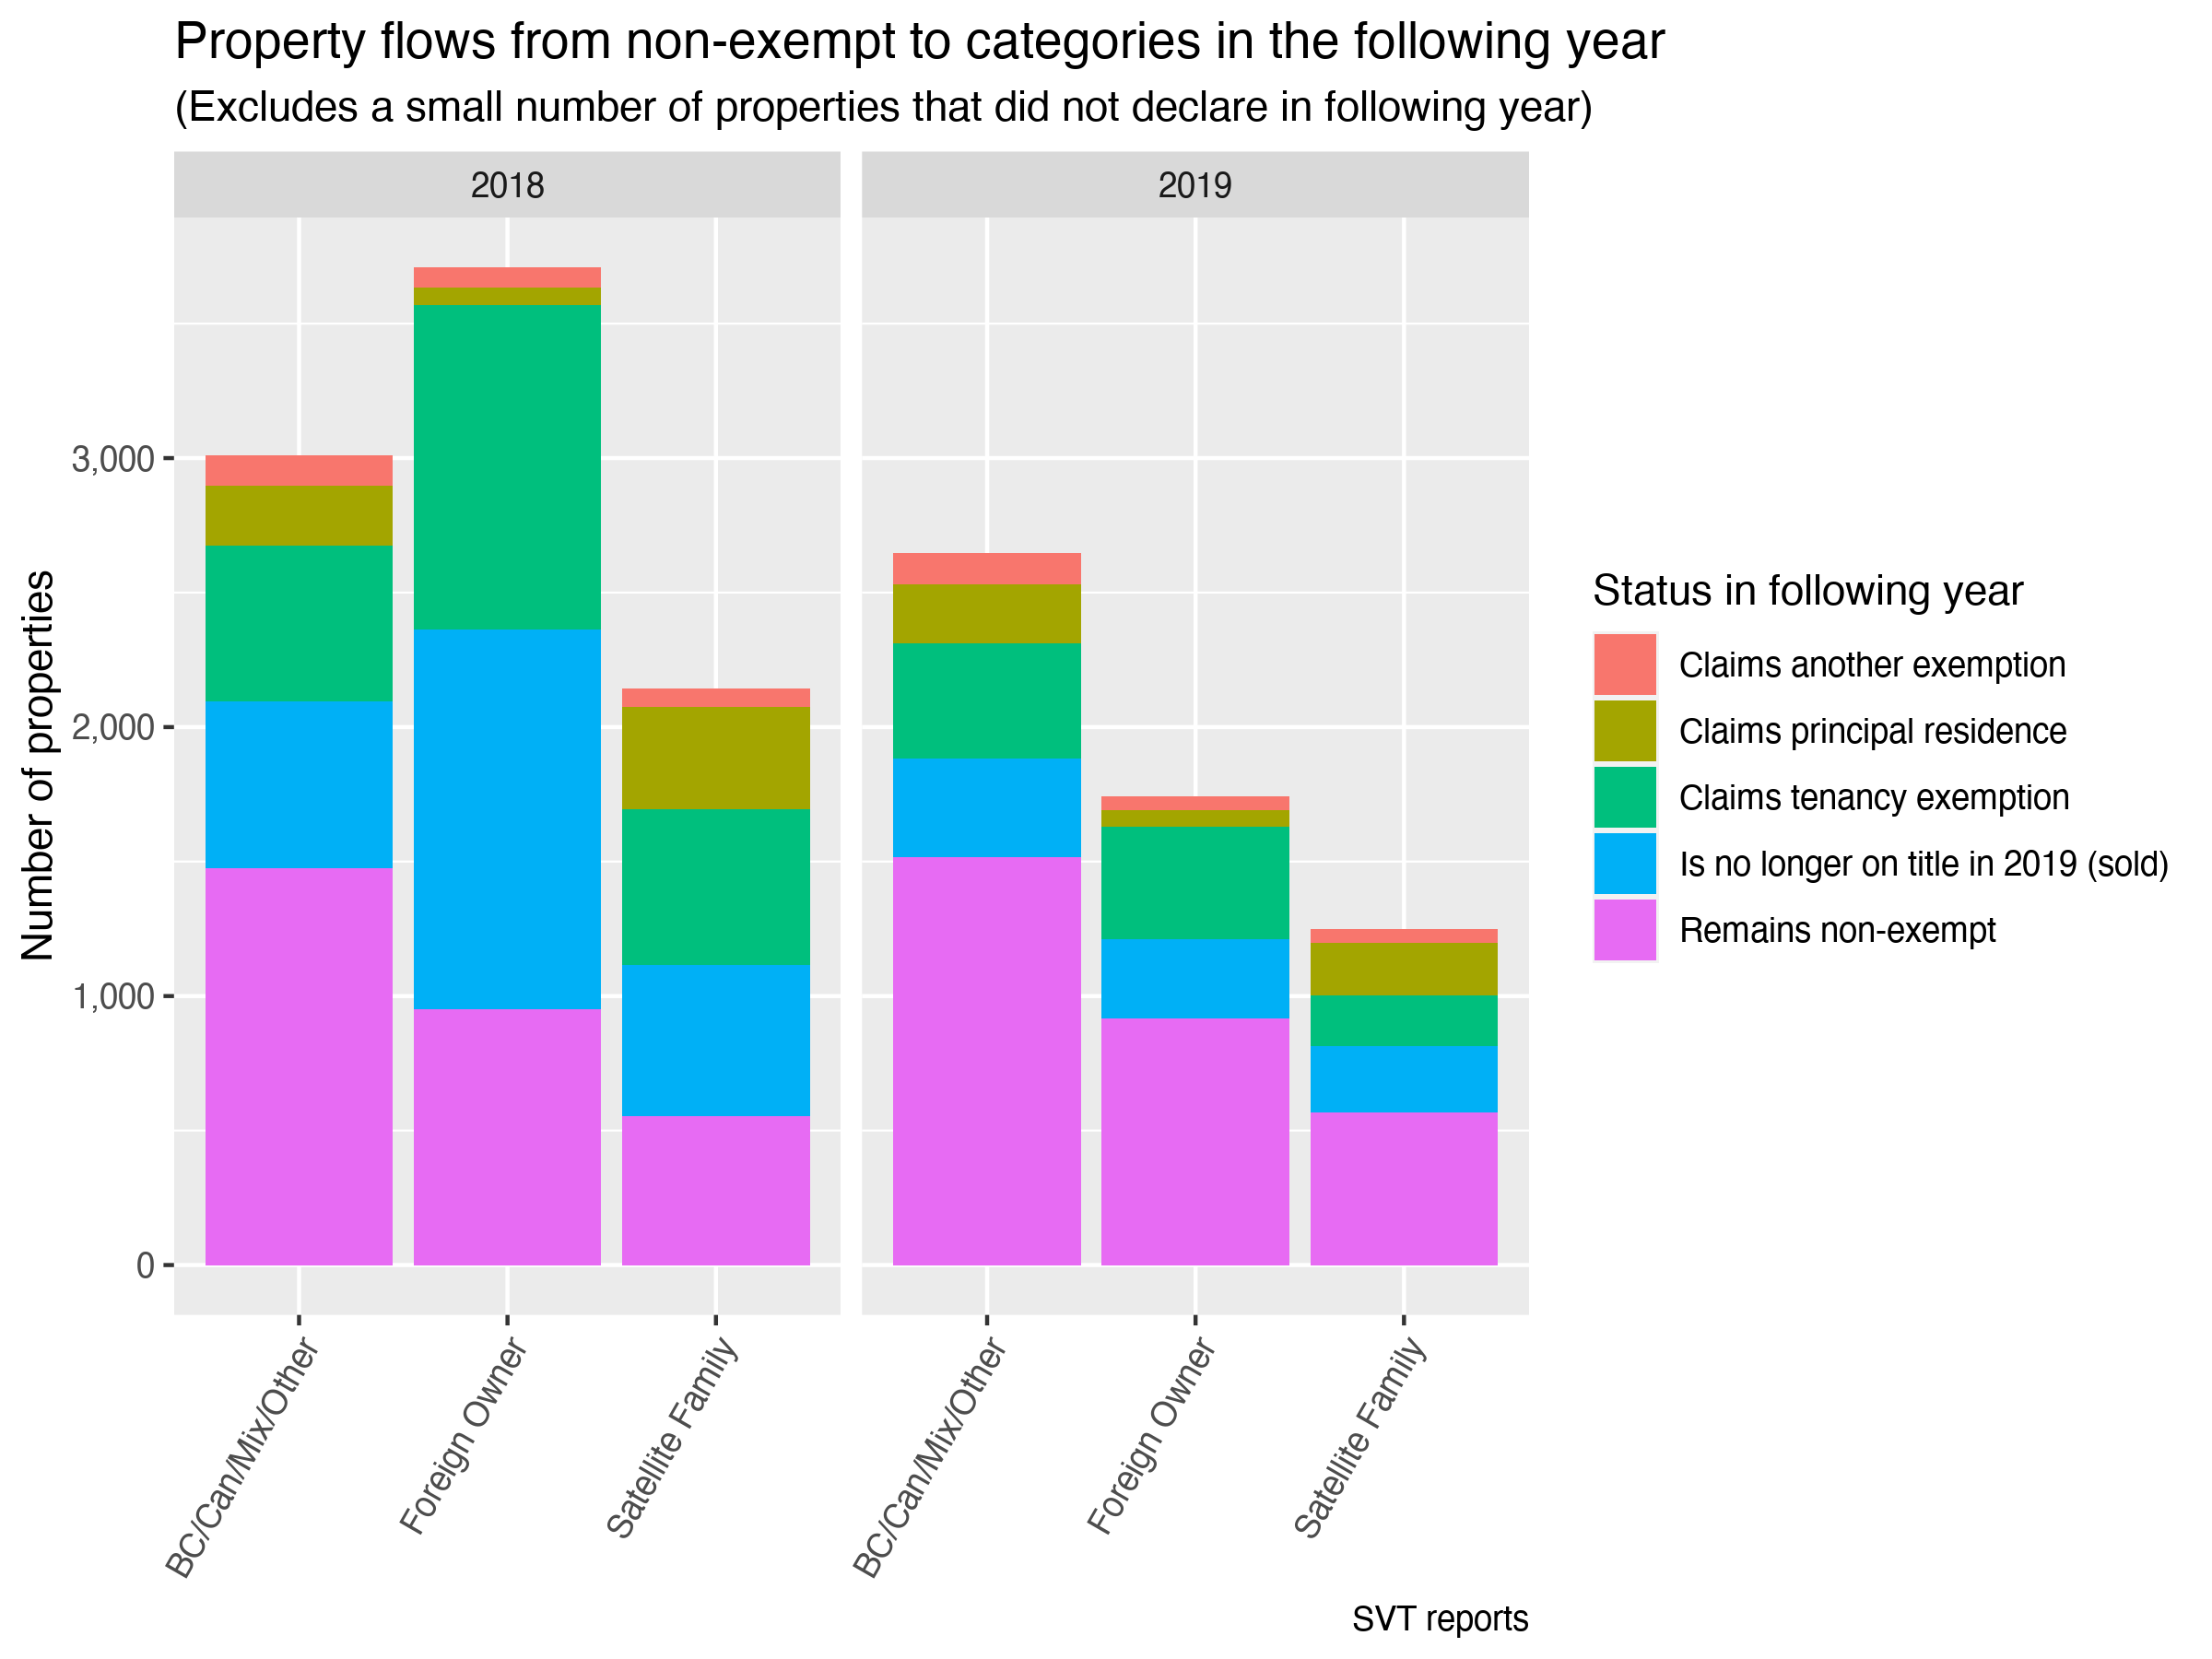
Especially after the initial year Foreign Owners reacted by selling their properties and to an almost equal extent by renting them out. Again, this may be interpreted as a success of the SVT, but it may also just be part of the normal pattern of flows of properties. It is hard to make a definite call, we were unable to construct an at least somewhat robust counterfactual scenario.
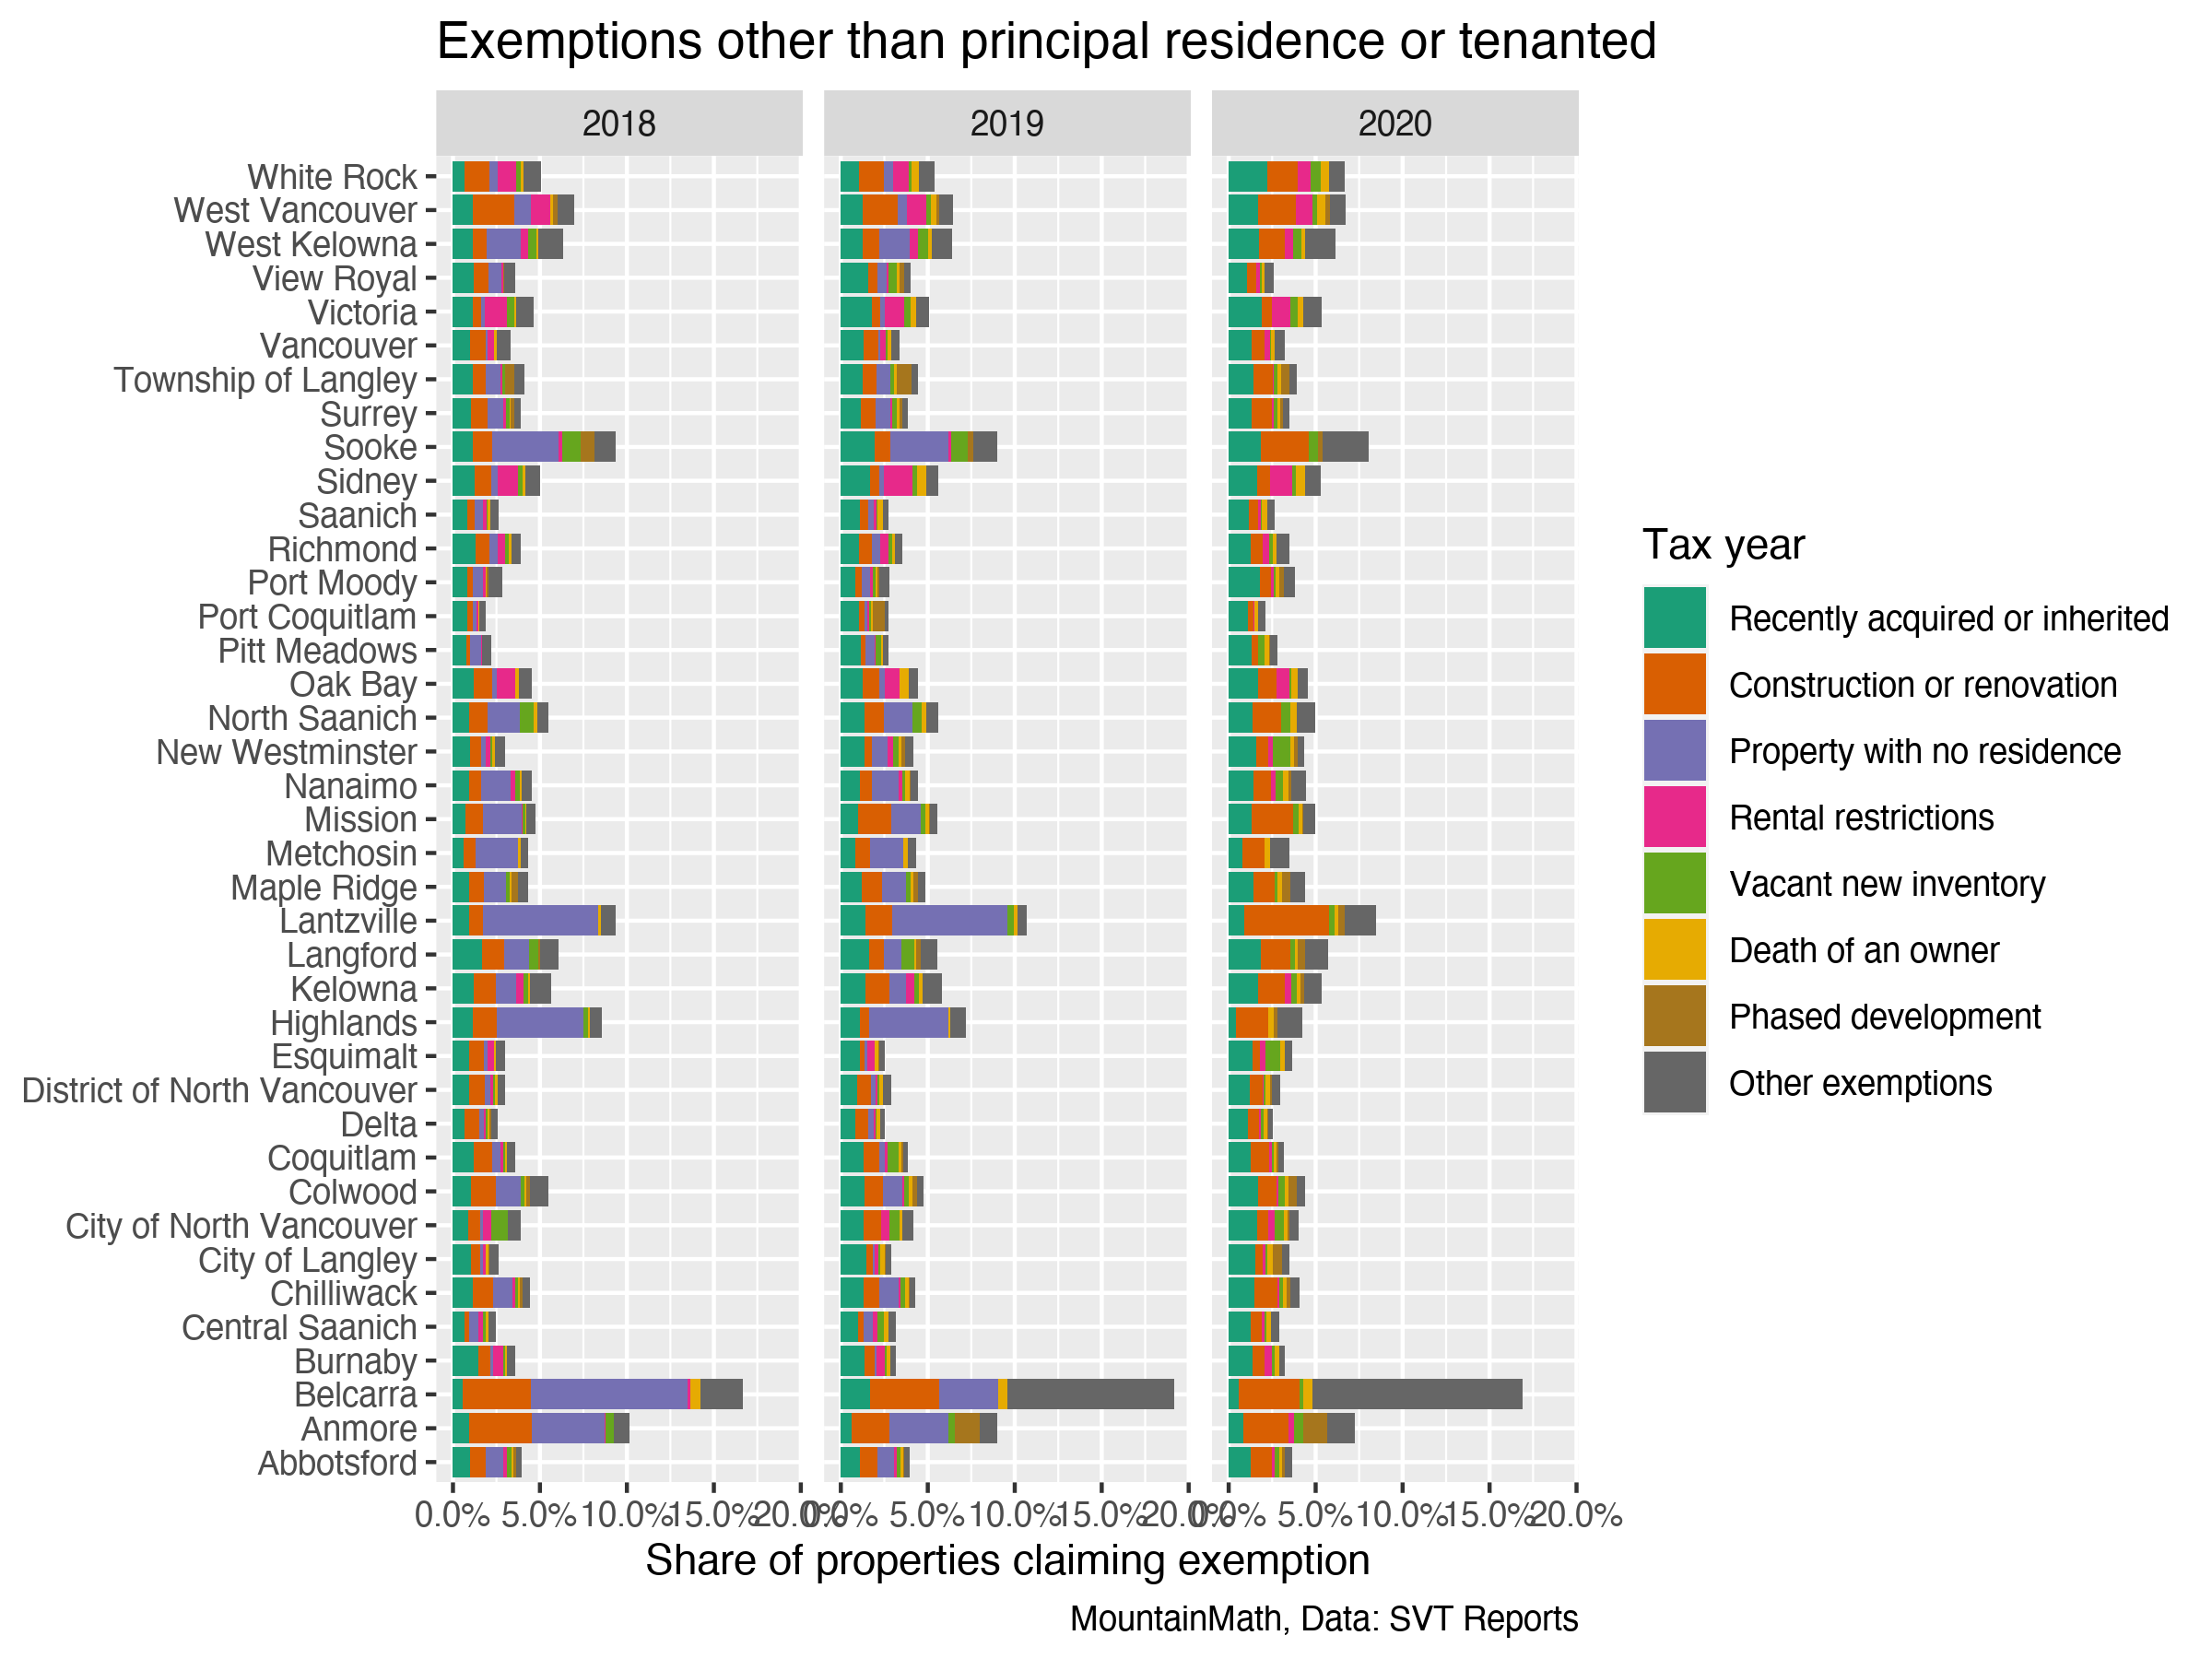
Change and Variation in Other Exemptions
Finally we demonstrate the range of other exemptions provided to the Speculation and Vacancy Tax. The list of exemptions is long, we will focus on the most common exemptions across all municipalities. The way the data is organized means that the “Other exemptions” category is unique to each municipality and contains all exemptions that aren’t shown in the graph for the respective municipality. For instance, in Belcarra, many properties are deemed exempt because they’re only accessible by water.
Municipal breakdown
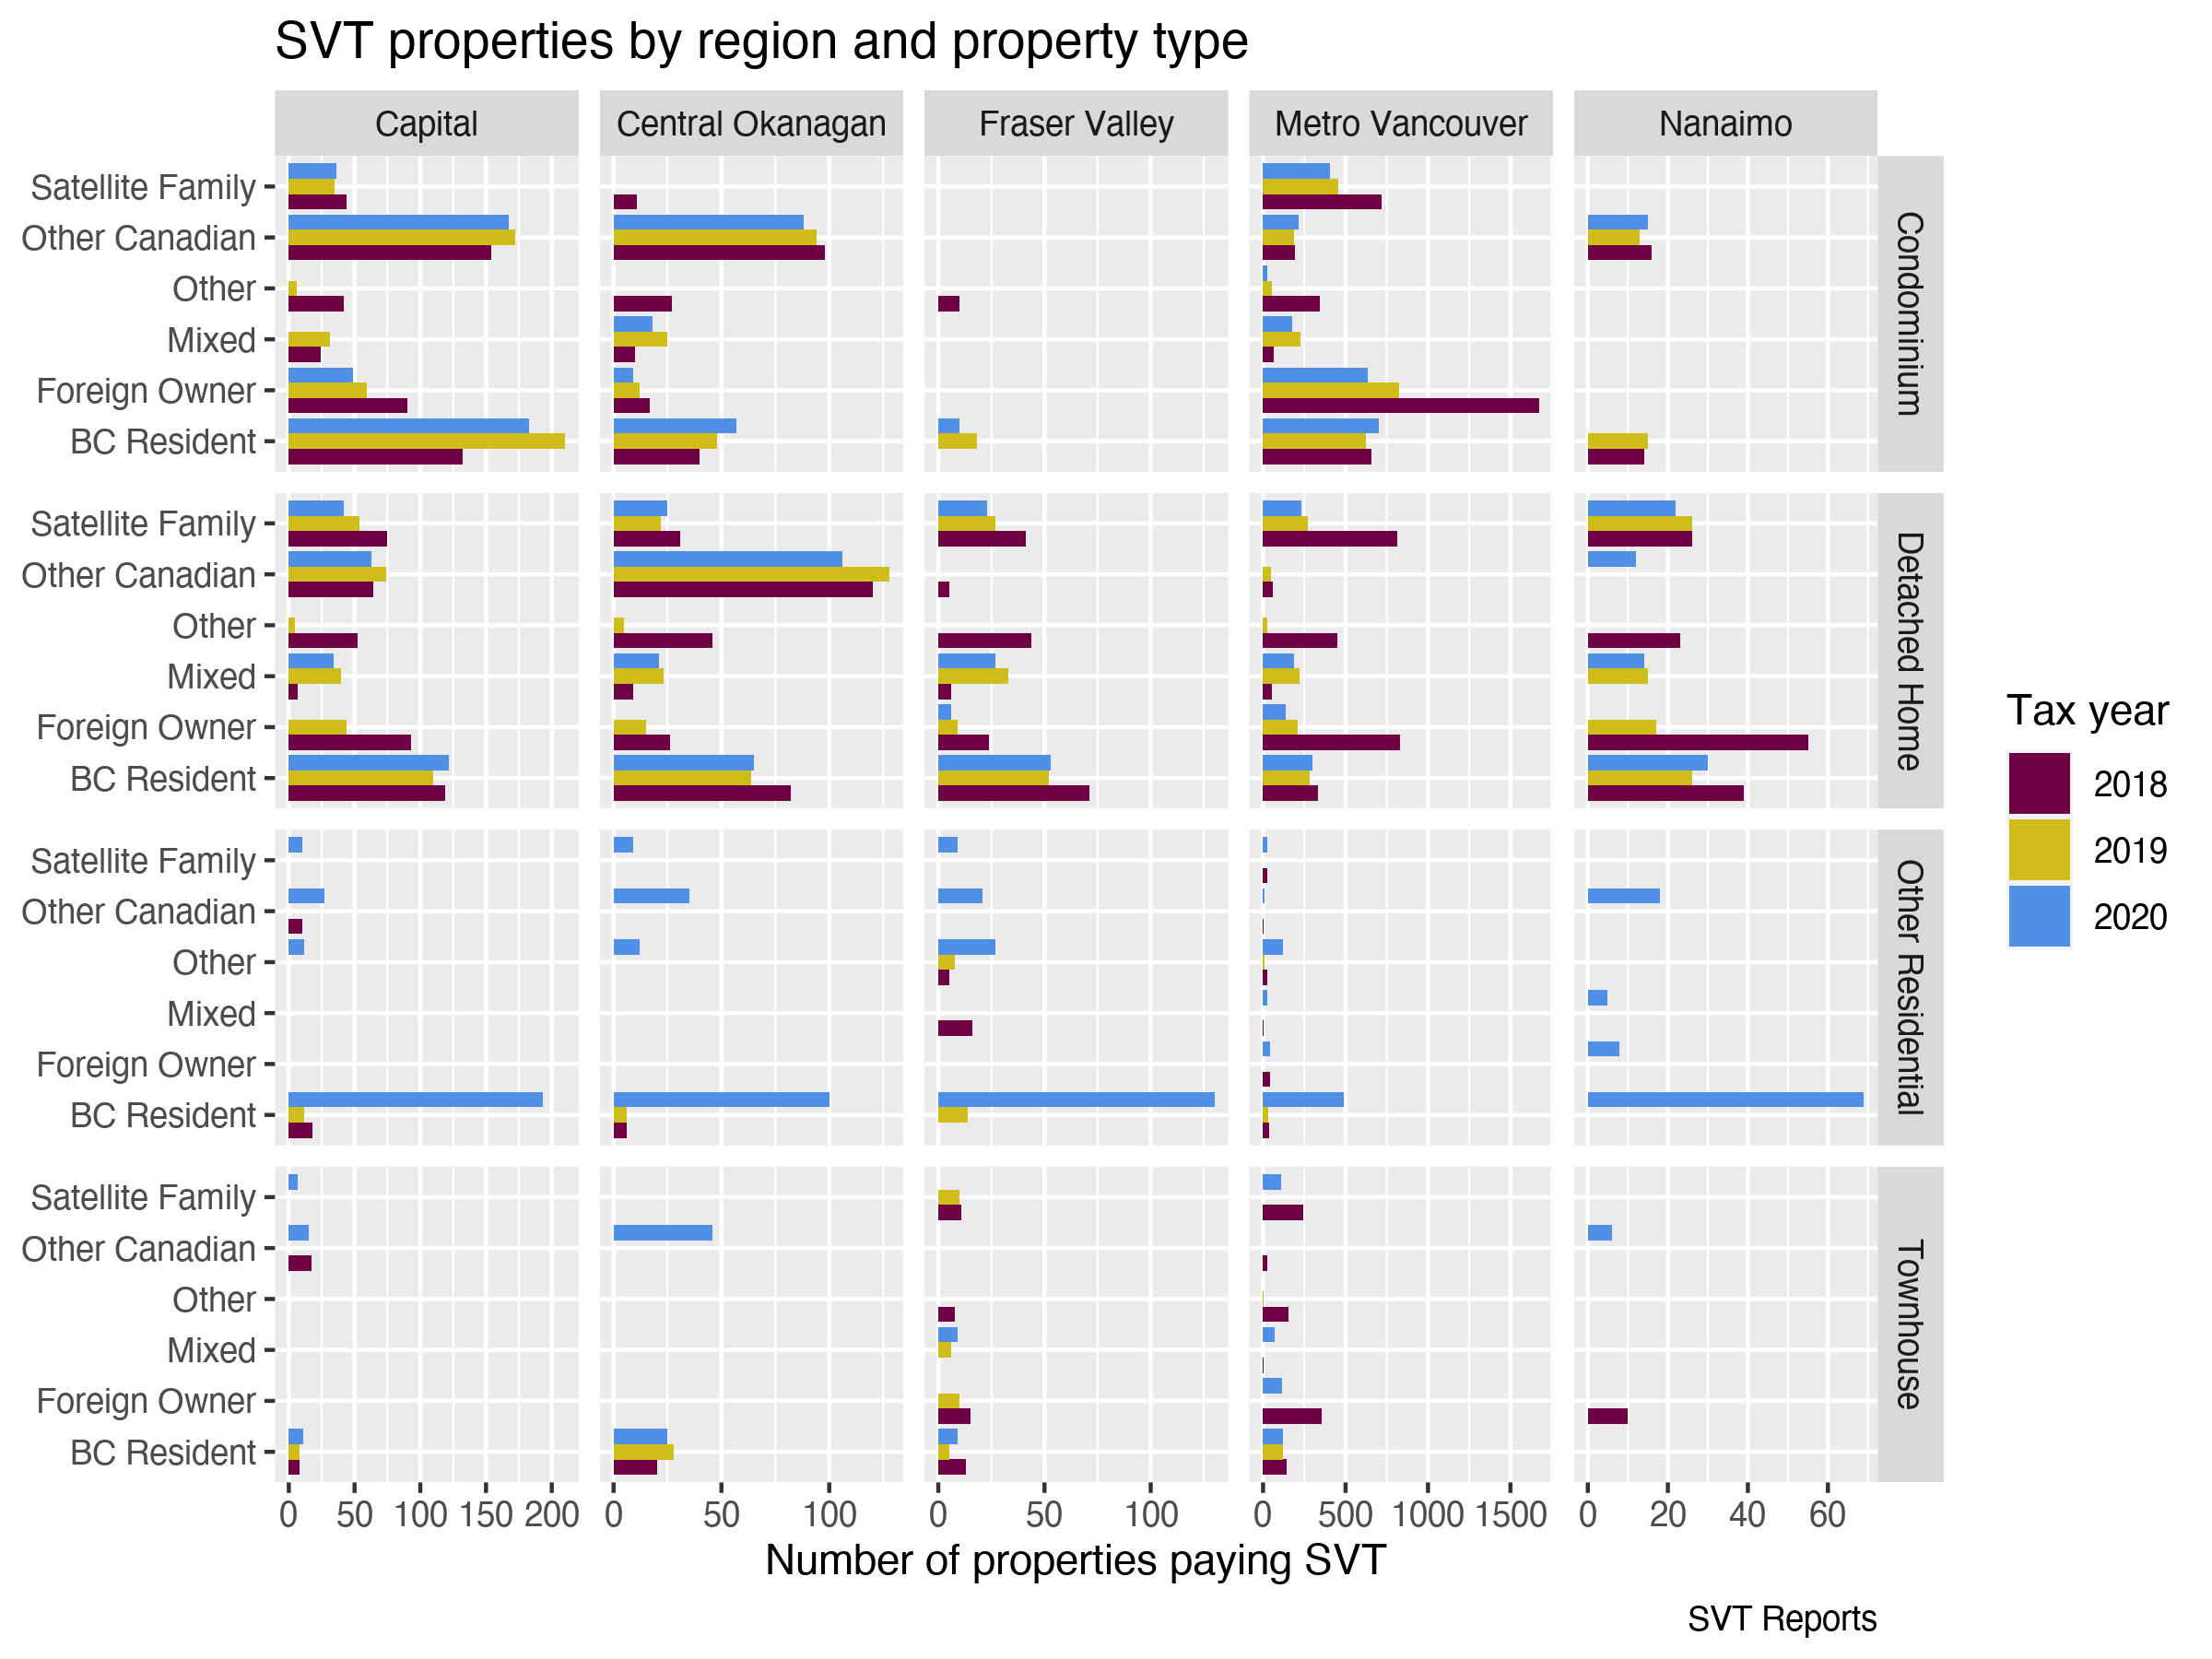
For completeness we are adding municipal breakdowns of properties by municipality, keyed by the residency/tax declaration status of the respective owners, excluding the “BC Resident” category.
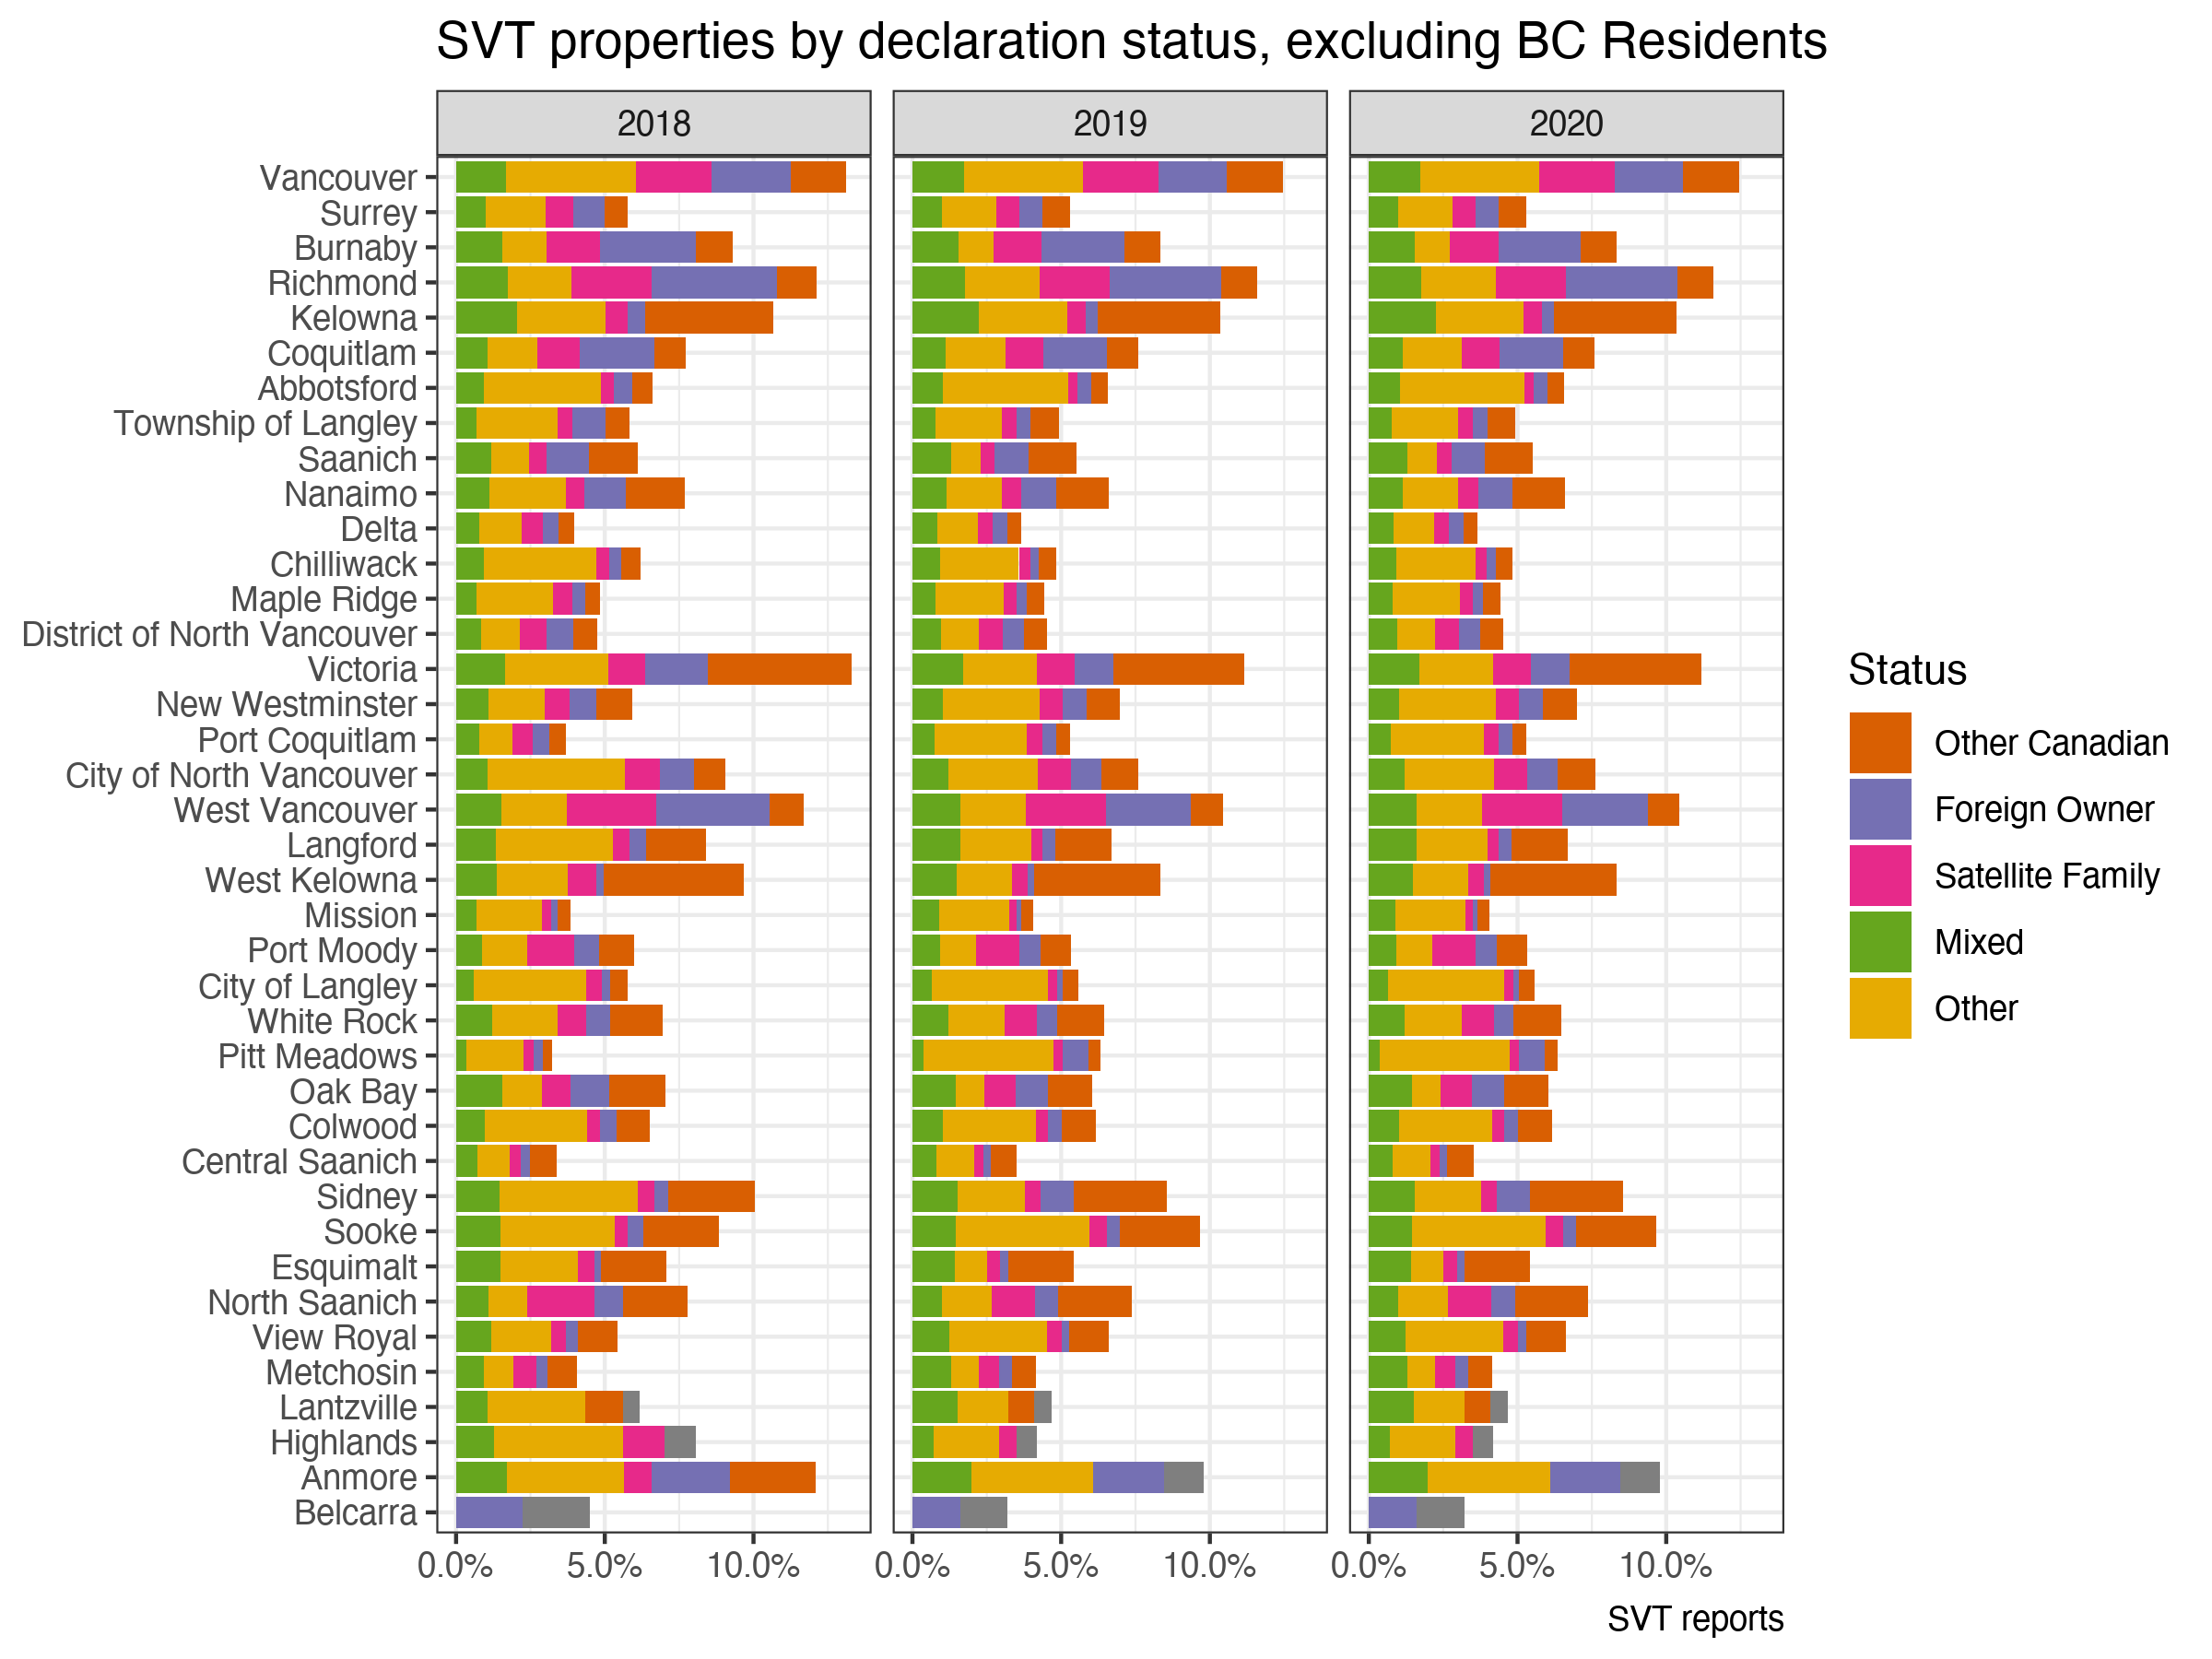
There is a bit of variation across municipalities, ranging from under 5% to over 10% of properties owned by other than a “BC Resident” as defined by the SVT, but things stay within the expected range and shares are surprisingly stubborn across the years. Of these, only a small fraction actually pay the SVT as can be seen in the next graph, now also including BC Residents.
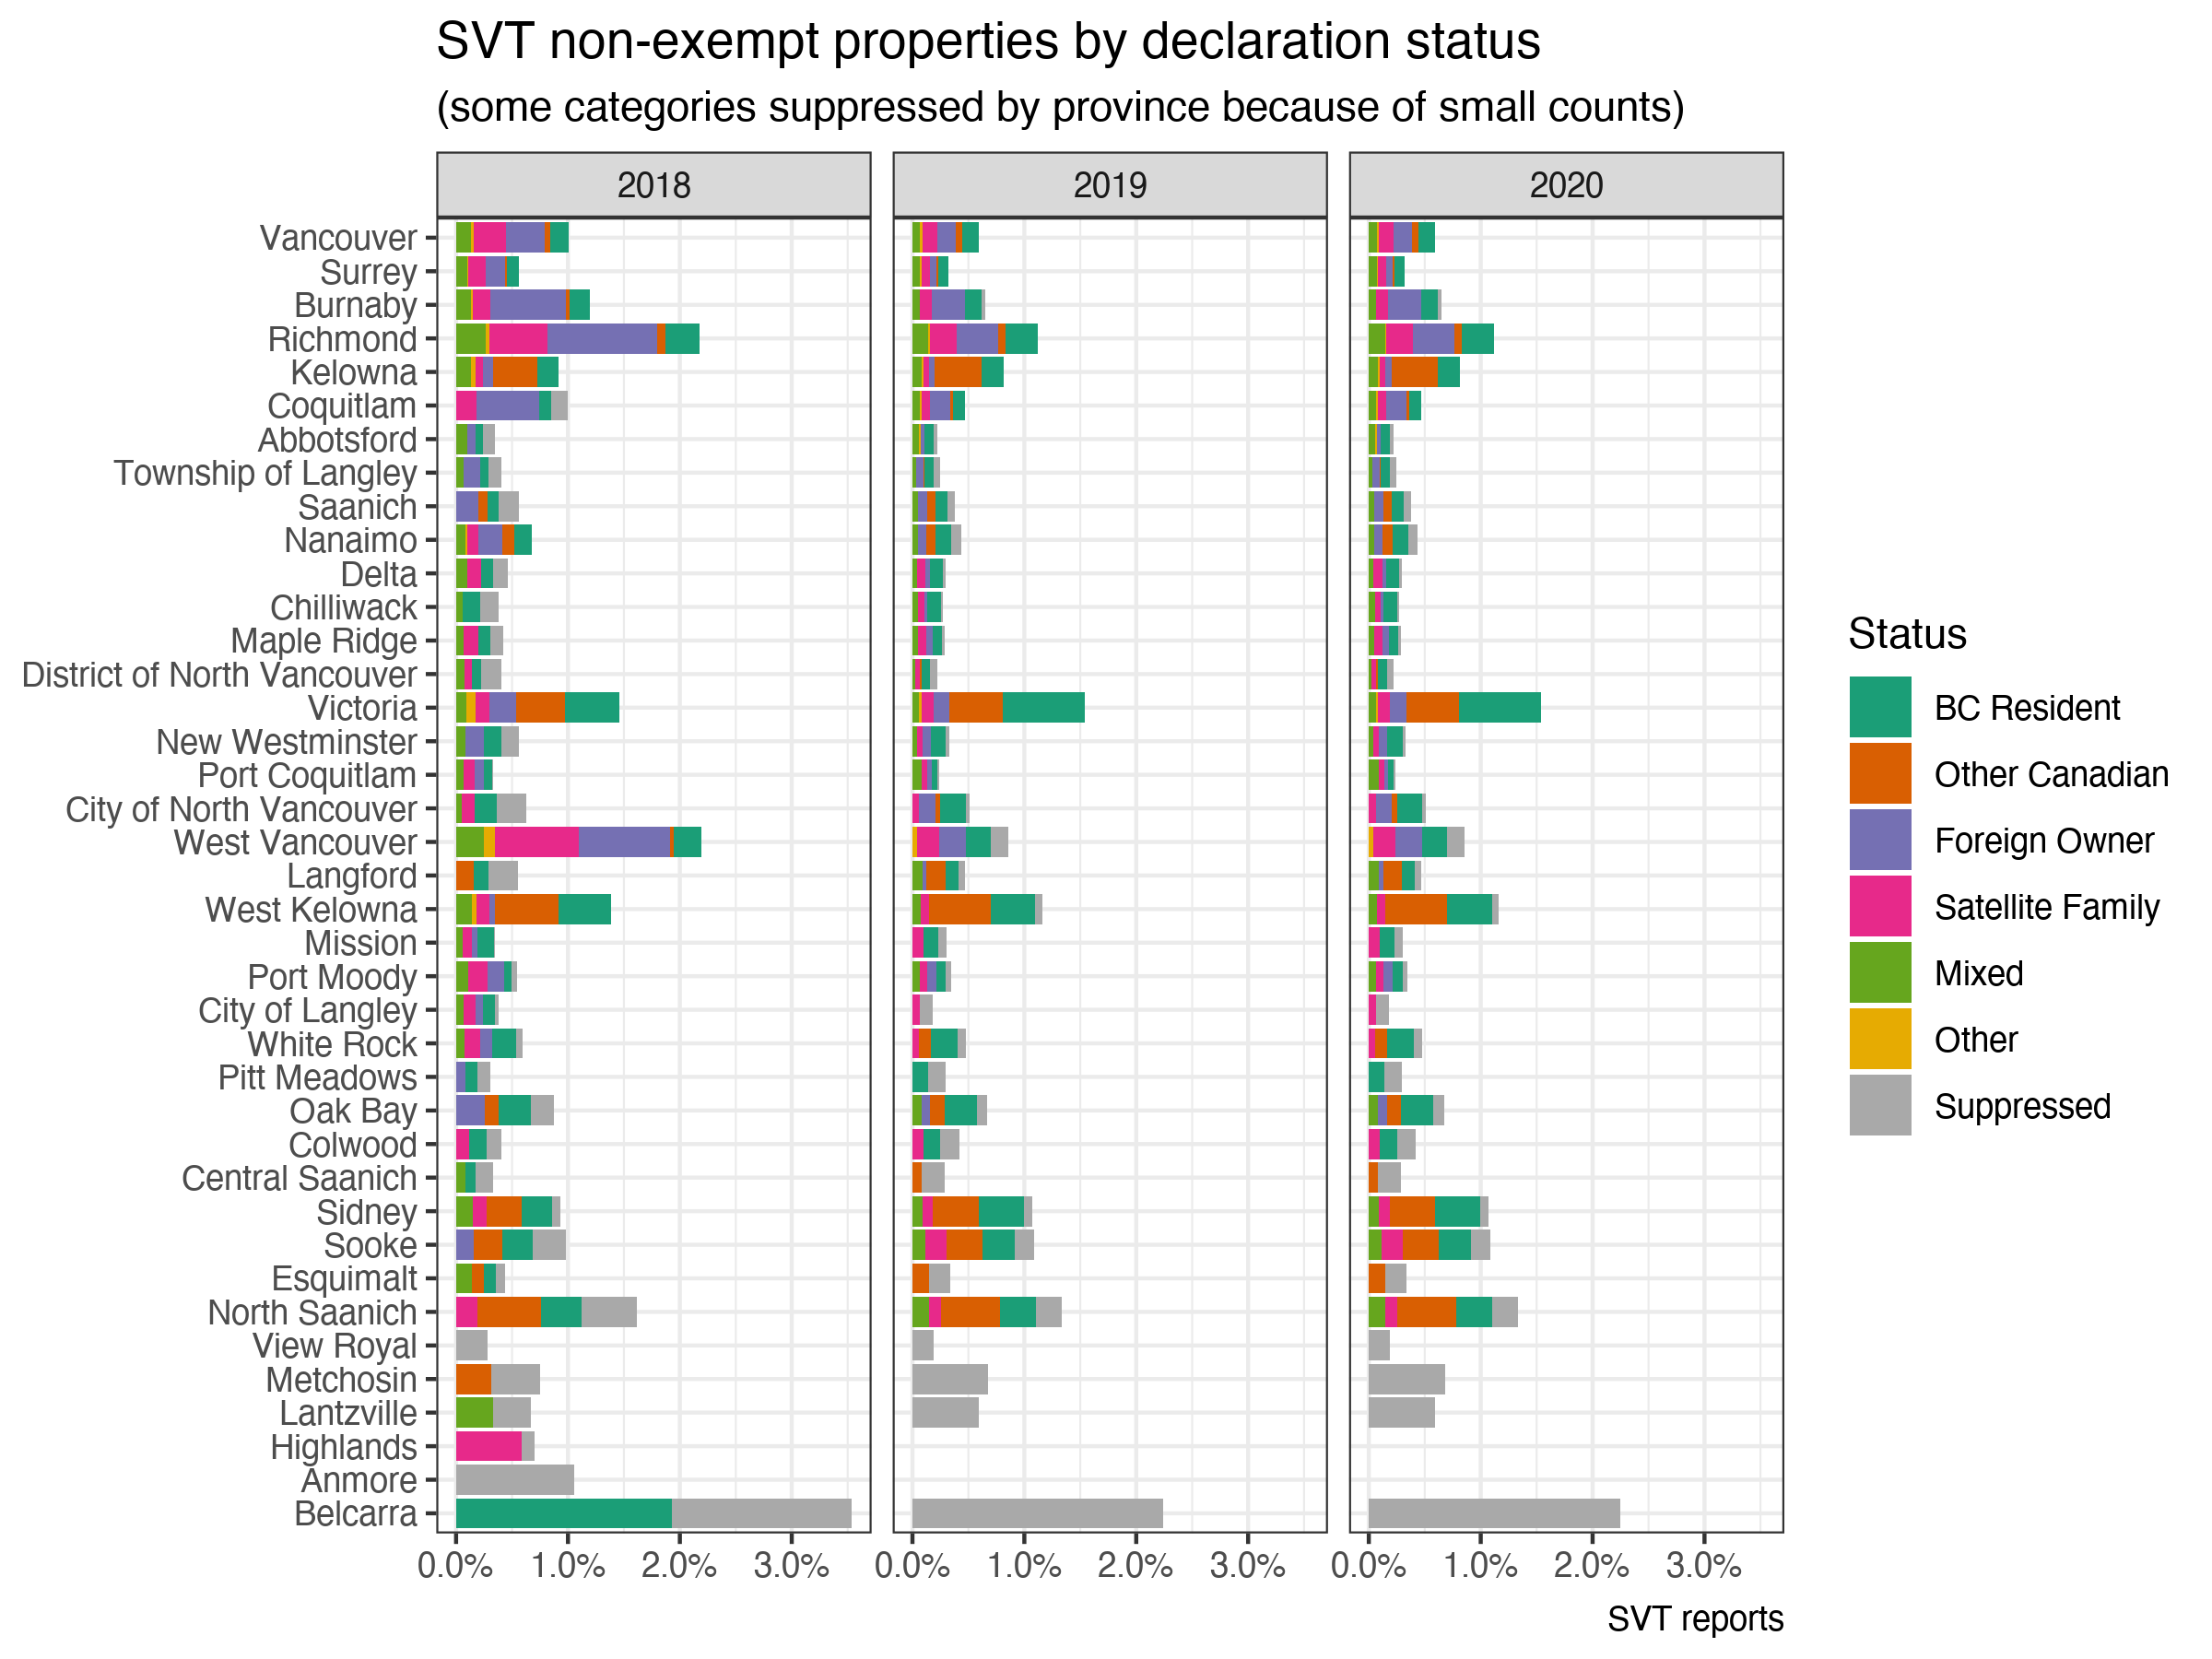
Overall, once again, very few properties now pay the tax. While it varies from municipality to municipality, it rarely exceeds one percent of properties. And only for the very tiny and very unusual municipality of Belcarra does it reach two percent. Notably, Victoria and some nearby communities have a larger share of tax-paying properties than Metro Vancouver municipalities that often take the spotlight in discussions around the tax.
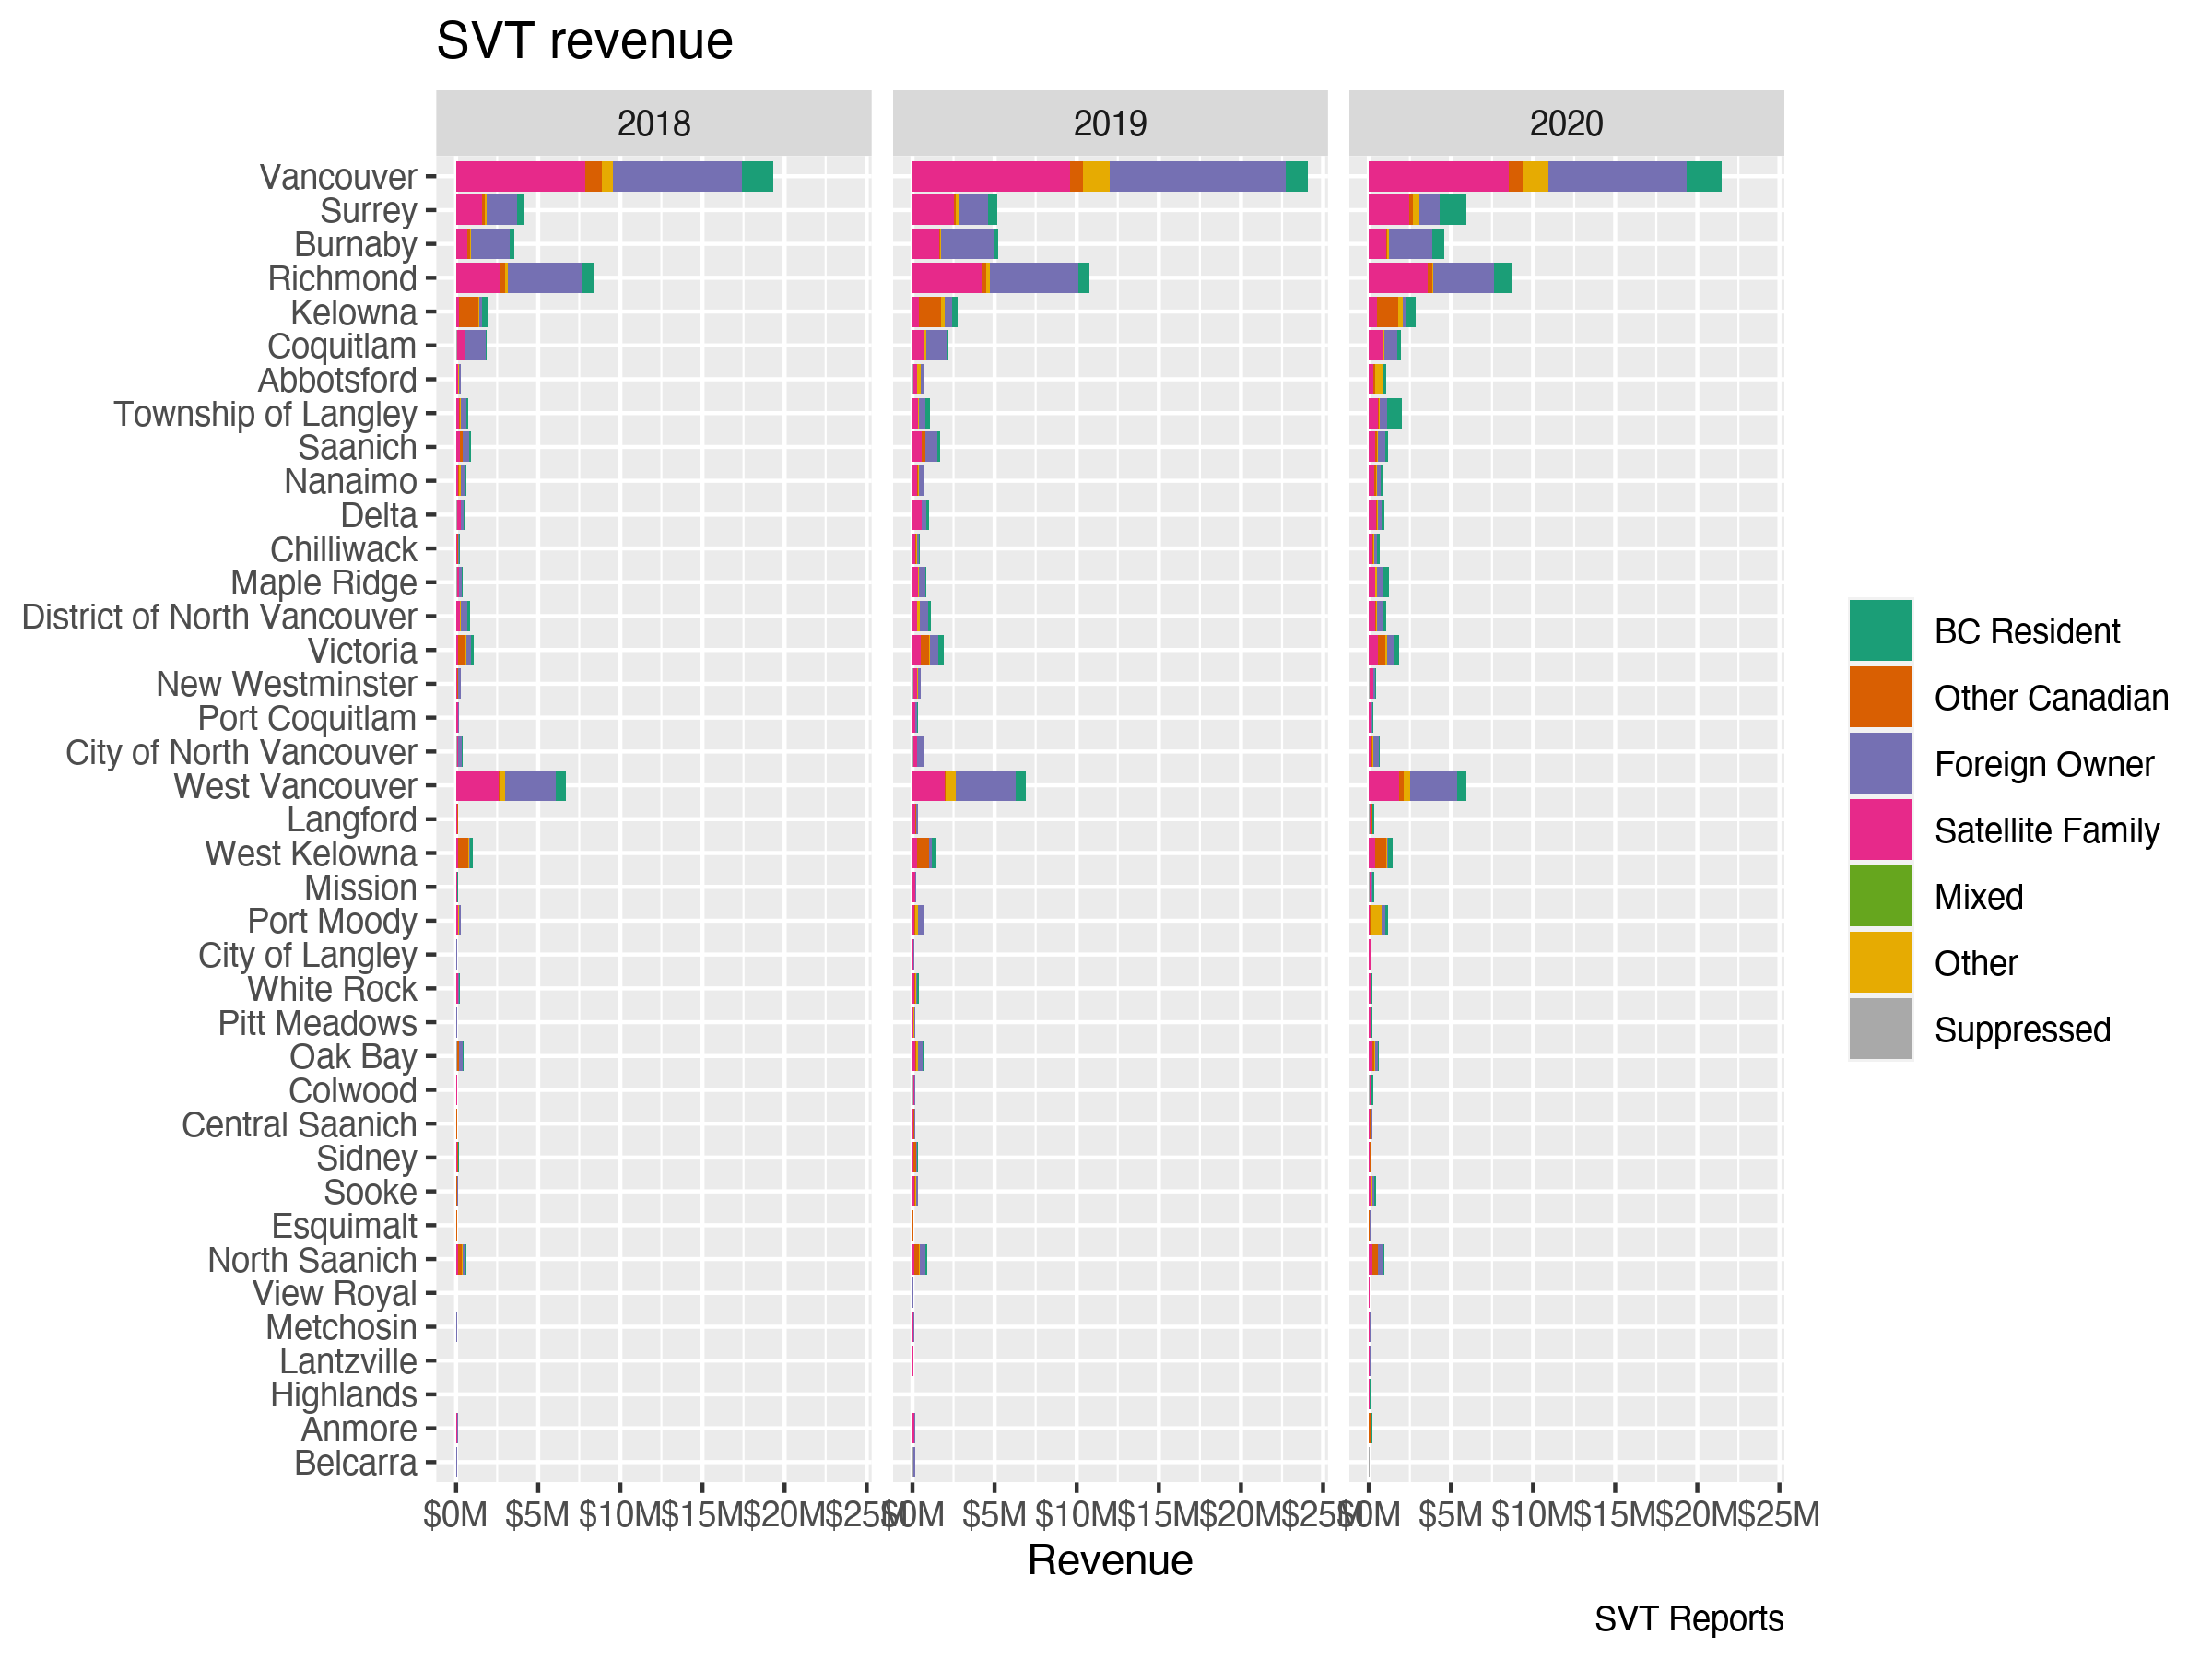
This view switches when we don’t look at the number of properties subject to the tax and instead look at the revenue that the tax generates. For the revenue total number of properties and property valuations matter too, and Metro Vancouver municipalities with more expensive properties make a strong showing.
Takeaway
Overall, we’re glad the BC Government is releasing data on the Speculation and Vacancy Tax, though we wish they’d do so in an easier and less error-prone fashion (What is up with the Cursing of Table 8?) The results demonstrate very little “toxic demand” leading to vacancies in BC, and provide valuable checks on estimates of “foreign” ownership. We also get a fun look at how properties shift status between years. At the same time, we continue to urge the BC government to reconsider certain aspects of the tax and its presentation. In particular, is toxic demand better if it comes from BC? If not, why does the tax code treat it that way? Moreover the government should recognize that just because residents of BC have spouses working abroad does not mean they’re no longer residents of BC.
As usual, the code for this post, including the code to scrape the data out of the PDFs, is available on GitHub for anyone to reproduce or adapt.

2 thoughts on “Three Years of Speculation and Vacancy Tax Data”