co-authored with Jens von Bergmann and cross-posted at MountainMath
In this post we look at the most recent population (and household) estimates to see if we can detect any signals concerning how the COVID-19 pandemic may have impacted how (and where) we live. This is inherently tricky; lots of things changed during COVID times, including how well our normal methods of estimation work. That makes time series less reliable, even as we’re especially concerned with how conditions have changed. So in this post we attempt to pay special attention to what we can and can’t glean from the signals we’re receiving so far.
Population estimates
Population is the most basic unit of measurement for demographic data. But how do we know how many people live in a region at a given point in time? The short answer is: we don’t know exactly how many, unless we are talking about a highly regulated environment like a prison. Population is floating, constantly in motion, moving, getting born, or dying. But we generally don’t need exact counts insofar as good estimates will work just fine for most purposes.
So how do we estimate the population in a given region at a specific point in time? The simplest way is we count, and we do that every 5 years in the census. We’ll be getting estimates from 2021 soon! But even the census misses people (who are mostly asked to count themselves). And it occasionally counts people twice. Ultimately, it’s only an estimate. Which leads us to the question: how good of an estimate is it?
Census population coverage error
By how much does the census under or over-count people? We’ve got ways to estimate that. It starts with the Reverse Record Check. This is a post-census survey that aims to estimate over and undercoverage errors. Next the Record Check gets combined with the results from the Census Overcoverage Study that uses census responses to find possible instances where people have been counted multiple times. Administrative data from CRA tax returns aid in this process. The result is census under and overcoverage estimates. So far undercoverage always exceeds overcoverage, and so combining the two we can get a net undercoverage estimate.
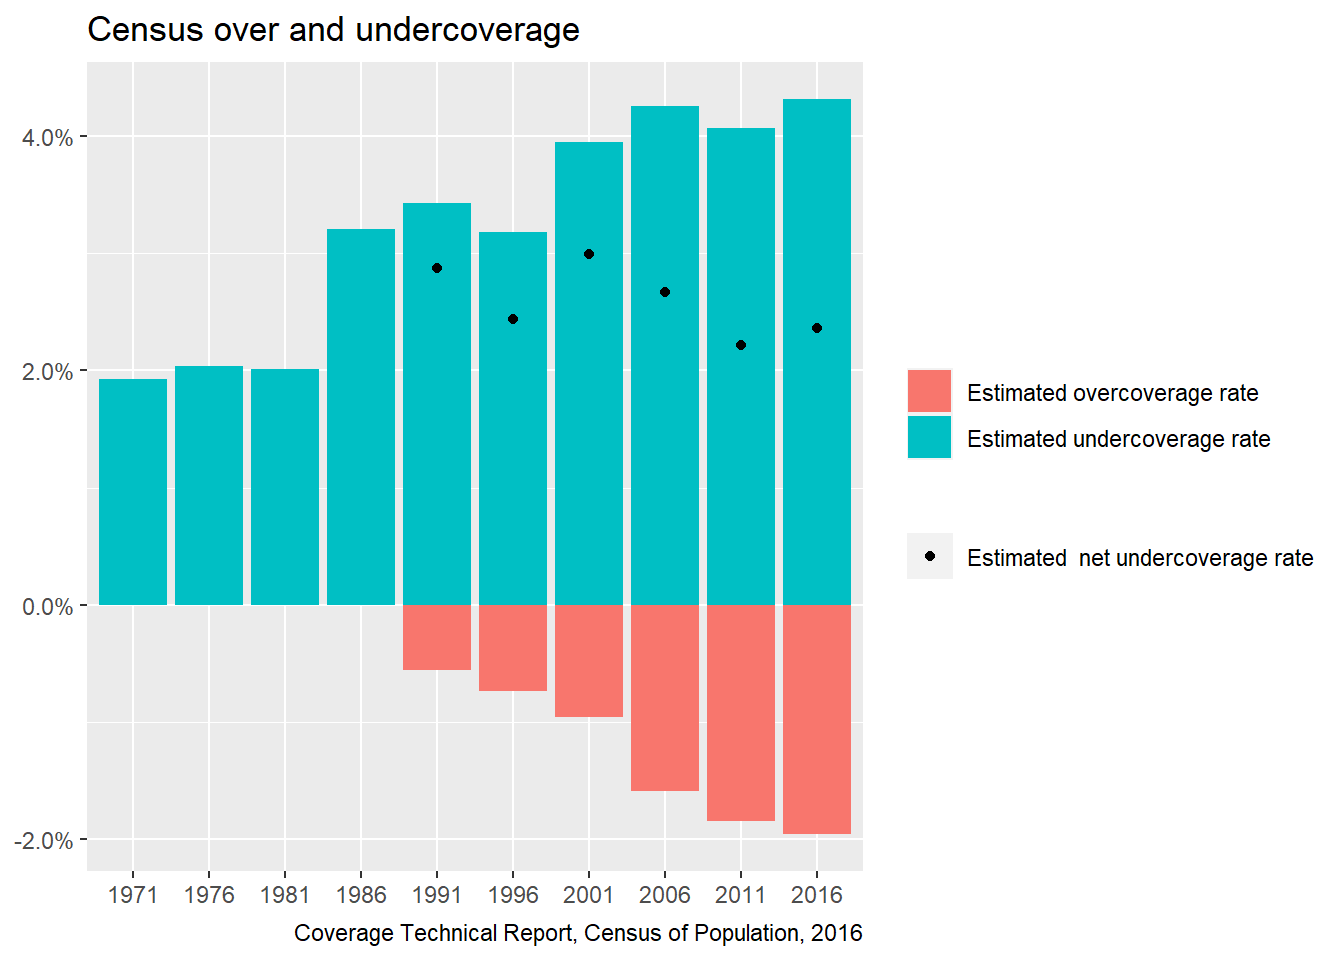
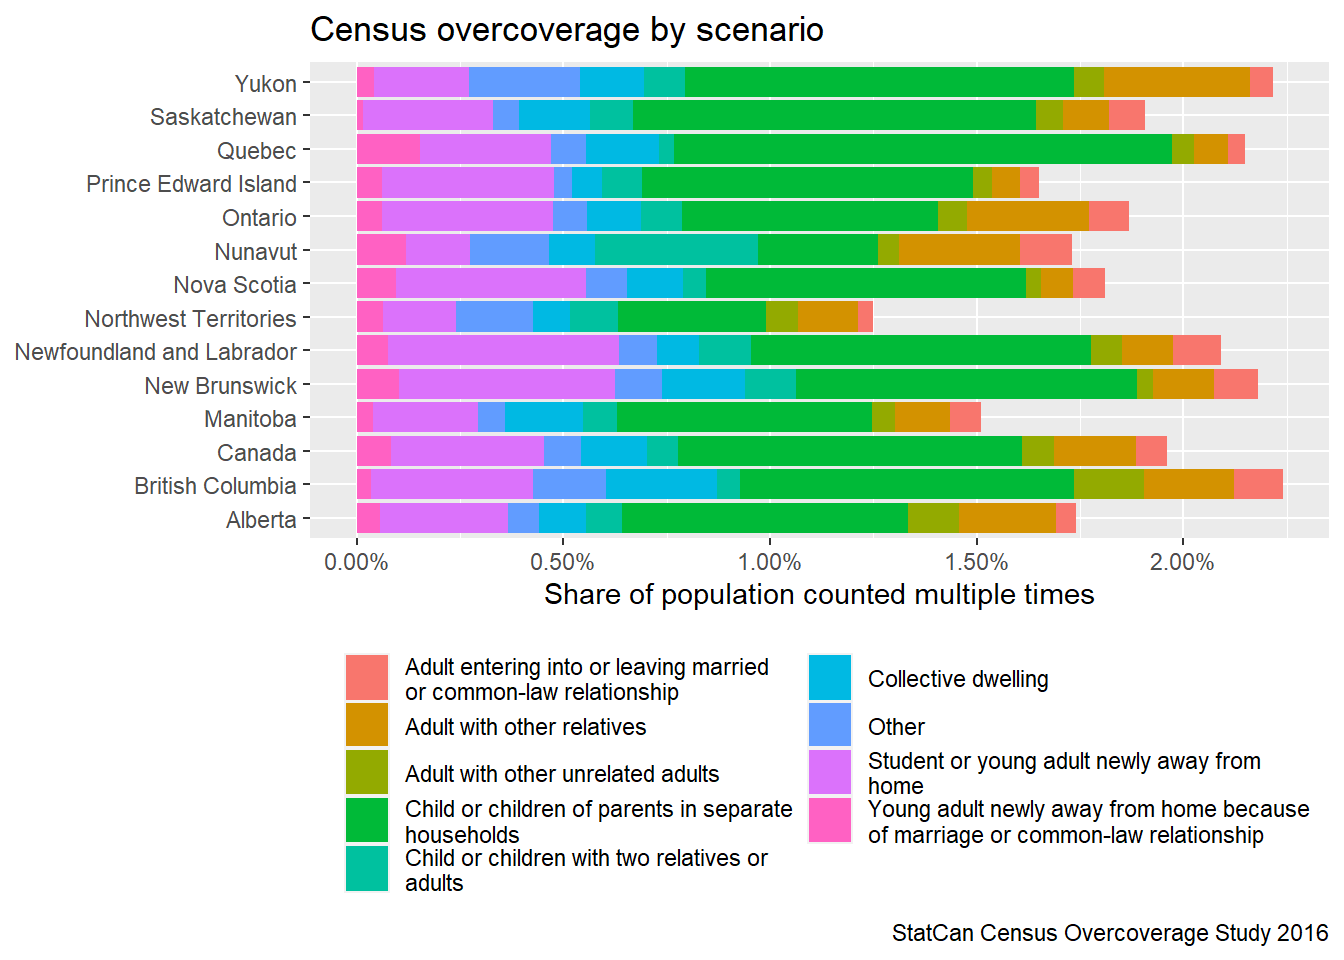
Statistics Canada works hard to get better at its job, and there have been changes in methods over time, continuously refining how to estimate these errors. Statistics Canada also breaks out reasons for overcoverage, the largest of which is that some kids live in and get reported as members of more than one household (hello dual custody!) But there are all kinds of reasons that it’s tricky to keep track of counting everyone once and only once as they move around.
Annual population estimates
What do we do in years when we don’t have a census? This was a major problem making it difficult to judge the effects of the 1918 pandemic; it occurred between censuses, along with a major Depression and World War. Sure would’ve been nice to have annual population estimates! Now we do. Basically, we use tax records to extrapolate forward from the census. When people file their taxes they give their address, and the T1 taxfiler data allows the count of taxfilers per census geography. Sort of… the details of assigning taxfiler address to census geographies are messy. Tax data also has information on family structure. For example, people with children may claim child benefits. This gets compiled into a richer dataset that contains information on “taxfilers and dependants”, called the T1FF taxfiler data.
T1 and T1FF data
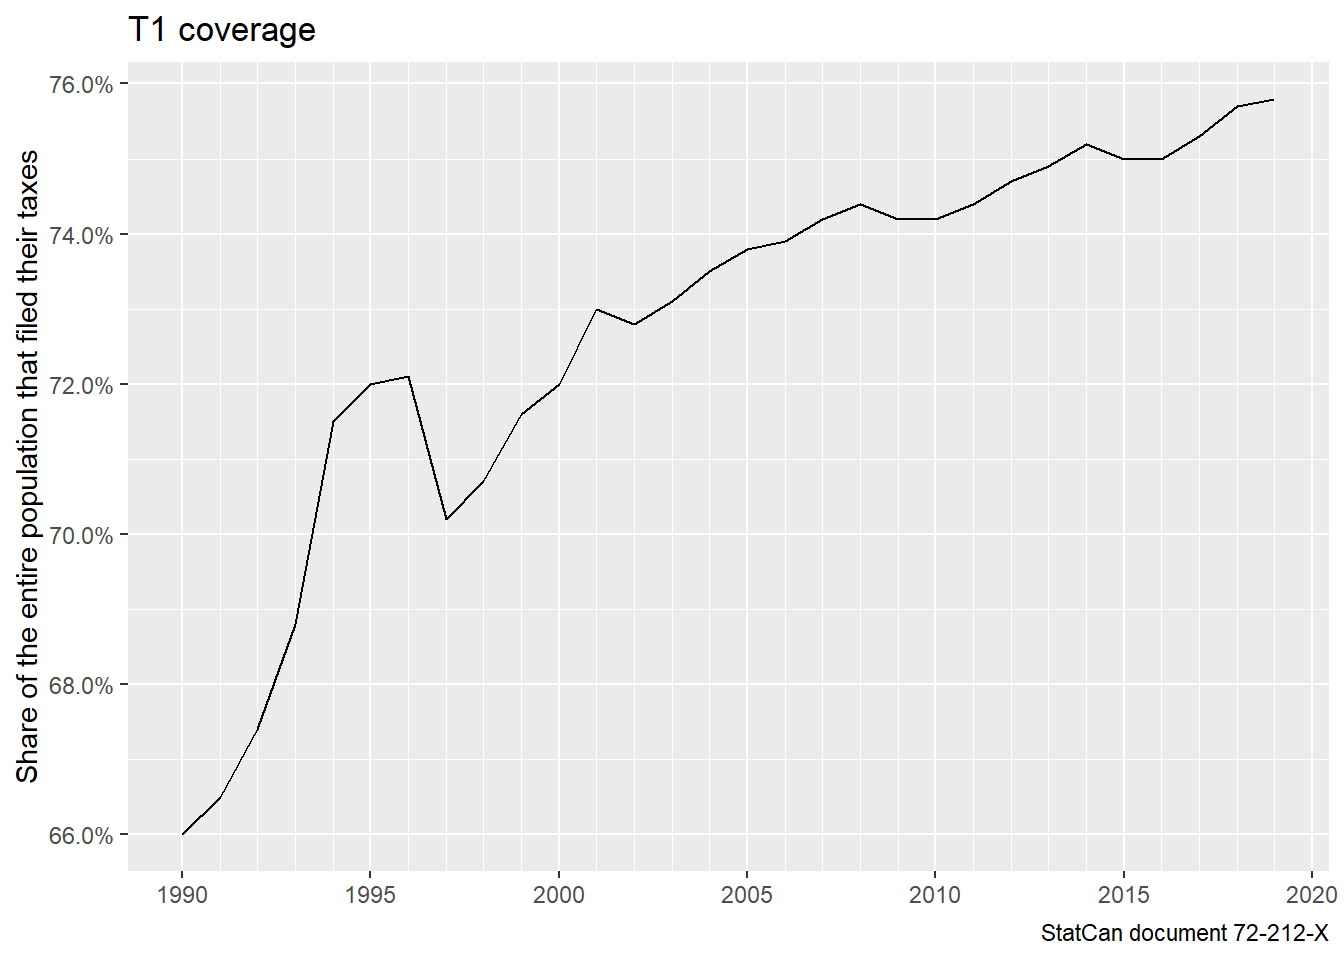
In Canada everyone aged 15 and over is supposed to file a tax return. But not everyone does, and legal obligation is relaxed for those without taxes owing. The T1 and T1FF coverage gets estimated by comparing with demographic estimates (that again use T1FF tax data) anchored around the census. We can tell that over time the rate of people (of all ages) filing a tax return has increased.
Despite the rise in tax-filing, it’s worth noting that there are still a lot of people missed (a problem, for instance, in redesigning the CRA system to deliver benefits to those in need). Once the T1 data is processed to identify children and other dependants that did not file a return, we arrive at the T1FF file.
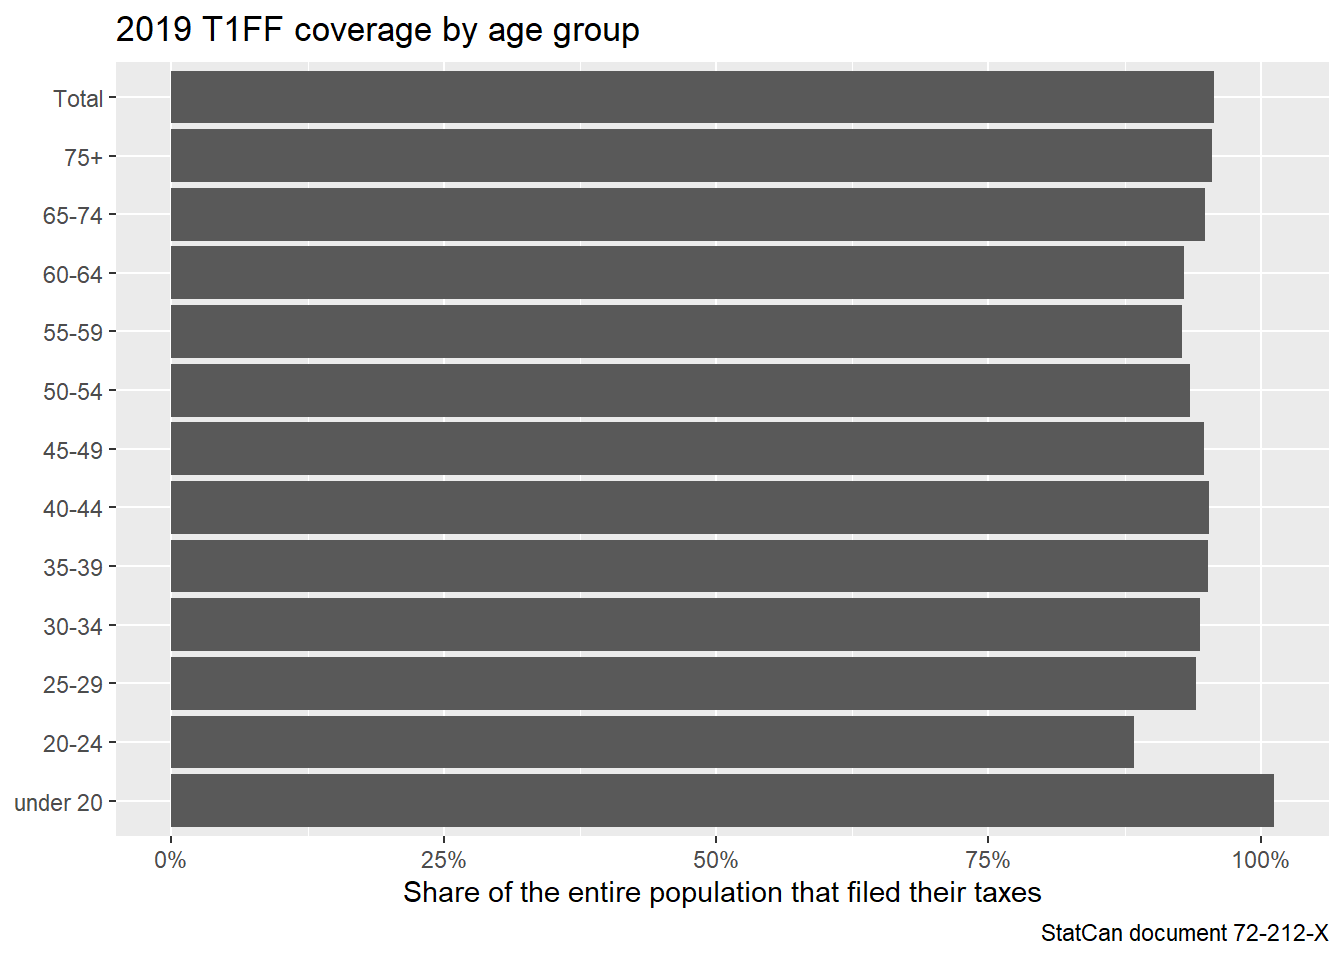
Now we notice a slight overcoverage of children, likely reflecting multiple people filing the same children as dependants (“That’s what we get when we use this denominator”). We also notice a persistent under-coverage for other age groups, especially young adults around university age. We can also assess provincial and territorial variation in T1FF coverage, where Yukon appears the farthest off the grid administratively speaking.

Annual population estimates (for real now)
We have seen that T1 and T1FF data give us a pretty good idea how many people live in an area, but it’s not really good enough to use that as population estimates, with the possible exception of well-claimed children. But how do we know that? What are the coverage estimates based on? This is where things get slightly tricky and might seem circular at first sight.
For census years, we know how to measure the T1 and T1FF coverage by using census counts plus the census coverage estimates. To get population estimates for the in-between years we might be tempted to use the T1FF data, but instead of using the counts directly StatCan looks at the change of population in T1FF data, and estimates the population the year after the census by multiplying it with the growth rate of the T1FF population. This assumes that coverage is roughly constant in each region. Then there are a whole bunch of quality control steps that look at births, deaths, immigration and other records to round things off, using standard demographic accounting formulae (subtract deaths, add births and net immigration), but these typically happen at census district or higher level geography.
The basic assumption that makes things work is that population changes gradually, and the composition of population changes slowly too. So any kind of errors in the T1FF data change slowly and divide out when looking at rates of change of T1FF data year over year. But as we get further and further out from the last census our estimates get worse. Fortunately we have a census every 5 years in Canada to anchor things again, and the StatCan population estimate time series gets updated retroactively to reflect that. We can see the echo of this in the estimates of the components of population change that contains the “Residual deviation” component, which distributes the difference of the original population estimates and the post-censual population estimates over the last 5 years. For example, by the time the 2016 census rolled around the population estimate for Metro Vancouver was 50,296 people short (an error of about 2%), so these extra people were retroactively distributed as population growth of unknown source over the five year over year growth periods between 2011 and 2016.
Show me the data
Let’s take a look at the population estimates. As we have seen, they aren’t perfect. And the smaller the areas we choose the more error-prone they become. The finest geography that StatCan publishes population estimates on is census subdivisions, i.e. municipalities. This data informs municipal planning. There may be some quality issues at times, but hopefully not too bad.
To add some fun, StatCan just released provisional population estimates for BC municipalities for 2021 to aid with disaster response. T1FF taxfiler data for the 2020 tax year, which are used as a population growth proxy for their filing date in spring 2021, are not yet available, so this is based off of projecting forward the growth rate of 2019 tax year T1 data vs the preliminary 2020 T1 data. In effect, it’s a bit more funky than usual, but let’s throw that into the mix.
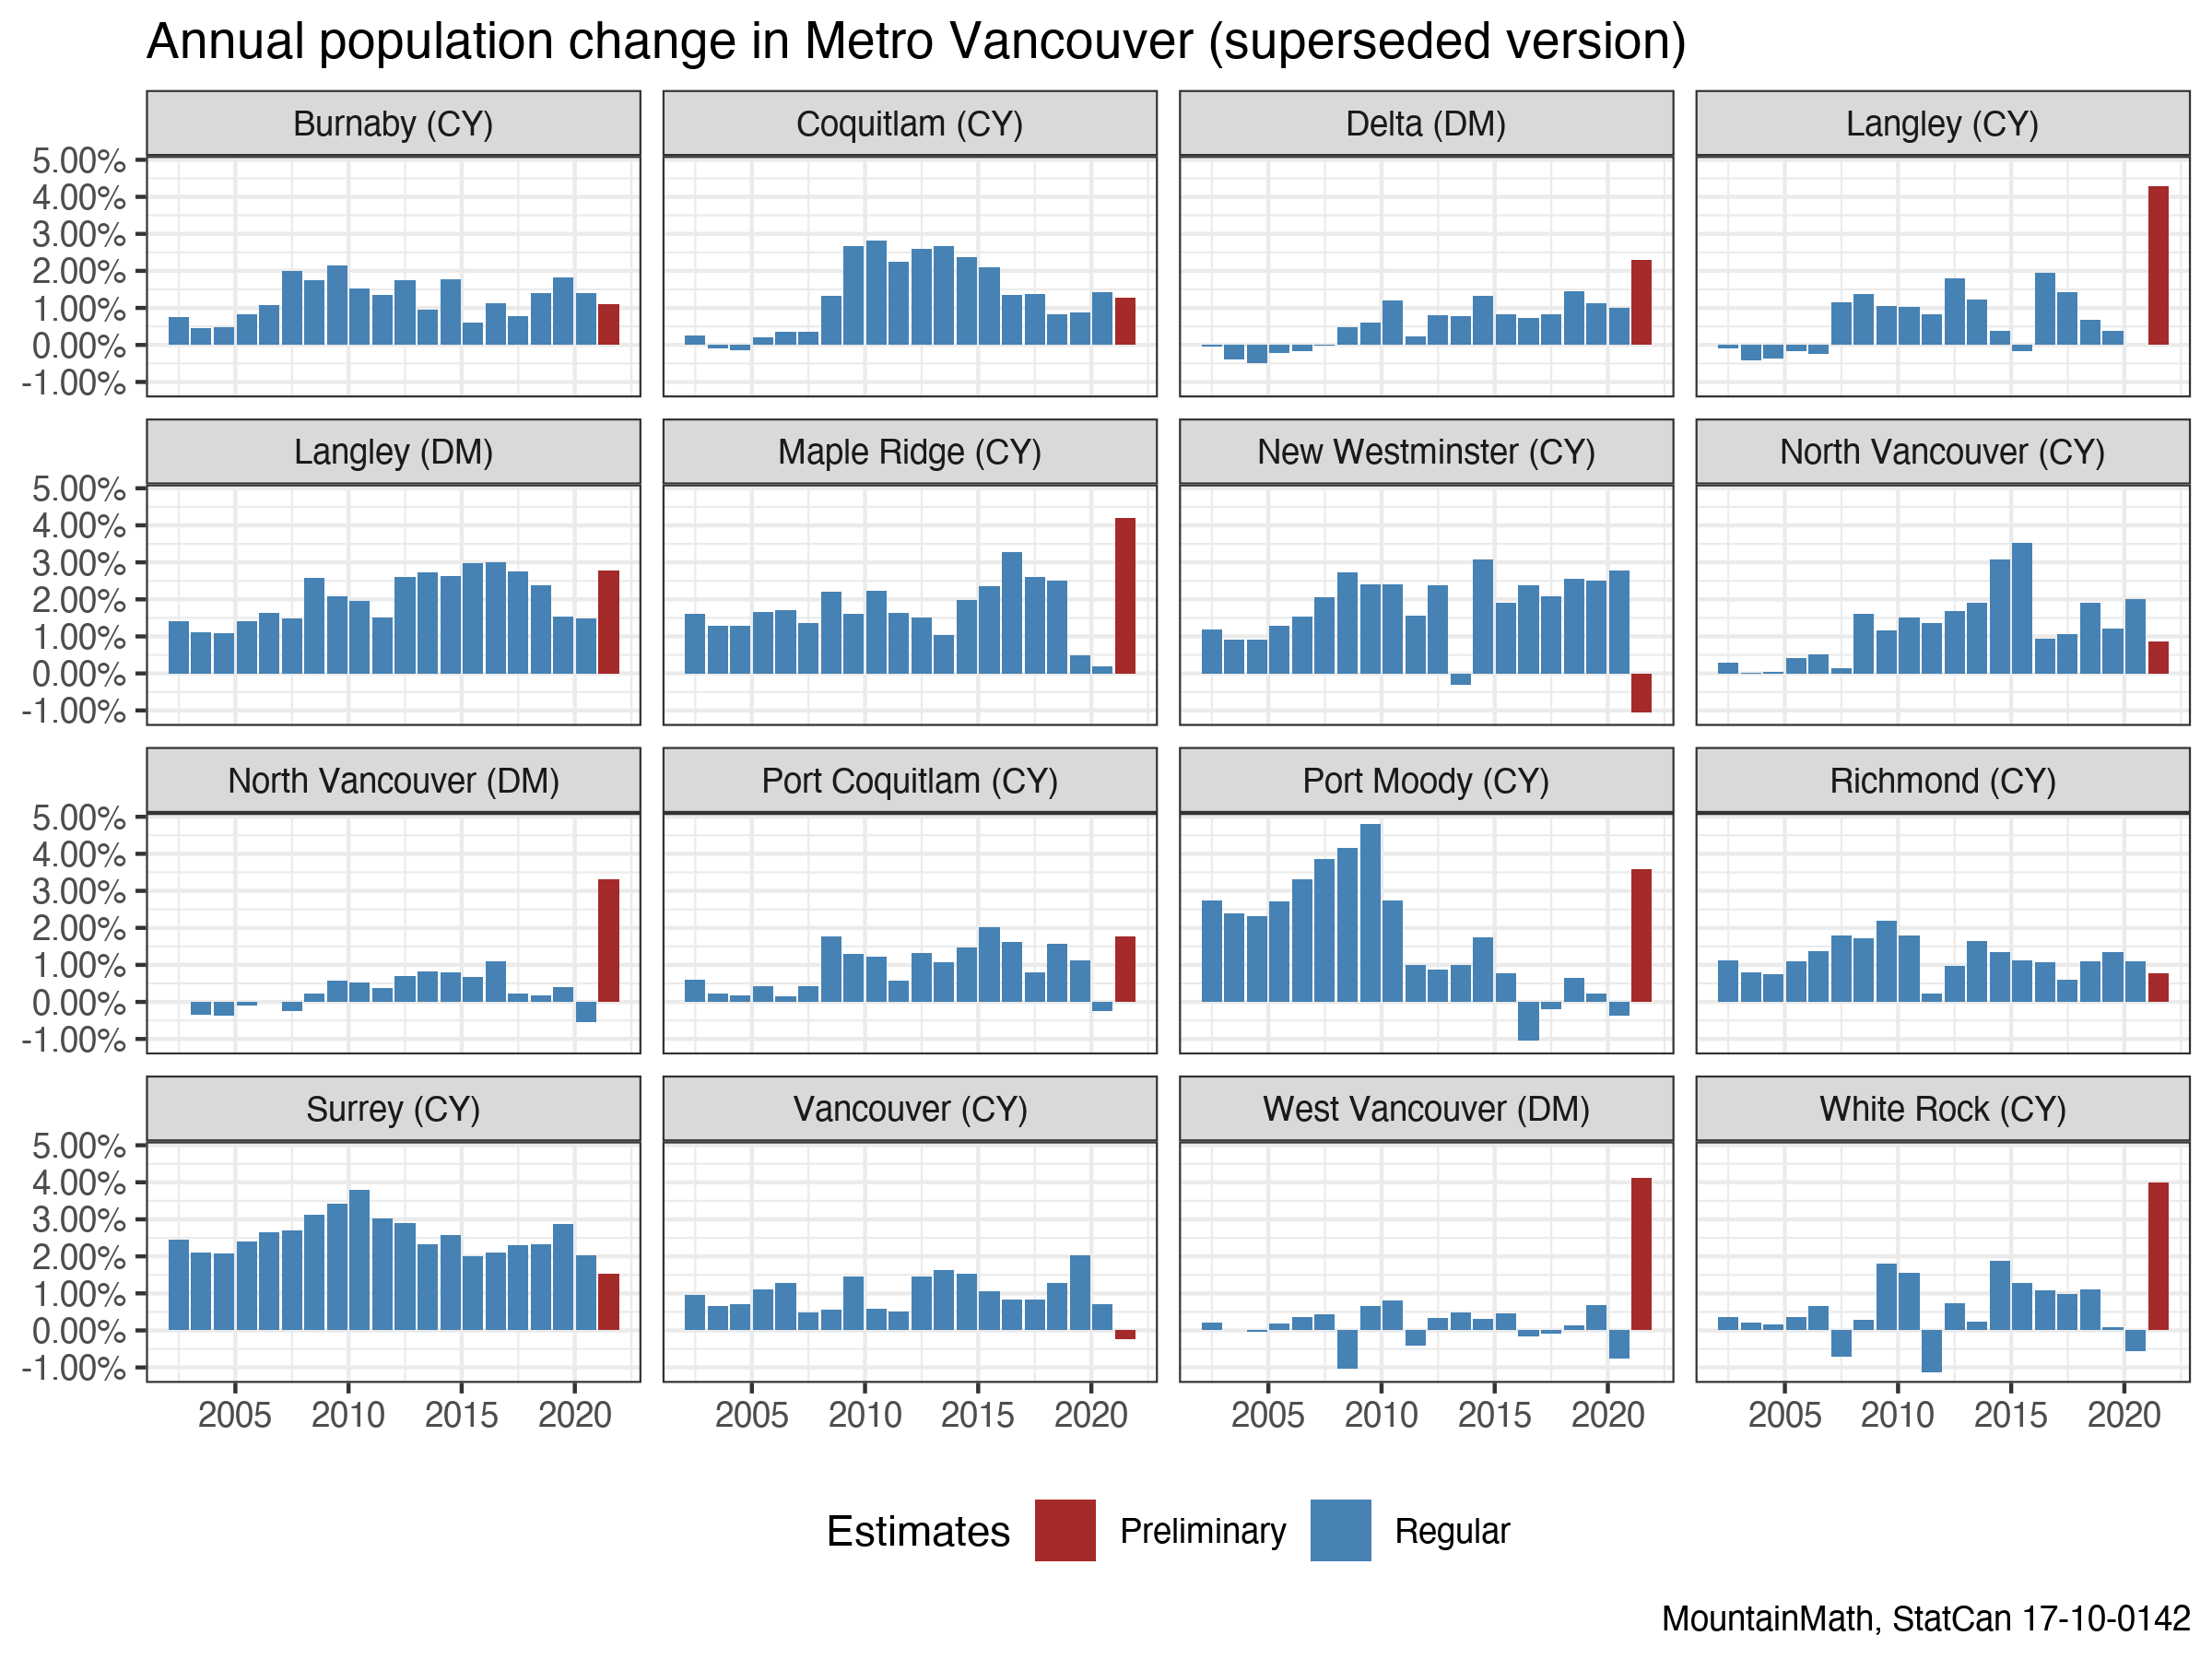
To better see how the population changes over the years we compute the year over year growth rate, essentially reverse-engineering the process used to derive the population estimates in the first place (i.e. looking at change in tax-filers).
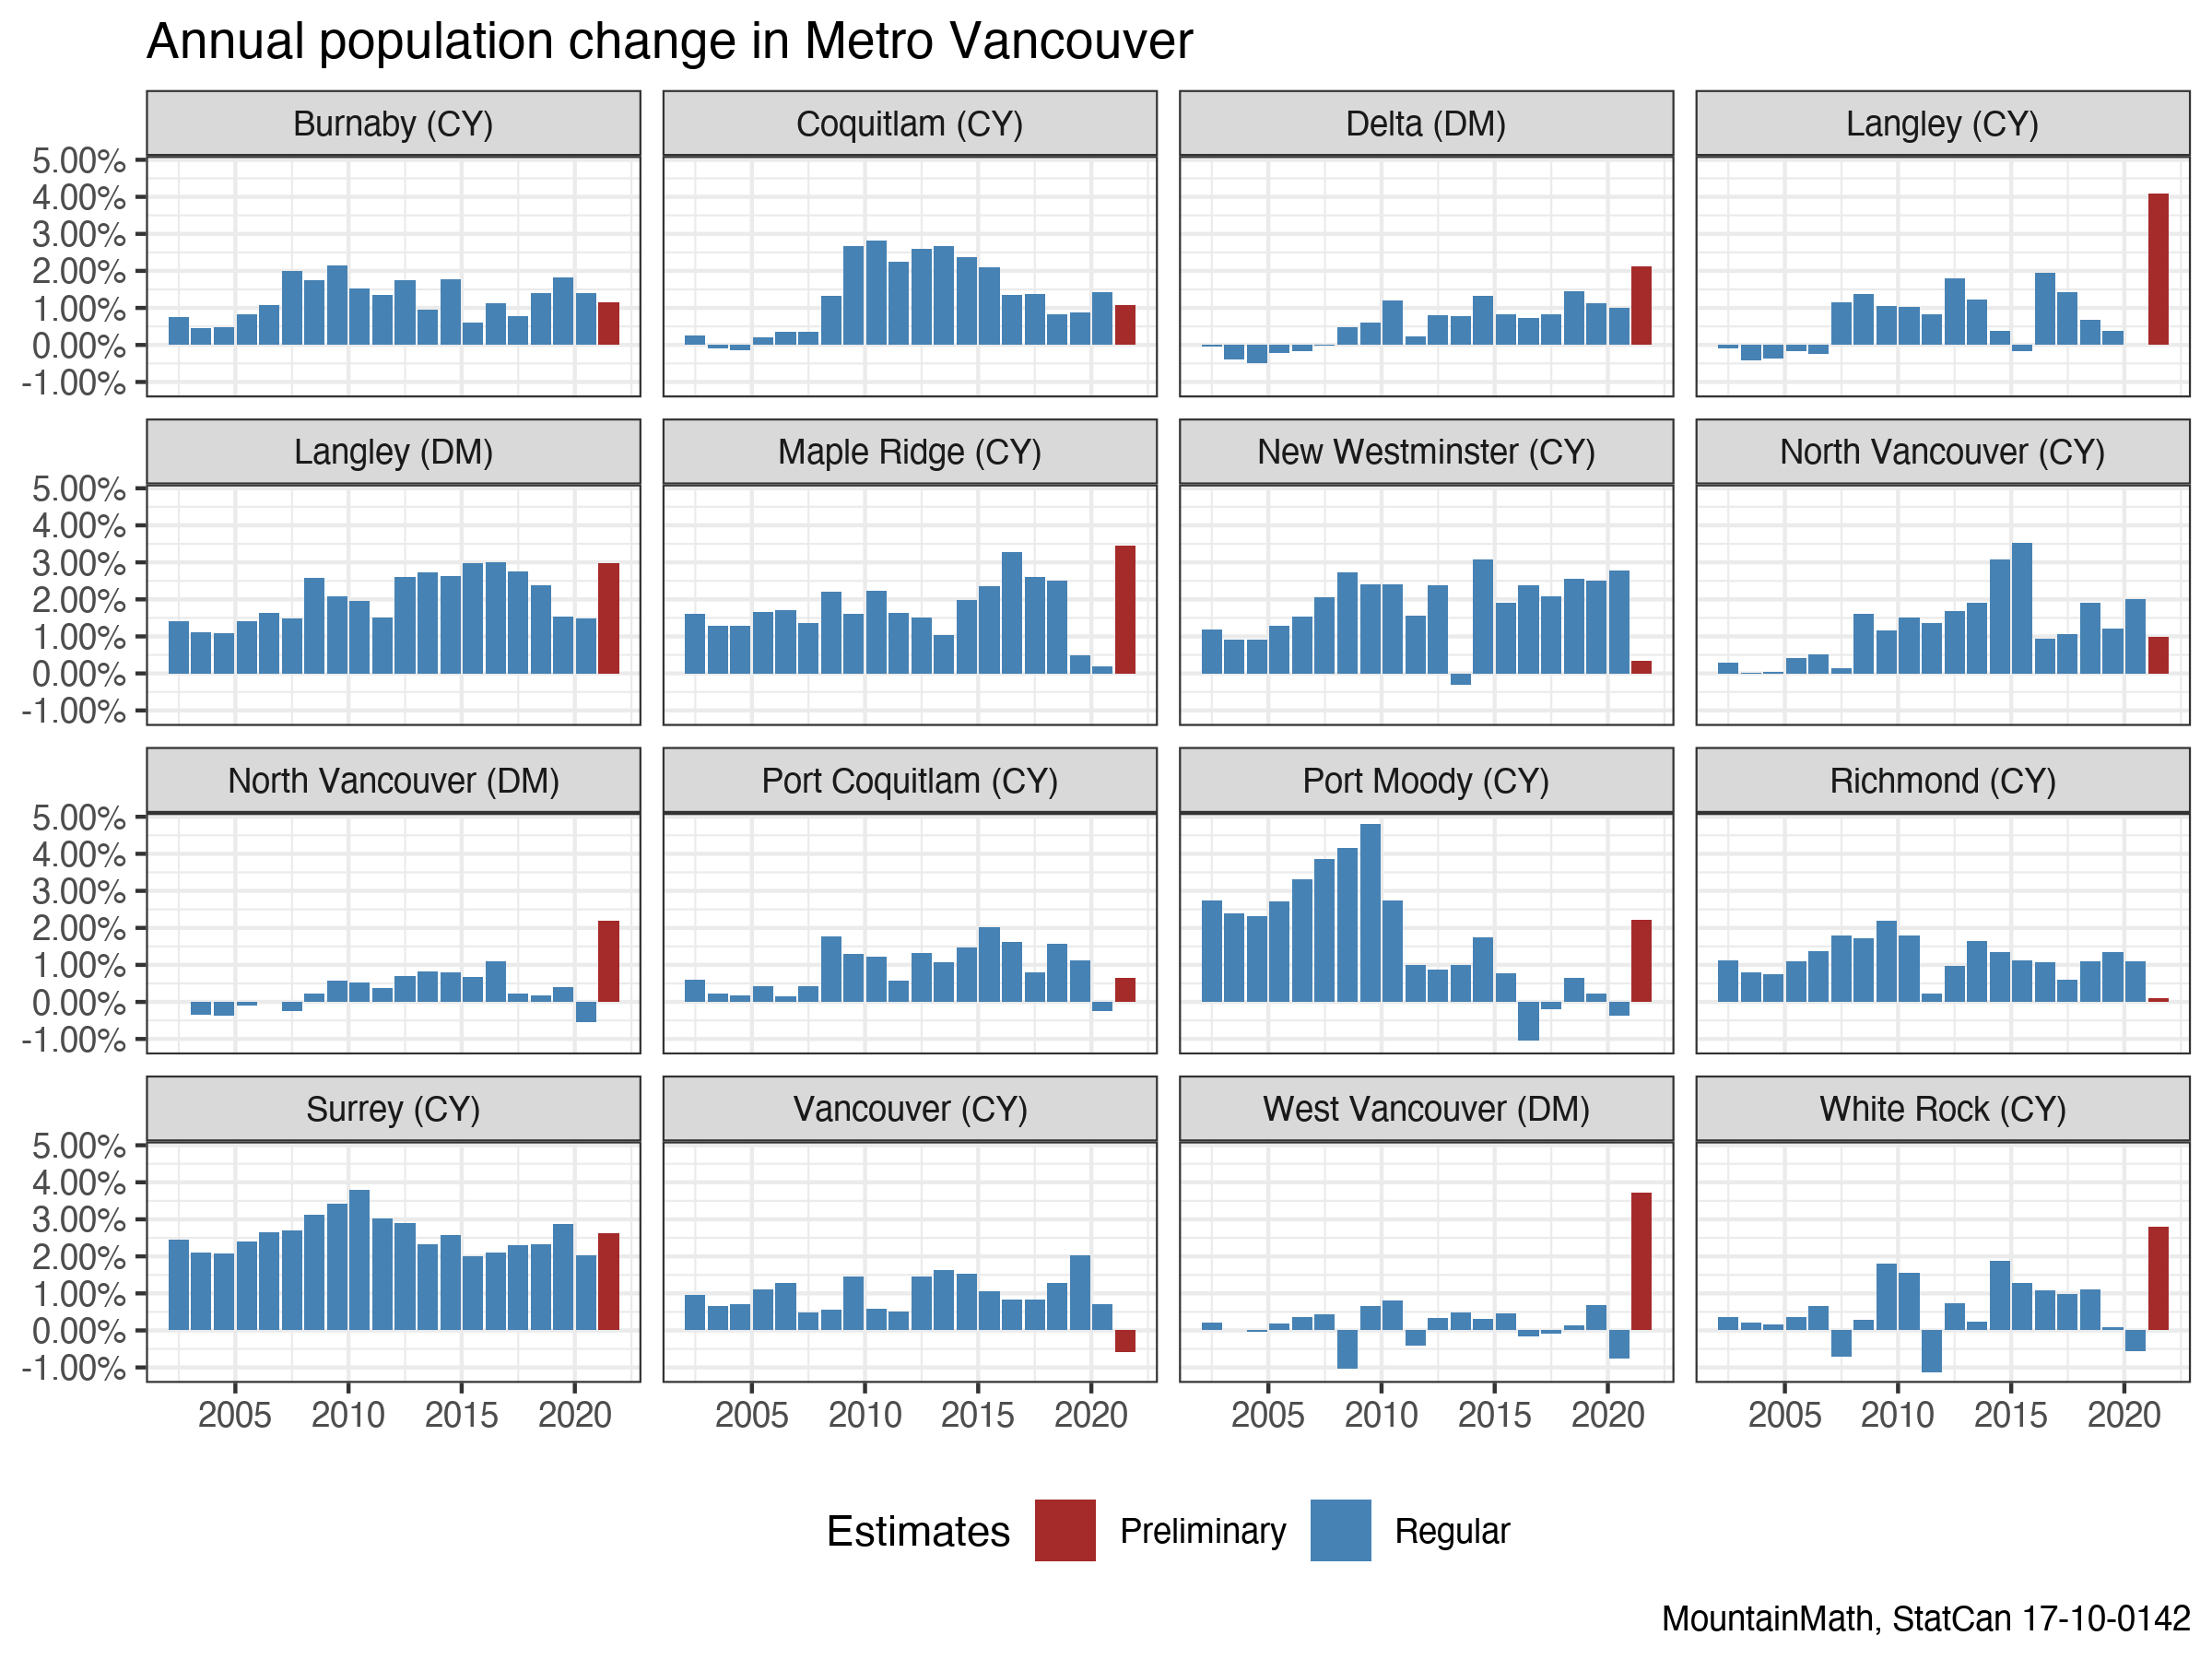
We see that for the most part population does indeed change slowly, we don’t see huge jumps year over year. However, the smaller municipalities do see rapid changes in population growth at various times. For example, Port Moody was growing fast until 2010, when the growth dropped and stayed relatively flat from 2015 on. This can be explained nicely with construction activity; completions dropped dramatically after 2009. Population growth goes where housing allows it to go.
The real outliers are the preliminary 2021 estimates, likely due to two reasons. First, the methods changed. Now we’re using preliminary T1 data instead of T1FF data to estimate the population change. And the other and possibly more important factor is the COVID-19 pandemic, the effects of which have not really been visible in the 2020 data. And the 2021 data is quite remarkable! City of Vancouver shows a population drop relative to 2020, while West Vancouver shows a strong increase!
At this point it is good to remember that the estimates are pegged to July 1st, but derived from tax data filed (mostly) earlier in the year (generally April 30th) based upon income and household situations for the previous year (ending December 31st). Extrapolating to July 1st works reasonably well in normal years that follow predictable patterns. But that assumption is questionable during COVID times, where lots of things changed. Universities being closed and students moving back in with parents, remote work giving people more freedoms where to reside, and other factors. Even people’s propensity to file their taxes may have changed! The 2020 T1FF data probably mostly captured what happened either pre-pandemic or during the initial more static phase of the pandemic, with the full effect hitting with the 2021 T1-derived estimates. But by July 2021 many things had already changed again. Universities were preparing for in-person classes, employers were calling people back to in-person work and immigration was ramping up again. All of that will be missed in the 2021 T1 data.
In short, preliminary estimates based on T1 filers suggest we’re seeing some pandemic effects, but it’s still hard to separate out the precise timing of when they occurred and how much they represent real effects versus methodological artifacts.
Is there other data we can look at?
Household estimates
On this blog we are often interested in the intersection of people and housing. What links those to together is households. Can we also estimate households? Yes, but not as well. The household economic accounts gives us rough estimates at the national and the provincial level derived from an interesting and complicated mix of reporting. Let’s take a look. In particular, let’s see if we can glean if anything has changed in our most recent data. In this case, our most recent data is for 2020 rather than 2021. But the 2020 household accounts data likely reflects the entirety of 2020, rather than a particular moment early in the year (as seems to be the case for the population estimates). As before, one general caveat with data in COVID times is that lots of things have changed. In particular we should expect survey response bias that is different from normal years, so everything should be taken with a grain of salt.
Before we get into this we need to take a closer look at what a household is. The answer of course is: It depends! In the census a household is simply defined as an occupied dwelling unit, which can further be divided into household types and give rise to an interesting variety of household types. For the household economic accounts a household is defined to conform with OECD standards as
either an individual person or a group of persons who live together under the same housing arrangement and who combine to provide themselves with food and possibly other essentials of living.
This is a refinement of the census household category, for example census roommate households aren’t OECD households unless they share food and possibly other essentials of living. Thus we expect the household estimate from the household economic accounts to be higher than census households. At the same time we expect the estimate of OECD households to be lower than the number of economic families and unattached individuals as e.g. derived from tax data. Those would count all individuals in roommate households as separate units, and also separate out other unrelated people living in the same dwelling unit.
With the basic definition cleared up, let’s look at the data. Estimates come mostly at the national level, with provincial breakdowns for household estimates. Before jumping into details let’s see how it fairs against census household counts and economic families and unattached individuals from T1FF data as a cross-check.
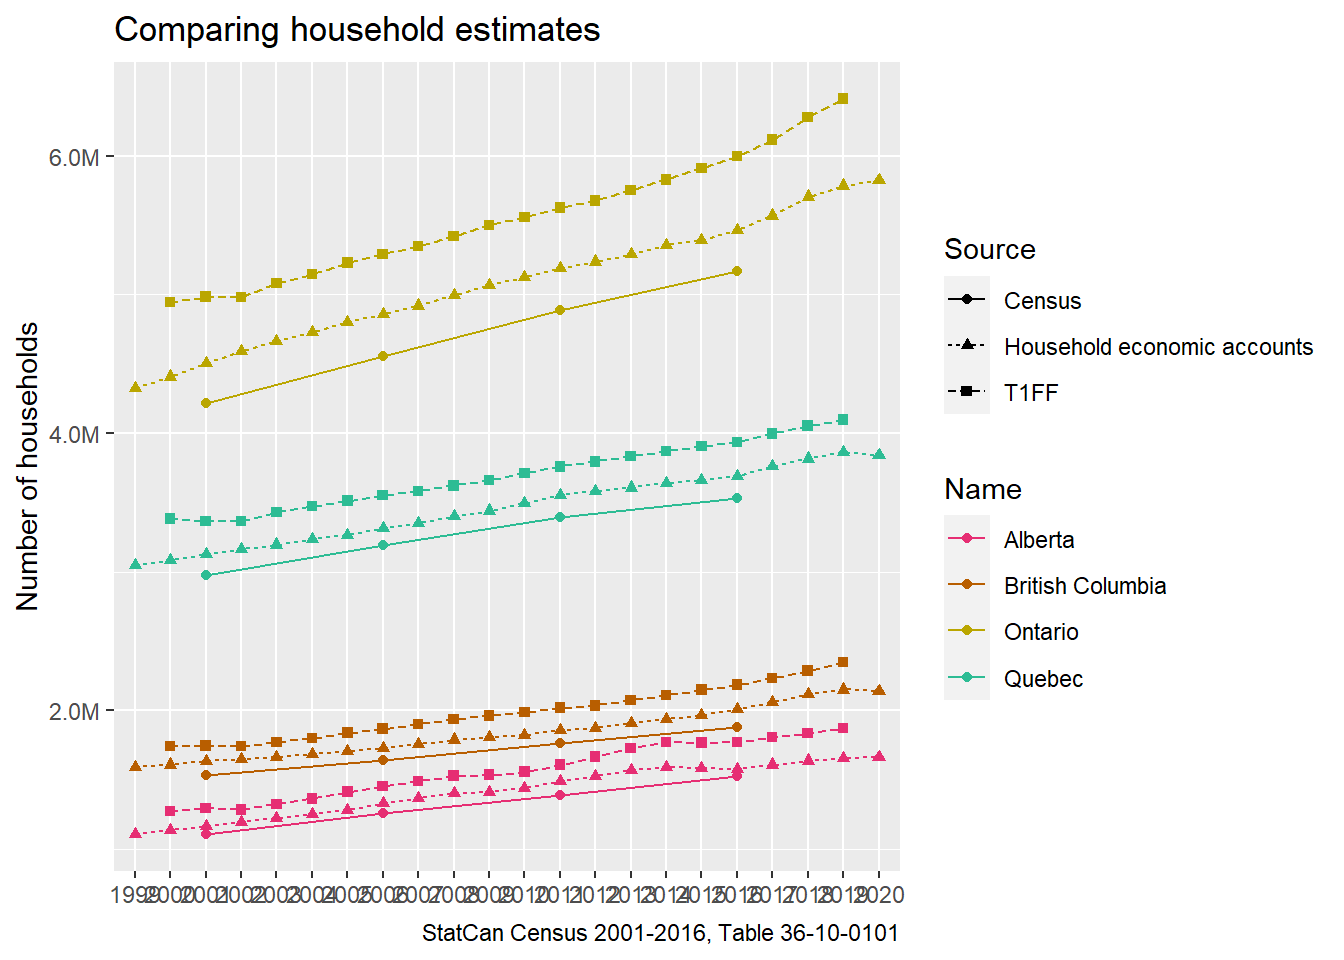
As expected, the households economic accounts estimate of OECD households falls between the census household estimates and the number of economic families and unattached individuals. Eyeballing it the growth rates are quite similar, which allows us to use the growth rate of one of these concepts as a proxy for the other. Let’s check how close the growth rates are when aggregated over the inter-census periods.

The correspondence is relatively good overall, with Alberta showing the largest divergence. We have at least some confidence that the concepts and estimations are fairly interchangeable when looking at growth rates. Knowing that, let’s take a more detailed look at the year over year growth rates of households from the household economic accounts.
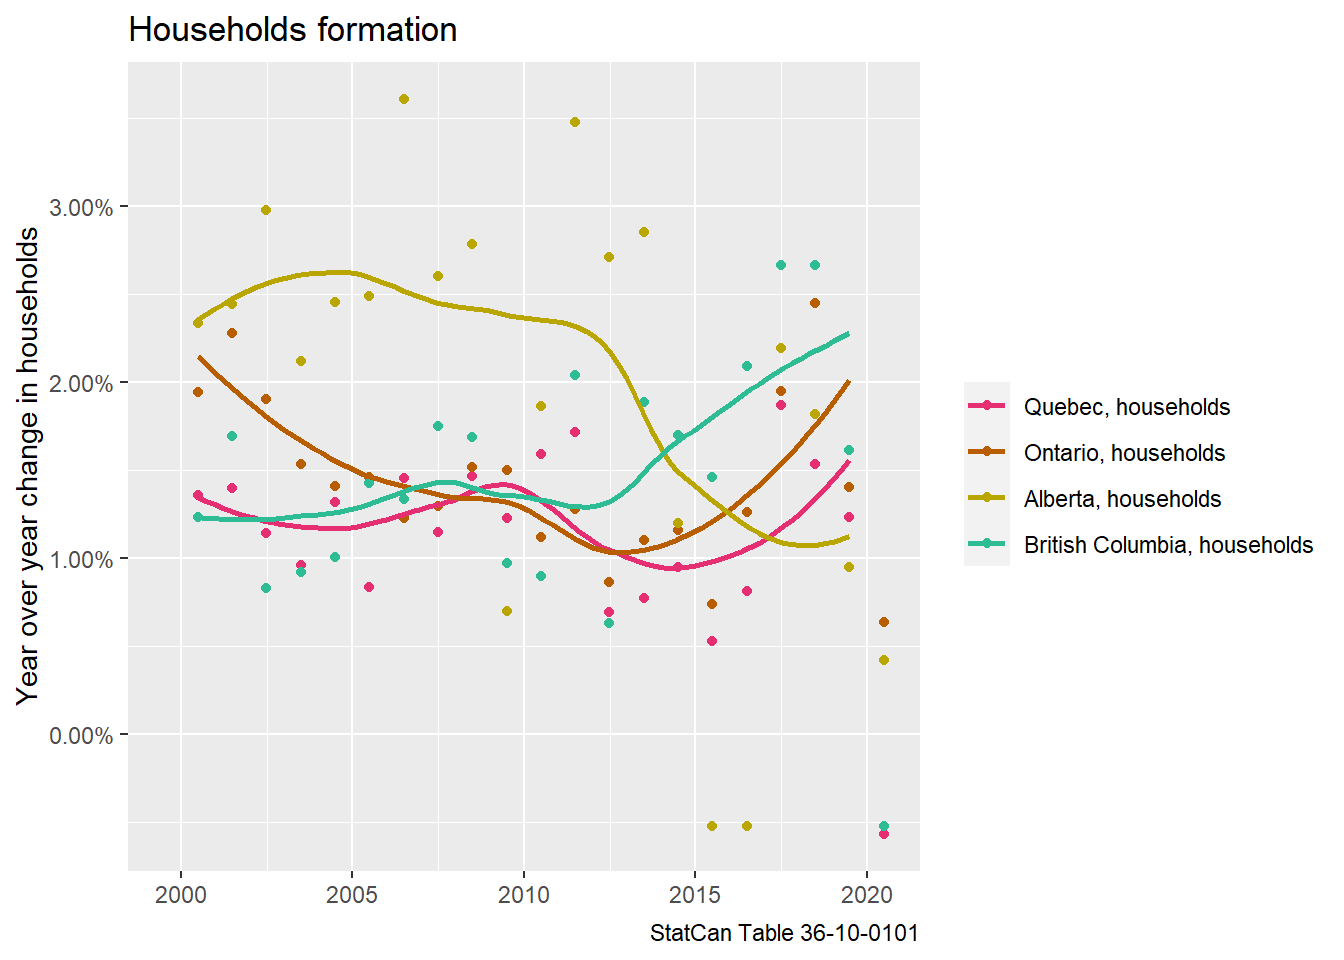
There is quite a bit of variation in the data, probably at least partially due to noise in the survey. But generally the growth rates of households does align with census estimates, even if the level can be off by a bit. We added a trend line to smooth out some of that, and deliberately removed the last data point for 2020.
The 2020 data point is dramatically lower for all provinces, and almost certainly due to COVID. Part of it may well be a change in survey response behaviour, but at least a good portion is likely real, due to net outflow of non-permanent resident workers and students, as well as students moving back in with parents or other mechanisms resulting in lower households, like singles coupling up and moving in together. This matches with observations including increased slack in the rental market, stats about lower NPRs, as well as anecdotal evidence of students moving back in with parents.
Some of these effects will likely be temporary, and the rental market has tightened up again as immigration and in-migration of non-permanent residents has returned and Universities are back to in-person teaching. But some effects may prove sticky. It will be interesting to watch how the timeline continues for the next couple of years.
We can also take a look at how, across Canada, households have changed by generation status of major income earner (as defined by Statistics Canada, with Gen X born between 1965 and 1980, and millennials thereafter).
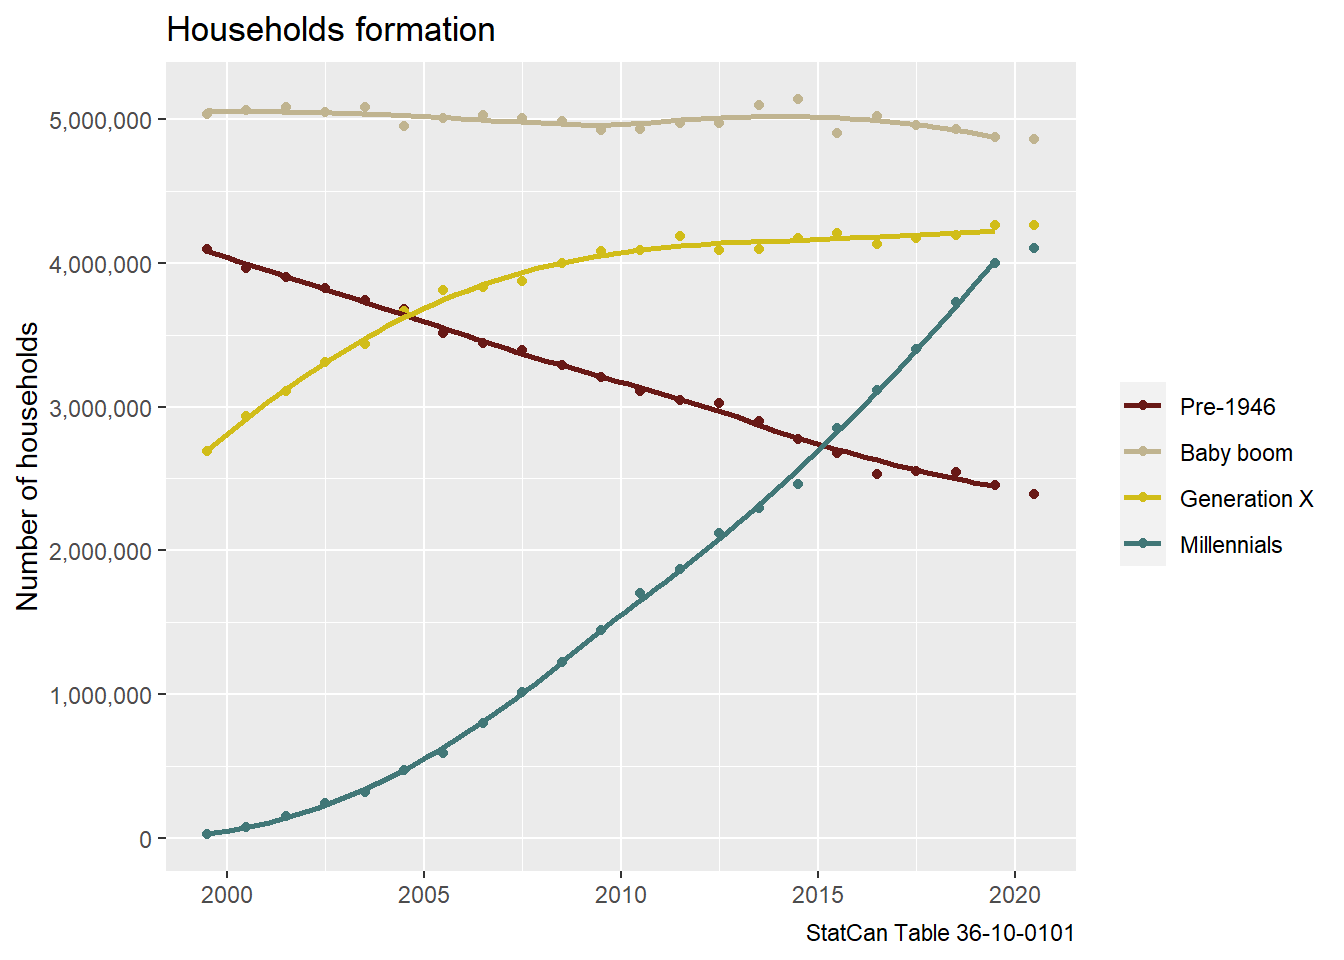
The 2020 data points looks roughly in line for all generations except the Millennial generation. Here the Millennial generation also contains a small number of younger people that aren’t broken out separately. To judge if the 2020 data point is an anomaly or just a sign of the millennial generation peaking, just like Generation X did, we can fold in population data and convert this to household maintainer rates.
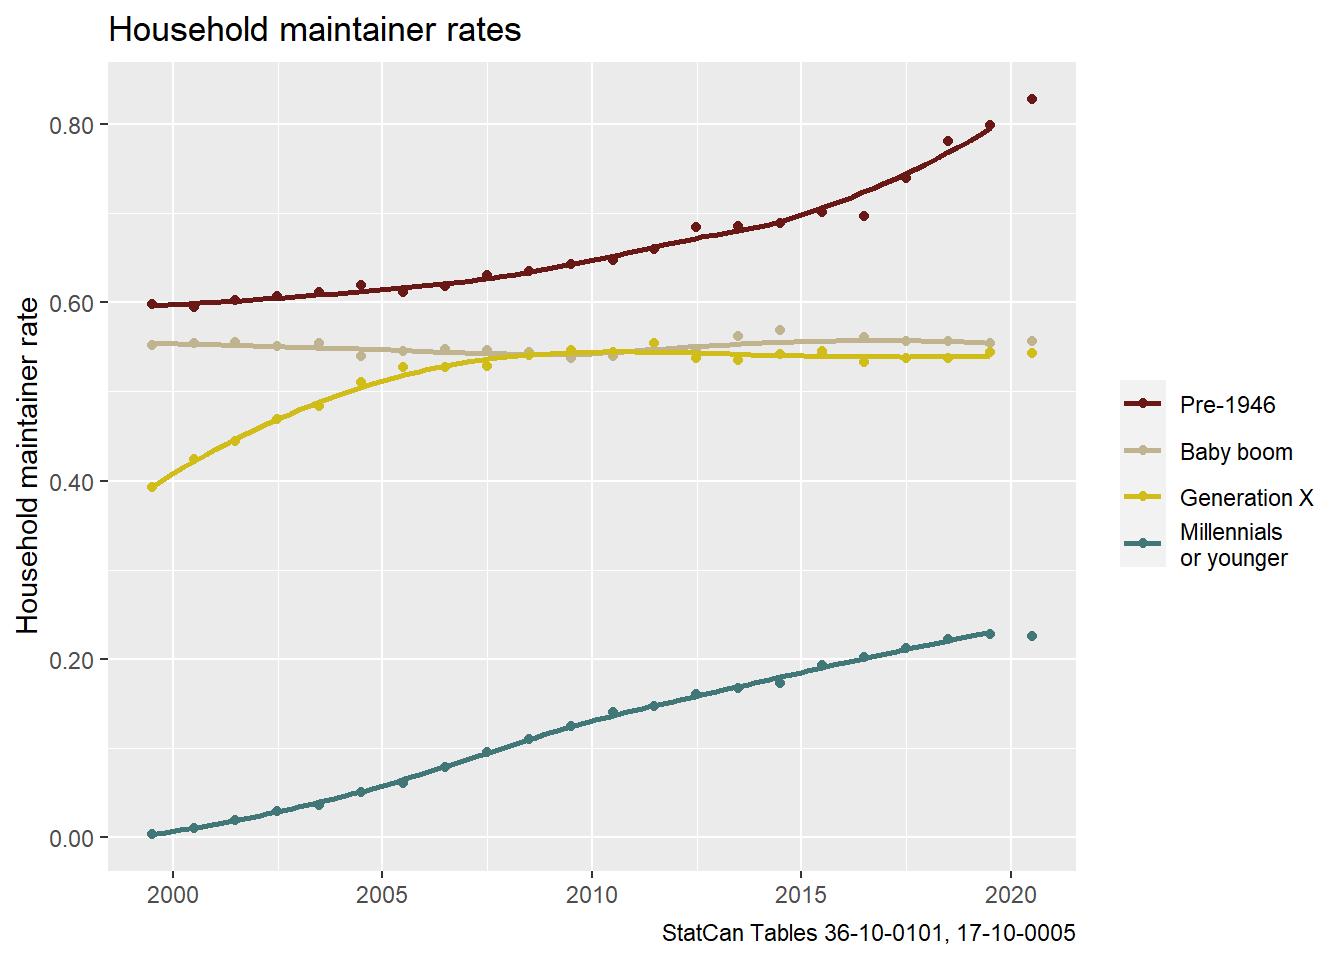
This suggests that household maintainer rates for Millennials (or younger) actually dropped a bit in 2020, which is consistent with the narrative of millennials moving back in with parents, but also an outflow of the non-permanent resident population which skews younger.
We can also check on changes in household size by separating out single and multiple person households.

Multi-person households have continued to grow, whereas the number of single-person actually dropped significantly, below 2018 levels, again consistent with interpretations above.
Lastly we can look at households by tenure.
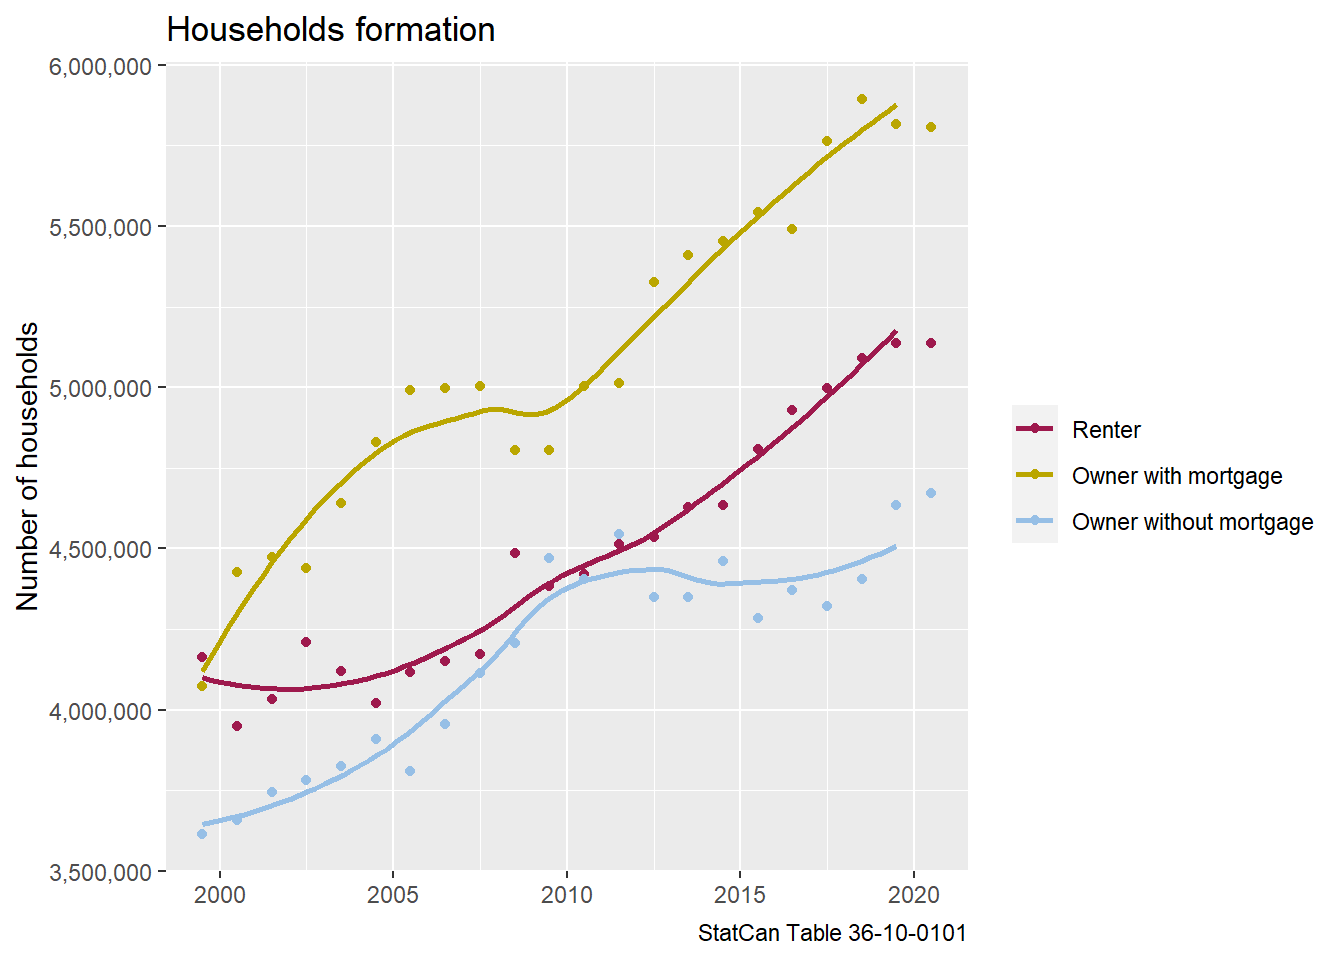
Renter households have roughly flatlined over the past year, whereas owner households have grown. But we do see a shift from owner households with mortgage to owner households without a mortgage. However, the data looks quite volatile and we should be careful not to over-interpret these one-year shifts.
The Rental Market
Let’s circle back to the rental market. Did it provide a foreshadowing of what we’re now observing with population data? We got our first systematic look at the pandemic rental market back in January of 2021, based on the results of CMHC’s annual Rental Market Survey in the field in October of 2020. By October we already saw a dramatic rise in rental vacancy rates within major Metro Areas. And the rise was most pronounced within central cities.

Here we see the vacancy rate rises corresponding to population loss within central cities and young adults moving back home. In effect, it certainly looks like our rental market data was the first data in suggesting the population and household data that would arrive much later in 2021. The next round of rental market data should be coming out early in 2022, and should give us a foretaste of where we’re heading population-wise. At the same time, vacancy rates can rise due to population loss and household consolidation (as we saw in 2020) or due to increases in rental stock, which we’re hoping to see in years to come as new construction comes on-line.
Takeaway
Again, the takeaway here is suggestive of notable pandemic-related changes in population and population distribution, both geographically and within households. A consistent theme emerging is that many young adults likely moved back home during the early days of the pandemic, as seemingly reflected in preliminary population data for municipalities in 2021; and household data and rental market data for 2020. That these, our most recent data points in each case, seem to converge is useful and interesting. But that the convergence comes attached to slightly different chronologies is also notable. The question remains how much has already changed since our most recent estimates. And there we just don’t know, and probably won’t know for a little while longer. But we’ll be paying close attention to rental market data when it comes out. As we’ve noted before, those vacancy rates are a really useful metric!
Appendix
We make the effort to make our analysis transparent, reproducible and highly adaptable by publishing the code. For example, someone interested in repeating parts of the analysis for a different region can simple download the code and change a line or two to point it to their region of interest. However, there are still barriers to actually doing this, from having an R installation or the rudimentary familiarity with R required to make the necessary tweaks. So we have resolved to start adding some graphs in appendices that offer a view into other relevant regions, if appropriate.
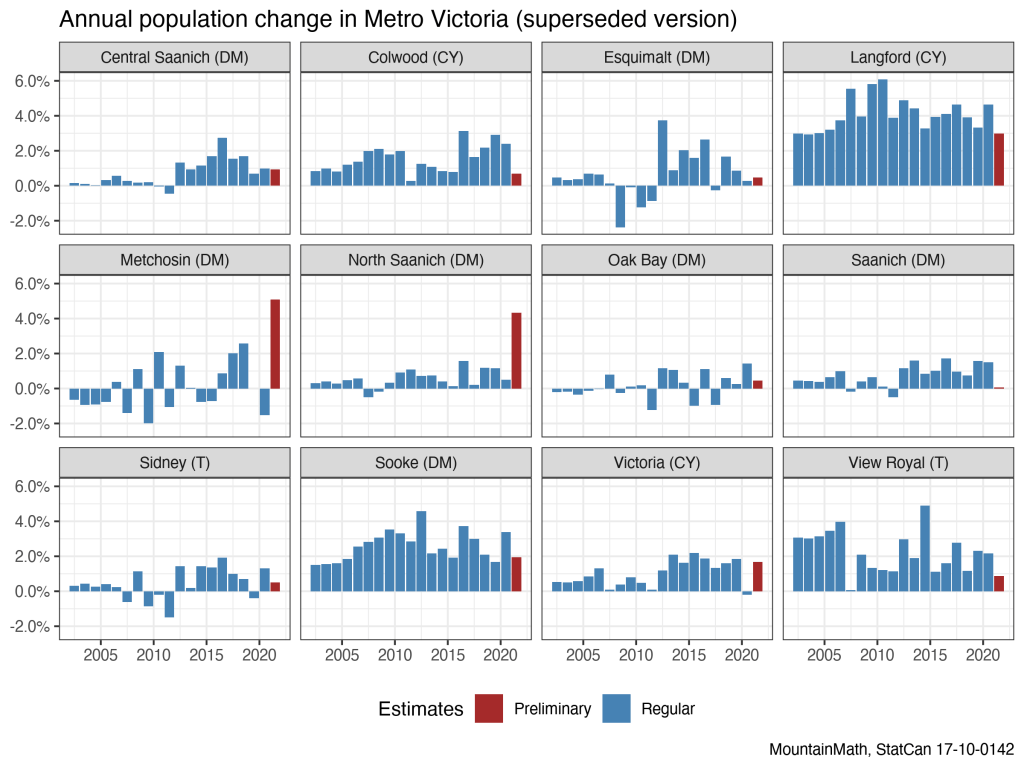
For this post, looking at Metro Victoria population growth estimates and preliminary 2021 population growth offers another useful view. (StatCan only released preliminary population estimates for BC, but not for other provinces.)
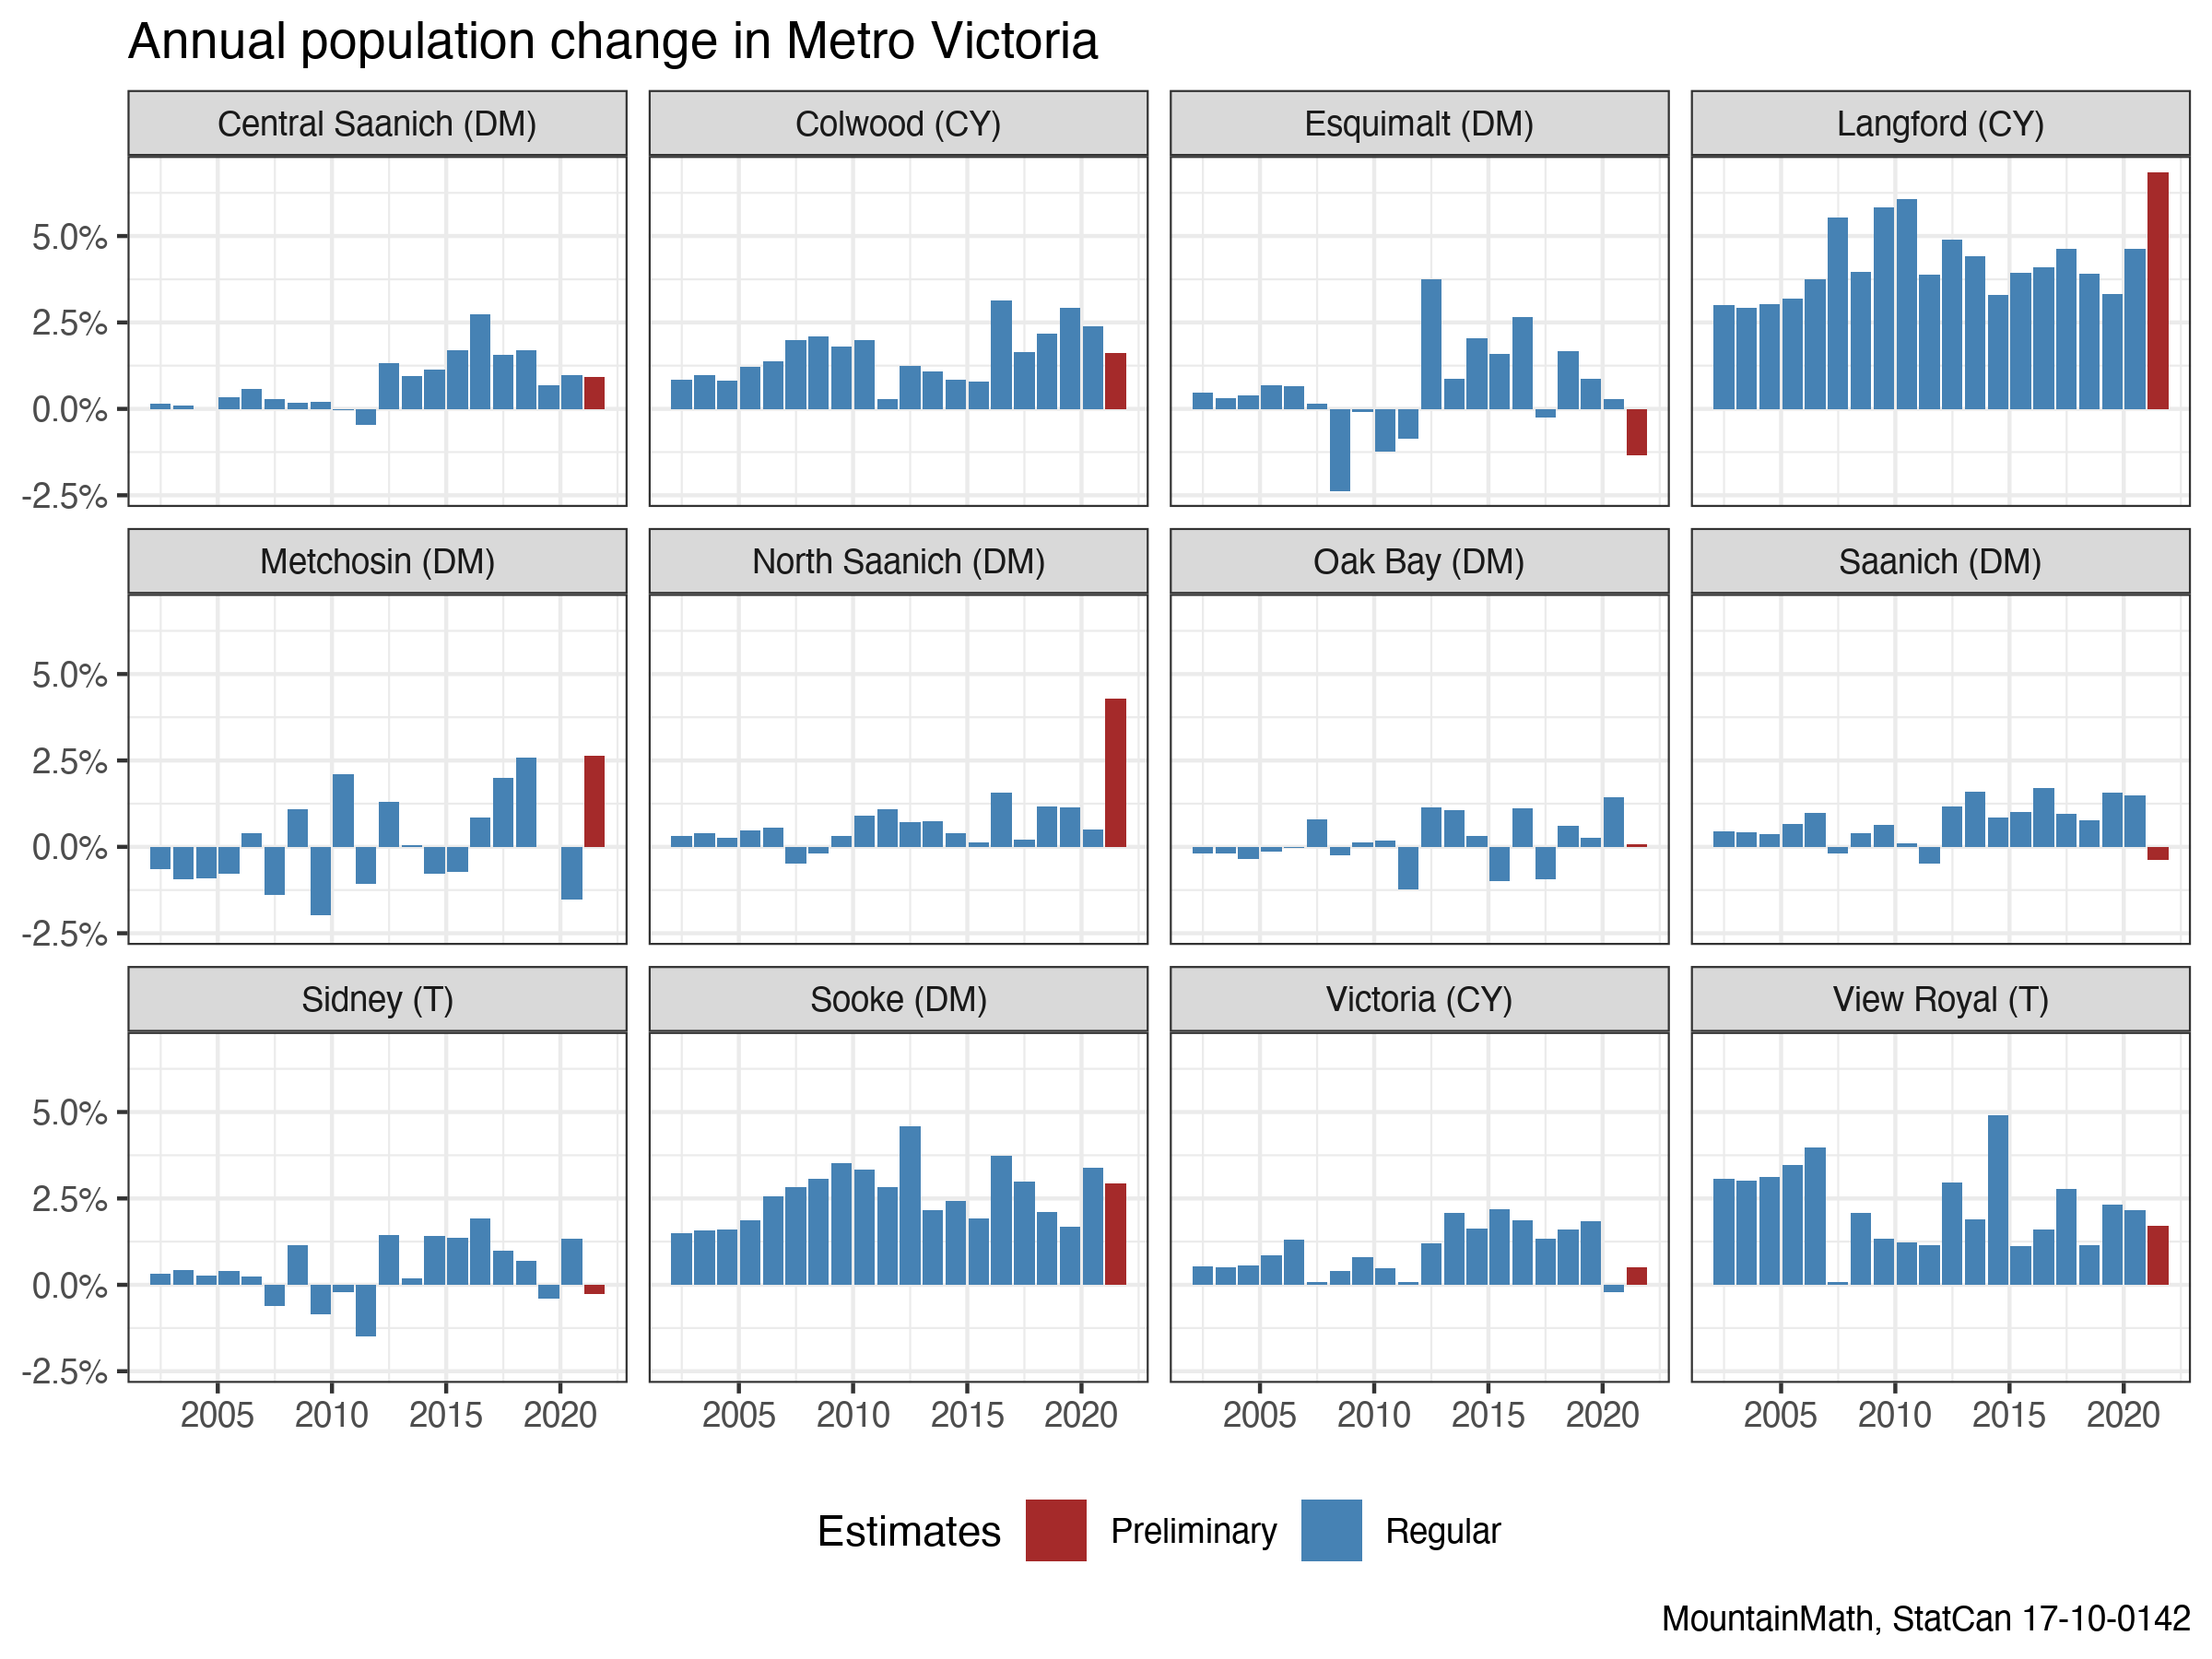
Here we see and interesting pattern for the central city, Victoria, that looks different from Vancouver. Victoria shows a decline in population in 2020, followed by an increase in 2021, whereas the situation in Vancouver was reversed. This speaks further to the diversity of changes during COVID times, but likely also to the difficulty of measuring this. Victoria’s population skews older than the population in the City of Vancouver, which has a higher share of non-permanent residents, and a higher share of recent immigrants, all factors that we would expect to shape the impact of COVID on population growth.
Update (2021-11-29)
The day after we published this post StatCan revised their 2021 preliminary population estimates for BC, one more indication that these stats need to be treated carefully. This data release was produced to aid emergency response efforts of the BC flooding, and produced with very short lead time. It is good to see StatCan rising to the challenge and push their analysis methods to meet needs like this,
We have replaced data underlying the graphs above with the updated estimates, for comparison and increased transparency we include the original (and now outdated) graphs based on the first round of released data below.