BC has introduced the Speculation and Vacancy Tax and instructions for filling out the declarations are in the mail. The tax targets homes in major urban centres that are left empty, or that are owned by “foreign and domestic speculators” that “don’t pay [income] taxes” in BC. The tax rate is 0.5% of the assessed value in 2018. From 2019 onward rates increase to 2% for foreigners (not permanent residents nor Canadian citizens) as well as citizens or permanent residents that are deemed members of “satellite families.” A “satellite family” is defined as a family – combining spousal incomes – where less than 50% of total worldwide income is declared (and taxed) in Canada.The portion targeting empty homes follows along similar lines as the City of Vancouver Empty Homes tax, with similar exemptions. Homes are generally exempt from the tax when owner-occupied or rented out for at least half of the year. Importantly, foreign and satellite family owners face additional burdens in renting out homes. Tenants must either be arm’s length, meaning they have no special relationship with the landlord, or, if non-arm’s length, they must be permanent residents or Canadian citizens with Canadian income at last three times the annual fair market value of the rent for the entire residential property.
The tax has been reported to affect about 32,000 homes, about 20,000 of which will be British Columbians with the remaining 12,000 foreigners or residents of other provinces, and generate around $200M in revenue. Unfortunately the province has not shared a more detailed breakdown of how many homes are in each of the category the tax targets, the empty homes, the foreign owners, or the satellite families.
Like everyone, we’re curious how it’s all going to work! Here we want to try and put out some preliminary guesses as to how many a) empty homes and b) foreign owners might get taxed. We also want to think a bit more about satellite families and imagine how possible consumption audits might work. This enables us to make some educated guesses about c) the population at risk of being audited. Surely some of those audited will either have to pay the speculation tax or end up referred for income tax avoidance. Others will have ready explanations for why their property holdings fail to match their reported incomes, likely explaining their lifestyles as products of income volatility or legal gifts (falling beyond combined spousal income). Finally, we want to address the possibility of better rental income reporting as a result of the Speculation and Vacancy Tax. Might there be even more d) revenue gained from better reporting rental income relative to direct Speculation and Vacancy tax revenue? Let’s find out!
TLDR:
We’re guessing from various sources detailed below that the BC Speculation and Vacancy Tax will identify about 8,800 properties as vacant and subject to the tax (i.e. not exempt). An overlapping 46,000 properties owned by “foreign” owners may be subject to the tax if they don’t secure qualifying tenants for their properties. Another overlapping 45,000 households may be at risk of being identified (or audited) as satellite families, mostly living in pricey single-family detached (or suited) dwellings. Around a third of these households will be headed by Canadian-born residents, and investor class immigrants will likely end up overrepresented within immigrant households at risk of being ID’d as satellite families. Metro Vancouver will be most affected by the tax. The collection of income and property value data together with the registration of tenants in rented properties will potentially bring in more revenue indirectly, by increasing compliance with reporting of rental income and reducing tax avoidance/evasion more broadly, than by direct payment of the Speculation and Vacancy Tax.
Empty homes
How many empty homes will the tax effect? Empty homes are hard to estimate. The City of Vancouver commissioned a study based on BC Hydro data to estimate the number of empty homes in the city in a similar manner to how the tax applies, coming up with 10,800 to 13,500 empty homes in the city. In the first year, 2,538 properties were subject to the tax (roughly half declared themselves so with the rest failing an audit or failing to file or appeal). Another 5,385 were declared exempt (some of the exempt properties were not in the universe of the Ecotagious study). It is unclear how much of the difference is due to previously empty homes getting occupied or evasion. It is difficult to use this to estimate the total number of empty homes affected by the speculation tax, but one very rough estimate would be to take the number homes unoccupied on census day and scale the numbers down by a factor 8.6, roughly the ratio of the 21,820 homes unoccupied on census day in the City of Vancouver to 2,538 empty homes paying the empty homes tax.
Overall there were 75,870 dwelling units that were unoccupied on census day in the regions where the Speculation and Vacancy Tax applies. If we use the Ecotageous study for the City of Vancouver as a guide, we would expect 41,725 empty properties using the definitions from the Speculation Tax, and 8,825 properties that will pay the tax. This might be a low-ball, given that the province has more effective means in checking for evaders entering into “fake rental” agreements and that the tax rate is lower (for the first year, and for permanent residents and Canadian citizens that make up the bulk of the affected owners in the years after) than in the City of Vancouver, and that the tax can be offset against BC income taxes, potentially inducing fewer people to sell or rent out their property in response to the tax.
Foreign owners
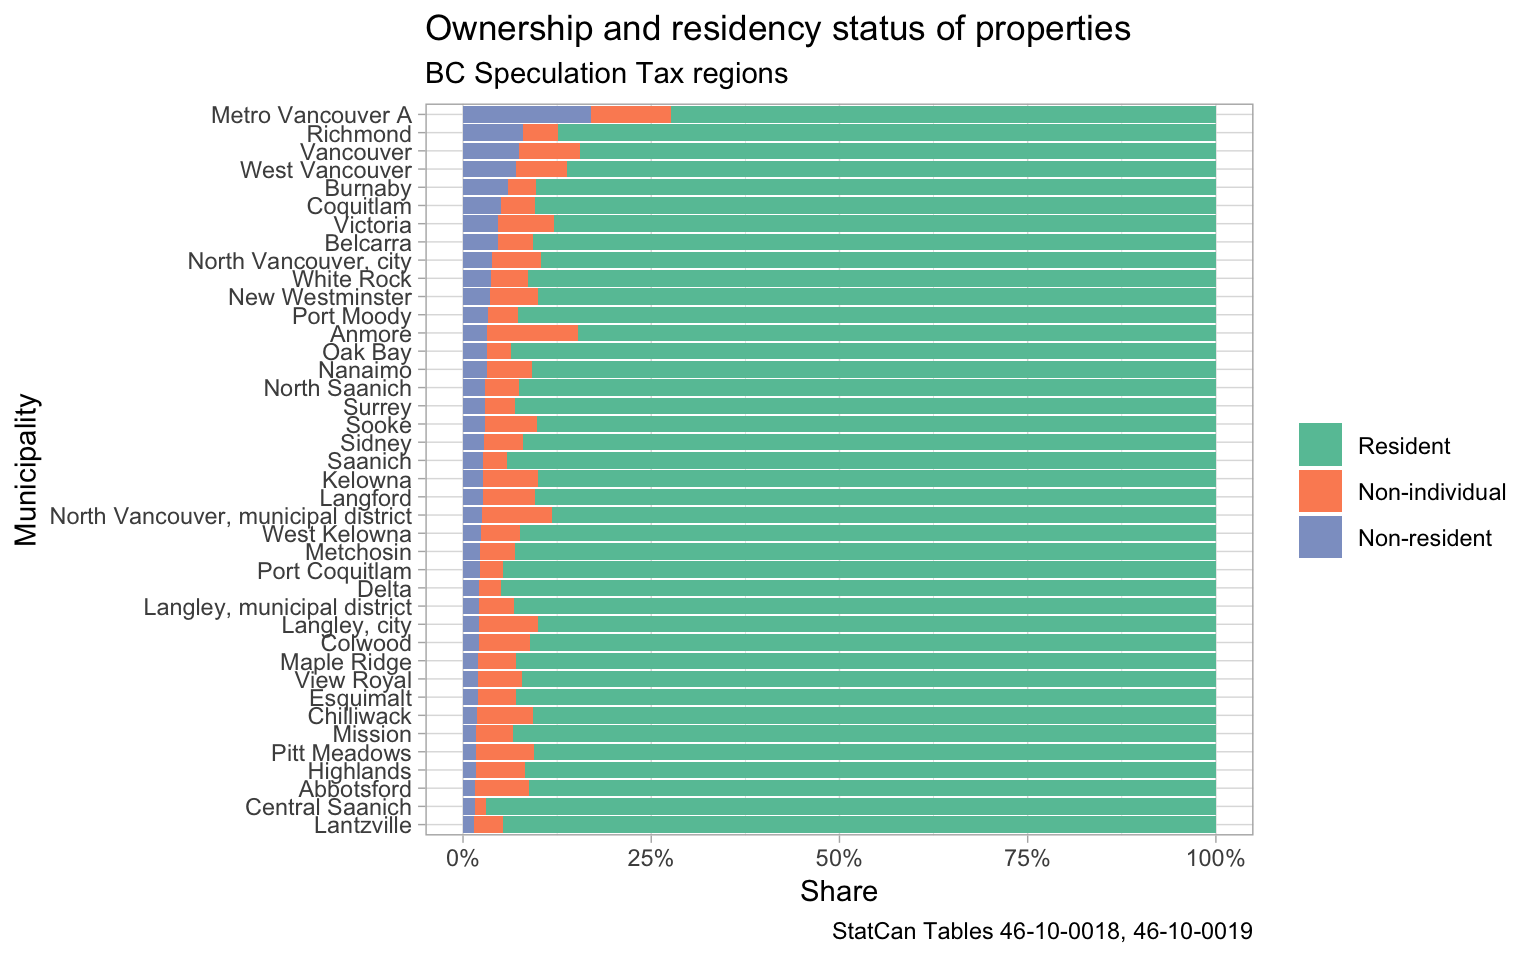
How many foreign owners will the tax affect? Foreign owners are defined as those owning property without being a citizen or permanent resident in Canada. Keep in mind that foreign owners won’t face any speculation tax so long as they rent out their properties to an arm’s length tenant or so long as the deal seems plausible for a non-arm’s length tenant (right now 37.7% of all secondary market renters in the regions affected wouldn’t meet the specified plausibility requirements, but that’s mostly due to their income being too low and that doesn’t matter for arm’s length tenants). Only if the foreign owner themselves occupies the property, leaves it empty, or keeps family members (like children) housed upon the property will they face the tax.
Ever since instituting the Foreign Buyer Tax in 2016, BC has been tracking data on how many purchases are made by foreign buyers. But for a variety of reasons, this kind of transaction data is a poor reflection of the number of foreign owners at any given point in time. Statistics Canada has sought to better collect data on foreign property ownership through its CHSP program, but the definitions differ from tax policy definitions. For CHSP purposes, it’s the primary residence of owners that matters rather than citizenship or permanent residence status – in other words, do owners live at foreign addresses or Canadian addresses? Some people with overseas primary residences will have Canadian permanent residence or citizenship. Some people with primary residence in Canada will not have Canadian permanent residence or citizenship (this status, for example, covered both authors of this blog post when they first moved to Canada). While imperfect, the measure of primary residence probably isn’t a terrible proxy for who will face taxation.
Extrapolating from the CHSP data for the region covered by the Speculation and Vacancy Tax suggests that 46,110 “foreign” owned properties might face the tax, in addition to the relatively small number of foreign individuals likely registering their properties through corporate ownership. It’s important to remember that there may be a significant overlap between the empty properties we looked at above and the properties of non-resident owners likely to face the tax, so these are non-exclusive categories. But we don’t yet have any good data on the degree of overlap.
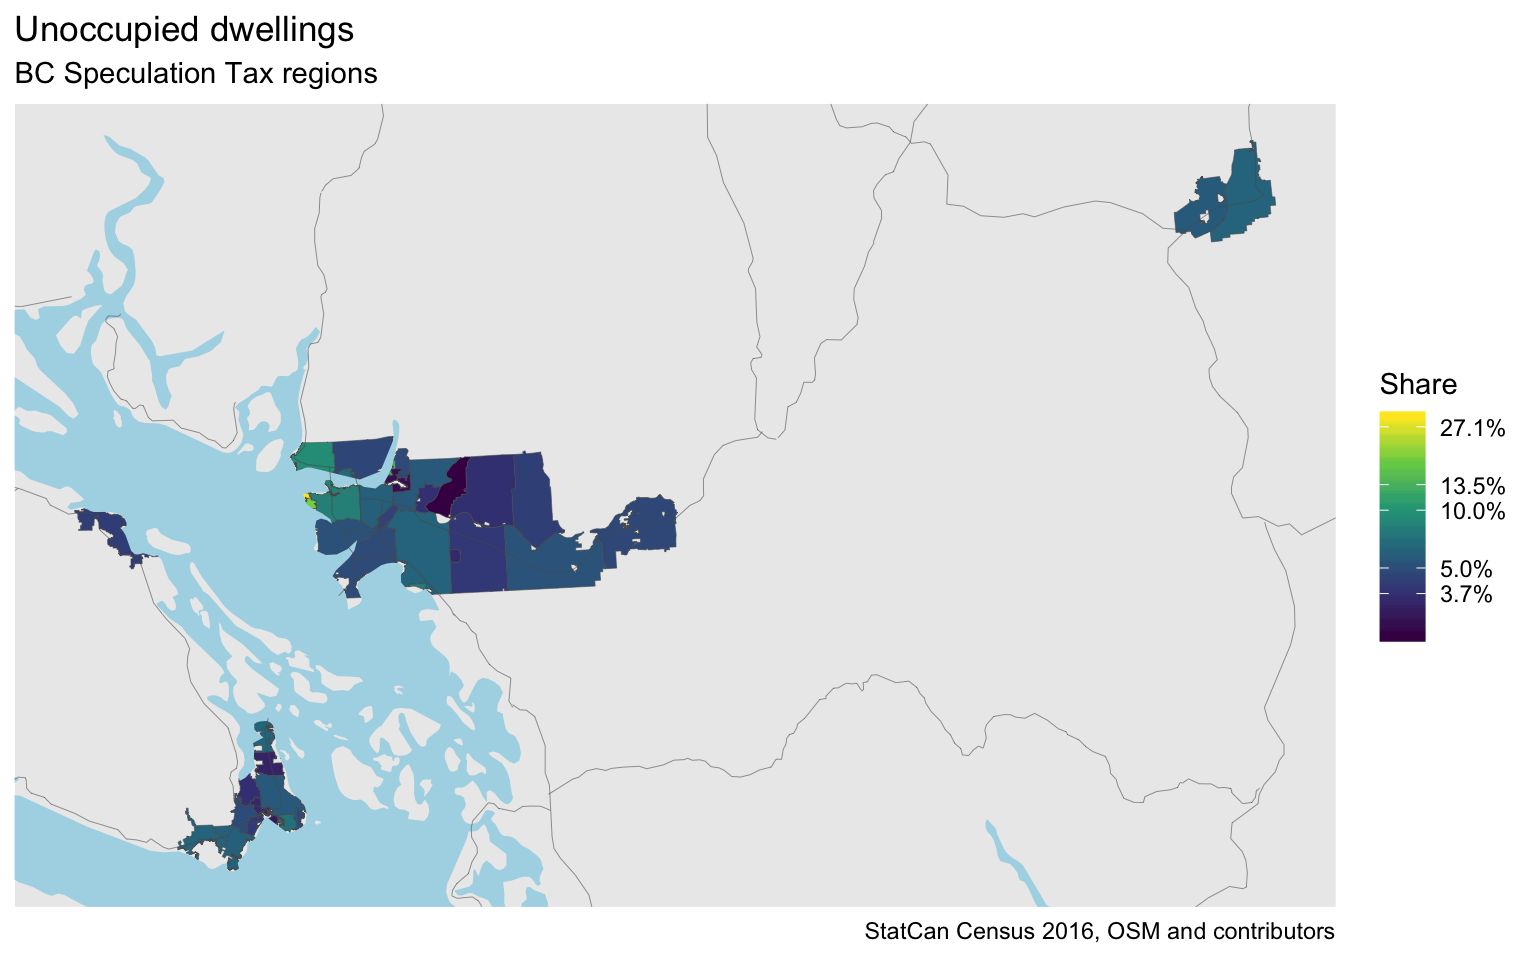
Of note, so far we can report that the impact from the Speculation and Vacancy Tax will vary widely by geography. Many municipalities have very few empty properties or foreign owners. Others, as near UBC (Metro Vancouver A) have a lot. Of course it’s worth noting that the housing around UBC is unusual for many reasons, including its student population (often boosting census unoccupied counts and highly transnational). Moreover, Electoral Area A weirdly extends into the mountains of the North Shore, where a small number of empty cabins complicate the picture, but there aren’t too many, so we don’t show that part on the map.

Satellite families
What about satellite families? Brace yourself for a much longer discussion, necessarily delving into the definition of satellite families, the methods BC may attempt to use to audit those they suspect of being satellite families, and the limits of the information we can gather about satellite families.
In common parlance, satellite families refer to families where income earners live and work in one place while children and spouses live in another. Within the family sociology literature, this includes a variety of spousal and spouse-like relationships grouped as Living-Apart-Together (LAT). It also includes adult children being supported by parents who live elsewhere, and minor children who might be living with other caregivers (like grandparents) while receiving parental support. Within the immigration literature, satellite families might also be understood to include a wide variety of ways families work around and across borders, often sending different family members to places where they’re likely to see the most economic opportunities, but involving remittances sent back across borders for the good of the family as a whole. The Philippines and Mexico are perhaps the places most studied where families send workers abroad who return remittances back home, usually with a long term goal of reuniting the family. But other countries, including China and even Canada, have similar traditions. Satellite families create transnational ties, constituted in part through the flow of resources across borders but between family members. Vancouver likely has a lot of satellite family members engaged on both sides of transnational income sharing, both as wage earners supporting those abroad, and family members supported by those abroad.
Vancouver also has a lot of wealthy residents, including both immigrants and non-immigrants. And if there’s one thing we know about wealthy residents, it’s that they often don’t pay their fair share of taxes. In the specific context of BC’s Speculation and Vacancy Tax, the debate over satellite families has often emphasized tax avoidance. Satellite families are frequently suspected of gaming tax systems for their own advantage by deriving their income from another country, leaving it untaxed by Canadian income tax. Income tax, of course, helps to fund many services (e.g. education, healthcare) enjoyed by Canadian permanent residents and citizens. Property tax also funds many services, though as many observers have noted, BC has very low property tax rates. So it’s possible to game tax systems – entirely legally – by one family member working in a location (outside of Canada) where income tax rates are lower than BC’s and paying income taxes there, while other family members buy property and enjoy many of the services of BC, where property taxes are often lower than elsewhere. This is the situation the Speculation and Vacancy Tax is meant to correct, though of course it also potentially creates problems for transnational families who aren’t attempting to game tax systems. It also has no impact on satellite families who rent rather than own. Aside from identifying satellite families, the joining of property data with income data also has the potential to identify tax evasion. As revealed by recent CRA audits, tax evasion among wealthy Vancouverites is probably pretty common.
How many satellite families are there? We really don’t know yet. There’s no good data on the issue, especially since families filling out census forms may, or may not, choose to list members regularly working overseas as resident in BC (and census residence is different from tax residence). That said, we have a better sense of who might be at risk for either listing themselves as satellite families or being audited under suspicion of tax avoidance or evasion. But we have to make some guesses about what might trigger audits.
First, let’s remind ourselves of what data is being collected. The declaration form for the Speculation and Vacancy Tax asks about worldwide income for property owners, including the combined worldwide incomes of spouses. This is attached to property tax data from the assessment rolls. So the tax authorities should have declared data on worldwide income, income taxed in Canada, and property values. Recall that owners with less than half of their worldwide income declared in Canada are considered satellite families. Some people will identify themselves as satellite families. But in other cases, they may provide false declarations regarding their worldwide income. This opens up a variety of auditing opportunities for BC and the CRA. How will they decide who to audit for compliance?
We already know the CRA has identified lifestyle audits as a lucrative means of tracking tax evasion. We also know they’ve got a rule in place regarding rents deemed legitimate for non-arm’s length tenants. We can build on this to explore cases likely to trigger audits if undeclared as satellite families. Keep in mind there may be many explanations for discrepancies between property value and income, including family income volatility; dramatic appreciation of housing purchased long ago; or living off savings, inheritance, or gifts. But other explanations will identify home owners as “satellite families.” Of note, still other explanations may be referred to the CRA or police authorities when they suggest tax avoidance, tax evasion and/or work in illegal economies. So how many people are at risk of being audited as satellite families?
Wait, just a few more methodological caveats! We will try to estimate the number of households at risk of being audited or labeled as satellite families using the recently released 2016 PUMF data. 2016 data is, of course, now somewhat dated, being collected prior to a number of policy changes of interest to what we’re exploring, including (but not limited to) the imposition of the Foreign Buyer’s Tax in 2016, the imposition of the Empty Homes Tax in the City of Vancouver, and the slow roll-out of the Speculation and Vacancy Tax itself. We also won’t be able to achieve a perfect match with the regions the speculation tax applies in, having to make due with using Census Metropolitan Areas. The largest discrepancy is that this drops the Nanaimo area region. PUMF data is based on a weighted subsample, so estimates based on PUMF data are never counts as when using the census, but ranges based on different weightings. In most cases, actual census counts will be contained in these ranges, so PUMF data adds a conceptual nuance we usually don’t see when using census data. At this point it is good to remind ourselves that what we are really interested in is not the census counts but the actual numbers on the ground that the census is trying to estimate, but as usual we will gloss over this last step and be satisfied with estimating census counts. Here we will use the primary household maintainer as a proxy for the owner, and we will ignore dual or multiple ownership scenarios where owners fall into different categories. The speculation tax puts heavy emphasis on spousal income, which is different from family income or household income. That makes it a bit difficult to use census data to compare, we would need another custom tabulation to extract the income of spouses only. For this post we will gloss over this issue and just use household income instead. While family income may be closer to spousal income, we simply felt that household income is a more appropriate measure in the context of the Speculation Tax. People that favour different preferences are welcome to grab the code and make the appropriate adjustments. A related issue is what counts as a “satellite family”, in particular it is not clear if it applies to individuals who are not married or living common law. While only married (including common-law) tax residents in BC would appear to be at risk of declaring themselves part of satellite families, single individuals could also be flagged for lifestyle audits to determine tax compliance, so we include both, but we separate them. Throughout we will exclude immigrants that came in 2015 or 2016, as their 2015 Canadian income may not correctly reflect their subsequent Canadian income. Moreover, we exclude households that have moved within the preceding year, as well as properties worth less than $150,000, as these are exempt from the tax. Generally we don’t report if a category contained fewer than 30 (unweighted) cases.
Home-value-to-income based triggers
Assessed home value to income ratios could serve as a trigger for consumption based audits. But what’s a good ratio to use? For a foreigner renting out their property to a non-arm’s length tenant, the tax requires the income of a tenant to be at least three times the (fair market value of the) rent in order for a foreign owner to be exempt from the tax. We take this as a hint we can use this as an implicit definition of a satellite family. A satellite family may be identified as a household with declared income taxed in Canada that is less than 50% of three times the imputed rent. Why? There’s the expectation encoded in the non-arm’s length definition that housing costs will take up no more than one third of income. And if more than 50% of the household’s combined spousal worldwide income is declared outside of Canada, one is considered a satellite family. To estimate imputed rent we use a gross cap rate of 3%. This test is effectively asking that owner households spend at most two-thirds of their total Canadian income on shelter cost based on imputed rent.
However, this will catch quite a few “house-rich but income-poor” people. Take for example a senior that bought their house a long time ago for a lot less money than it would take today. If their house is now worth, say, $2M, then the imputed rent comes out to be $5k a month, or $60k a year, requiring an total annual income of at least $90k to pass our test. Given the fairly large appreciation of property, especially in the years before the census, it seems reasonable to adjust the trigger by how long the property has been held. The province will have the exact time the property was purchased to fine-tune this, but using census data we can only check if the person lived in the same residence one and five years prior. As we are exempting people that moved within the year before the census (analogous to the Speculation Tax exempting properties in the year they transacted), this leaves us with the five year timeframe.
Given the explosive rise in property values in the year before the census, we discount the imputed rent by a factor of 0.8 if the household maintainer moved into the property between one and five years before the census, and by a factor of 0.5 if the maintainer moved in more than 5 years before – reflecting the roughly doubling of property values within the five years before the census. We call this the adjusted imputed rent test.
Of note: our data is top-coded for dwelling-values above $2M, which can lead to some mis-classification for some properties with very high dwelling values, but ultimately different ways of adjusting for this have little big impact on the high-level numbers. We added an additional filter excluding households with household income above $90k, which softens potential issues around top-coded dwelling values.
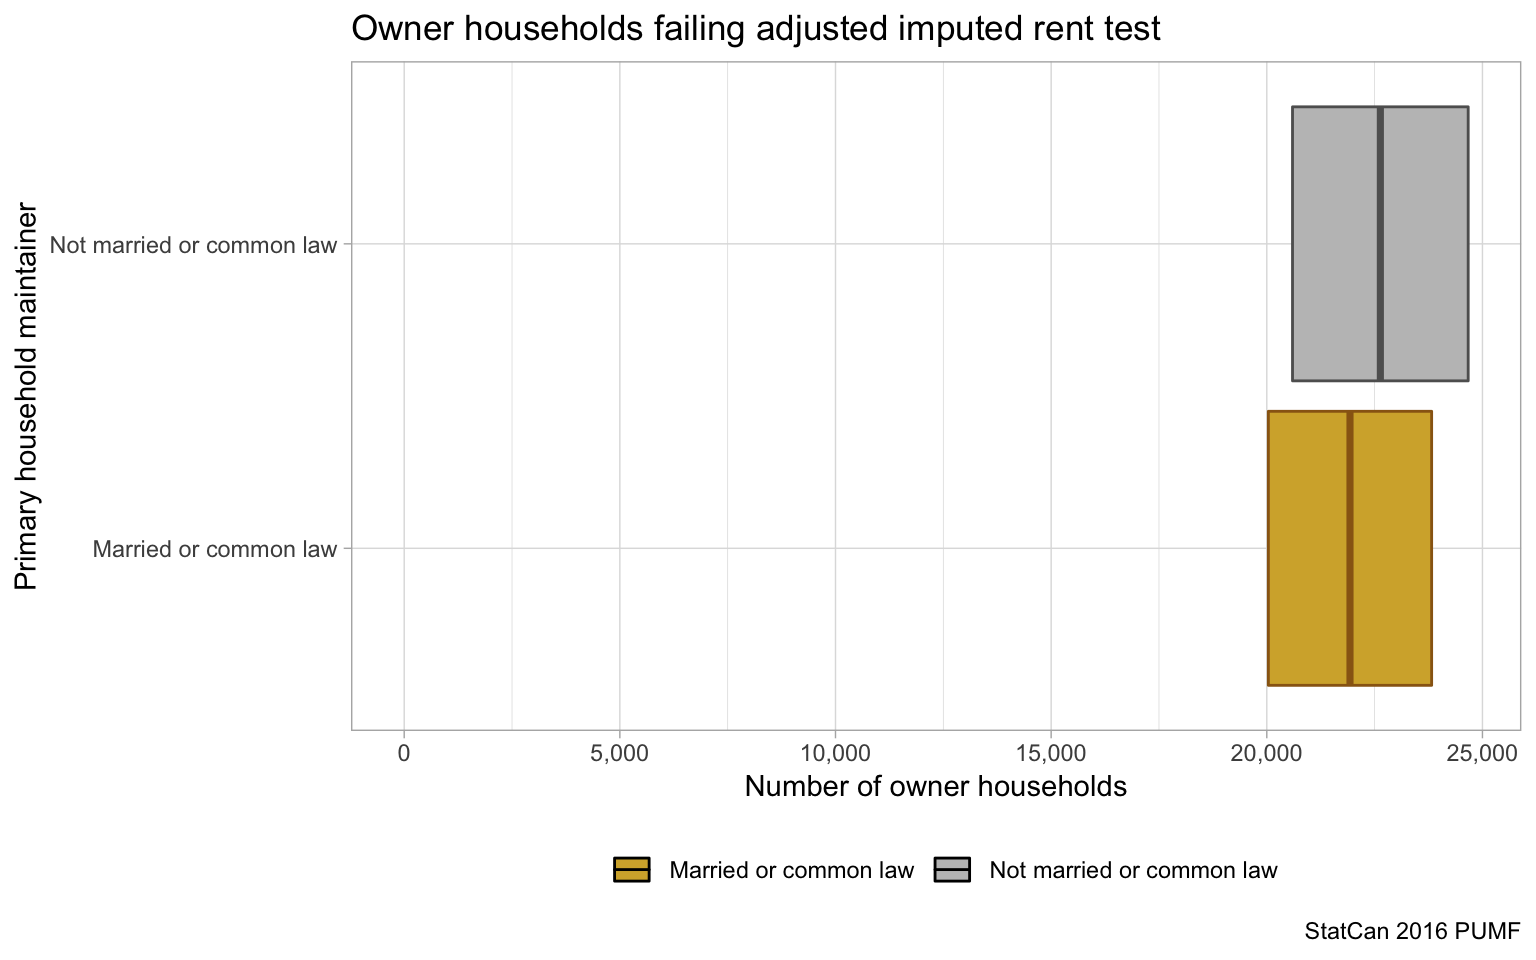
Combined spousal income determines satellite family status under the Speculation and Vacancy Tax, so we separate out our estimate of those failing our adjusted imputed rent test (and hence at risk of being audited) by marital status. This yields an almost identical number of single vs married or common law households failing the test, combining for around 45,000 in total. While only married (or common-law) people would seem to be at risk of being labeled satellite families given the focus on combined spousal incomes (“gifts” to children and other family members don’t count the same), it’s possible that auditors will still include single people in the pool of those at risk of being audited for tax evasion and failing to accurately report worldwide income. So we’ll keep both singles and marrieds in the analysis, but treat them separately.
Household Status
We also want to look at other statuses that might matter. Students and seniors come to mind as being particularly vulnerable to audit because of their lower incomes. In addition, seniors may be especially likely to have purchased their homes long in the past, meaning their homes may have done much more than double in value since they’ve lived in them. So let’s see what happens when we separate out these groups.
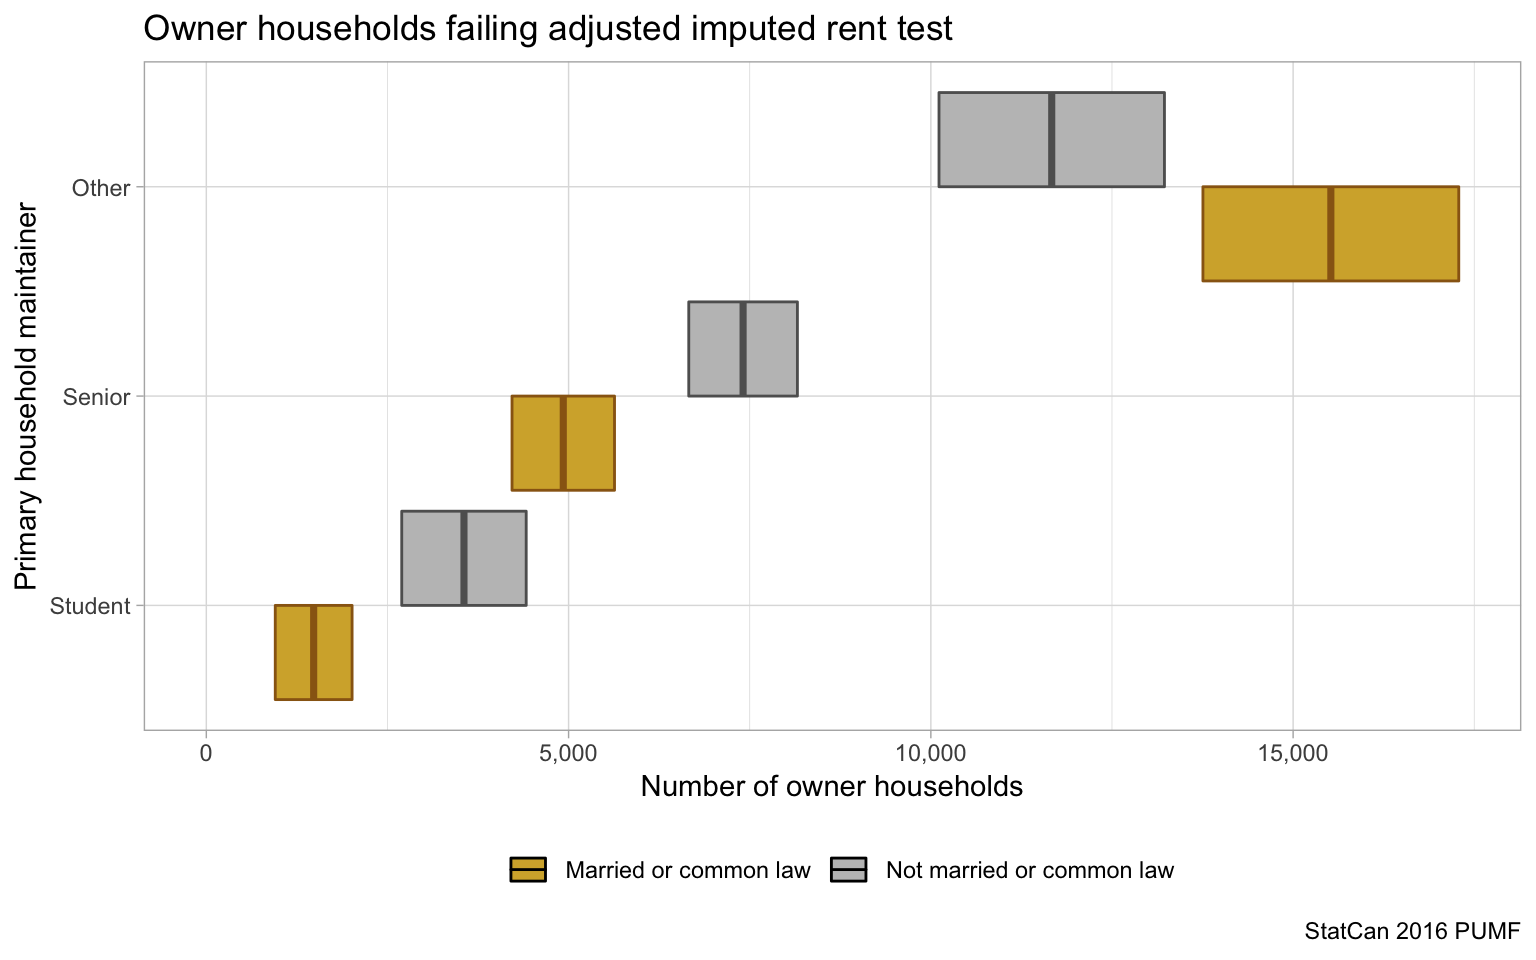
We see that in particular single seniors make up a good portion of households at risk of being audited, but the bulk is taken up by working age population that is not attending school. Household type gives a different way to understand the makeup. If satellite families mostly involve an overseas wage earner supporting a spouse and children, do we see a lot of these types of households?
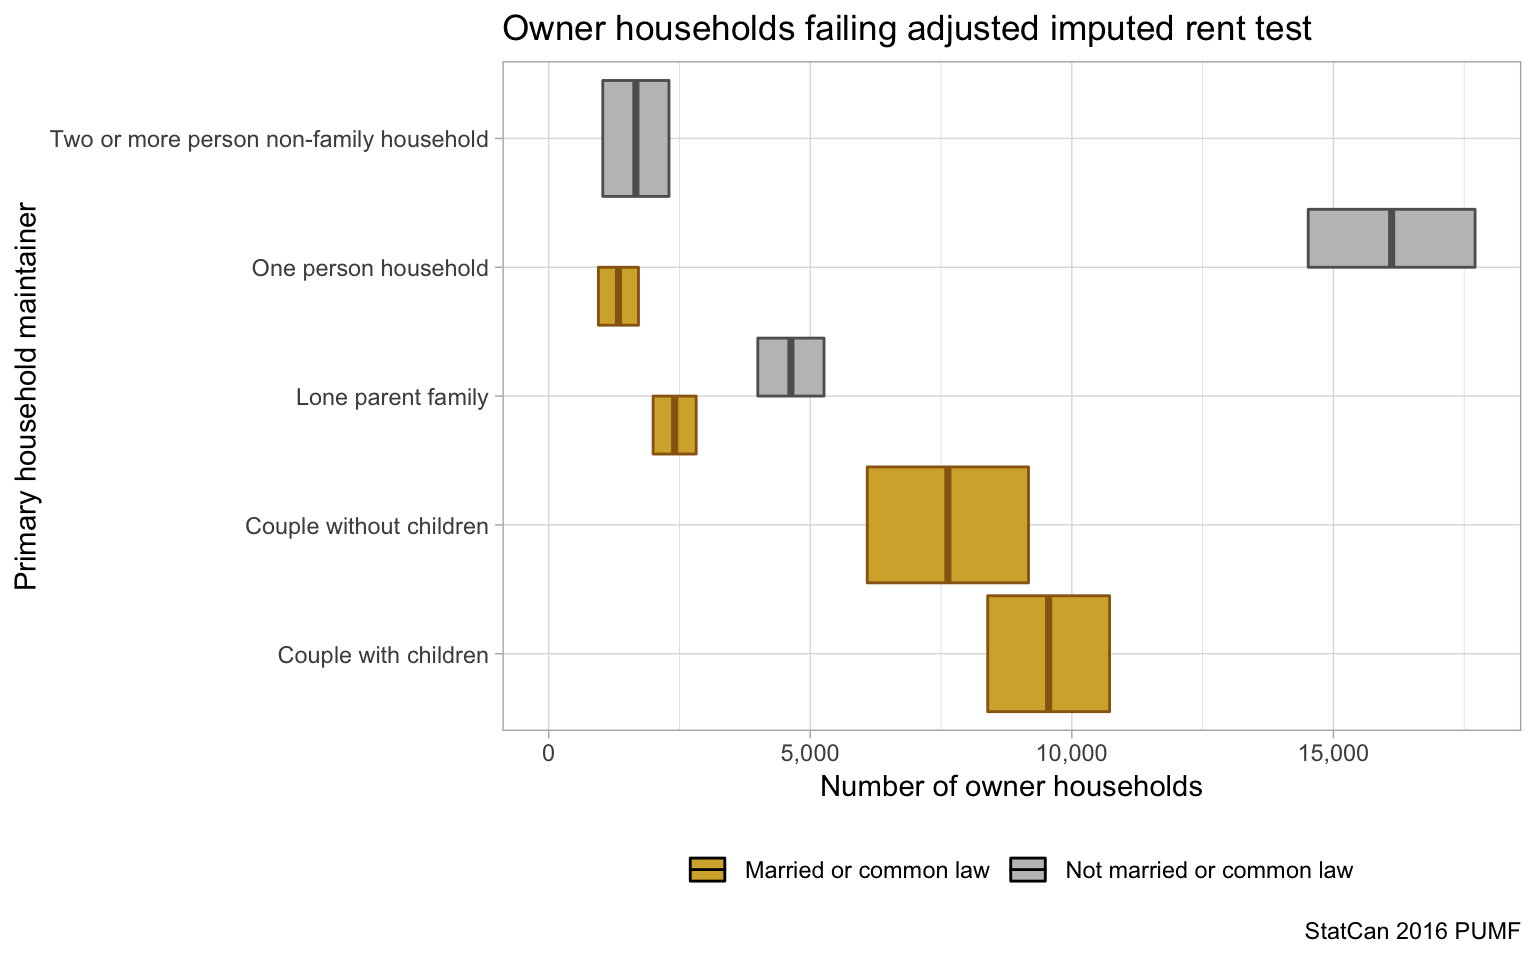
As it turns out, there are relatively few people who report being married but living as a lone parent who fail our adjusted imputed rent to income test. There are only around 2,400 married or common law household maintainers that show up in lone parent households, making up a small proportion of those failing our test overall. But it’s possible that many respondents filling out census forms still report their spouses as belonging to the household, even if they spend a significant amount of time working overseas, so we shouldn’t count out other married and common-law categories, split between those with and without children, from being considered satellite families.
Dwellings
What kinds of dwellings are people who fail our test living in? First let’s talk about dwelling values. By our metric, the disjuncture between dwelling value and reported income triggers possible audits. Higher dwelling values have a mechanical effect on increasing the income needed to avoid an audit, so we’d expect households with higher dwelling values to be more likely to fail our test. Is this what we actually see?
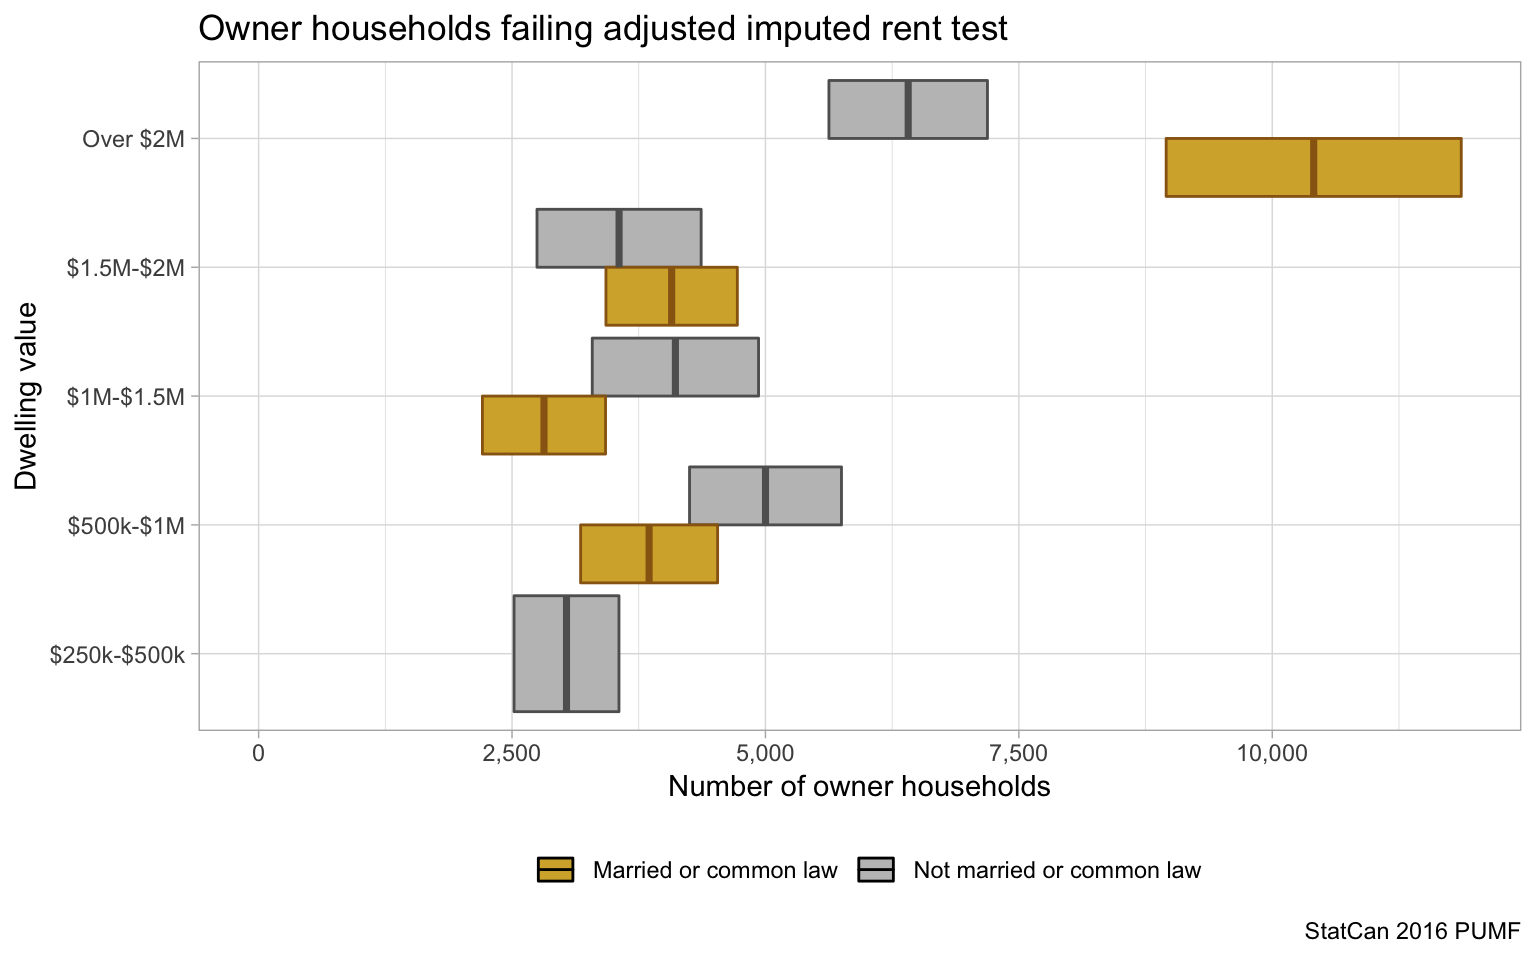
As one would expect, relatively few lower dwelling value homes are impacted. But each half a million dollar value bracket between $500k and $2M seems fairly evenly filled by about 4,000 households, jumping to higher number for homes above $2M, especially those occupied by married or common law household maintainers. Those most at risk of being audited would appear to be those living in the most expensive homes.
What structural sorts of dwellings are the people who fail our adjusted imputed rent to income test living in? Condo apartments? Single detached homes? Both dwelling type and condominium status will be available to government auditors. Our data only has three dwelling types: single detached, apartment and other. In our focus on owner-occupied dwellings and taken together with the condominium variable, we’re mostly separating condominium apartments from single-detached houses, with the latter showing up either as a single-detached house or a non-condominium apartment (i.e., house with a secondary suite or “duplex”). But there will be some other types of non-condo apartments and other types of structure (e.g. rowhouses) showing up as both condos and non-condos.
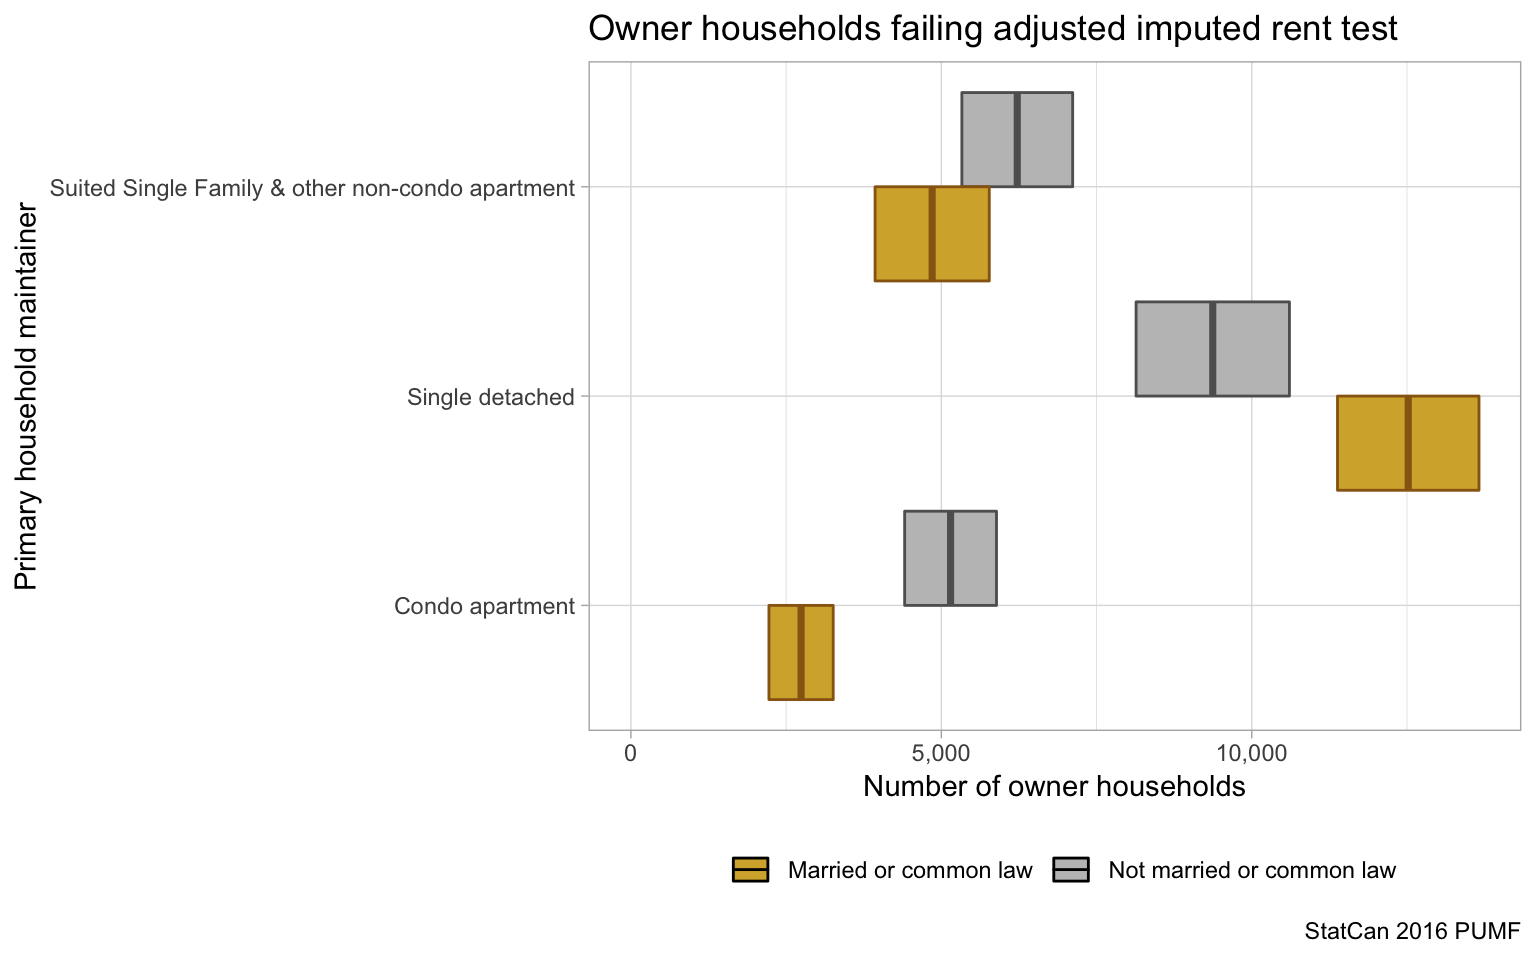
Most of those at risk of being audited would appear to live in single-detached houses, with or without suites, with condominium apartments taking a distant second. It would appear that not too many other kinds of housing will be targeted, or at least we don’t see enough of them to provide reliable estimates of their frequency. But this analysis by itself is interesting in policy terms. As a reminder, some condominium apartments will be temporarily exempted from the tax if they have restrictions on rentals – an out not available to other dwelling types (and also not available for long!) Detached houses with secondary suites have another potential loophole. Regardless of their status, property owners might be able to avoid paying the Speculation and Vacancy Tax on their house as a whole so long as they rent out one of the suites on the property to an arm’s length tenant, pointing toward the categorical flexibility houses with suites repeatedly demonstrate in policy terms.
Immigration
In the context of satellite families we often think of immigrant households. These are the households expected to maintain transnational connections, though overseas income earning may diminish with time (and generation). Of course, non-immigrants can also find themselves earning incomes (or partnered to those earning incomes) outside of Canada. Moreover, we know Canadians of many stripes and backgrounds attempt to evade taxes, just as they also have “bad years” where their incomes may drop out of the normal. So let’s look into immigration by period, including non-immigrants in the mix. How does immigration relate to risk of being audited as a satellite family using our adjusted imputed rent test?
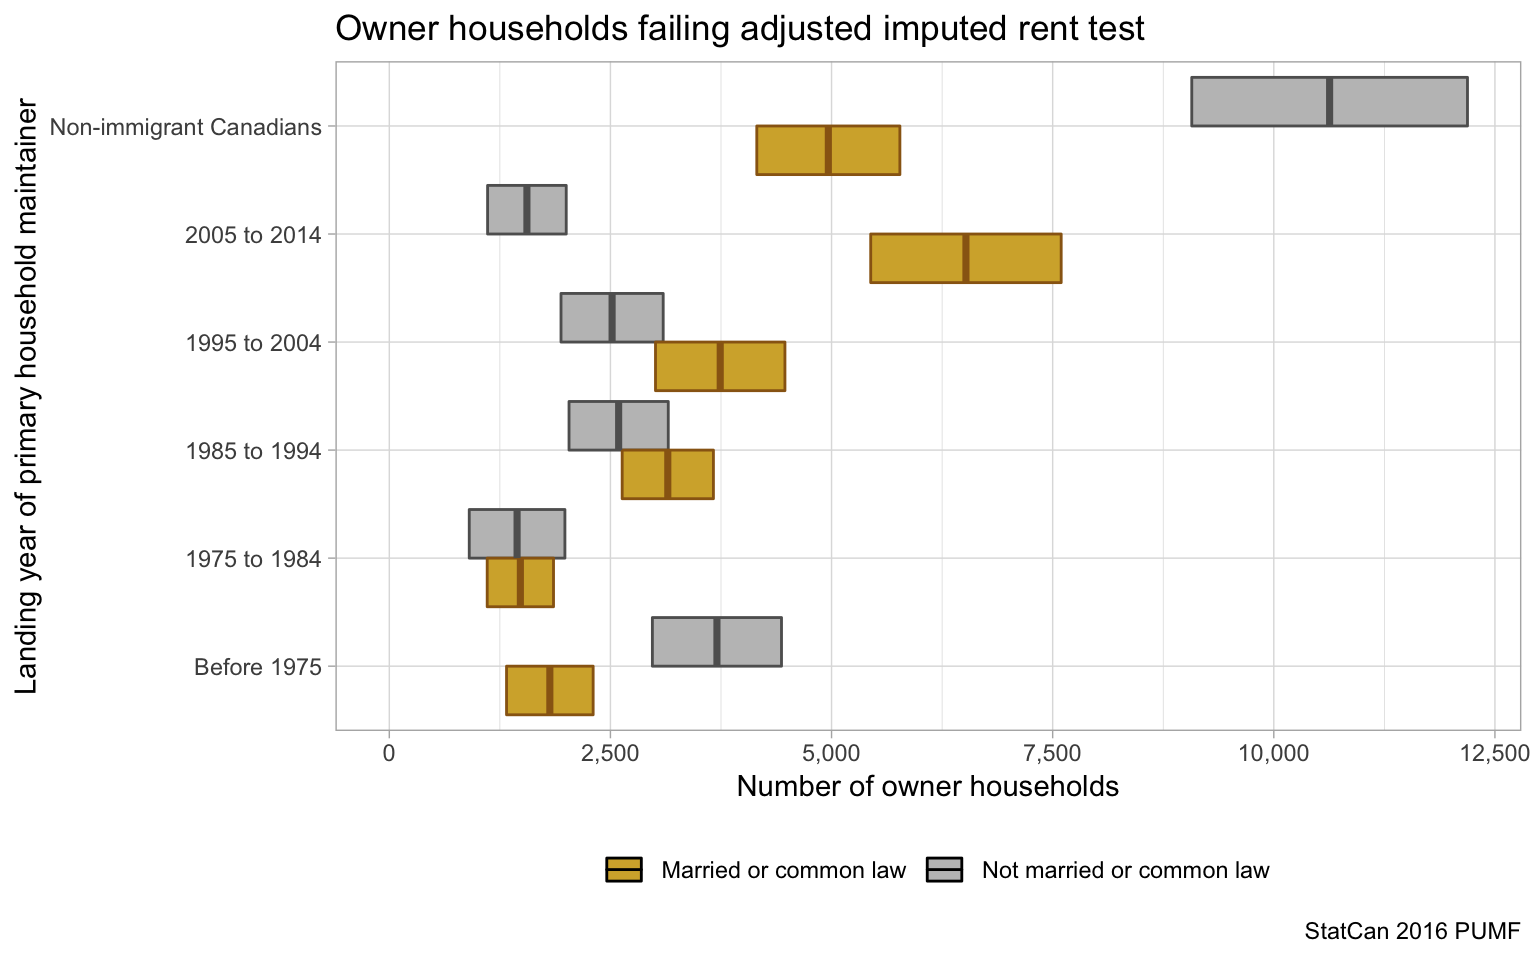
Higher numbers of non-immigrants (i.e. Canadian born) fail our test than any ten-year immigration arrival bracket. Non-immigrants especially dominate the set of single people with lower incomes than expected by housing values, but they also appear in great numbers for married people. This is a striking finding, but also reflects the greater overall size of the non-immigrant population. Looking at immigrants by period, we tend to see what we expect: recent immigrants fail the test more often than more established immigrants. Recent immigrants failing our test also tend to be dominated by married couples, unlike what we see for non-immigrants, but this gap diminishes over time as immigrant patterns come to look increasingly like Canadian born patterns.
Looking at the share of owners failing our test in each immigrant category, as opposed to their total numbers, helps clarify these patterns further.
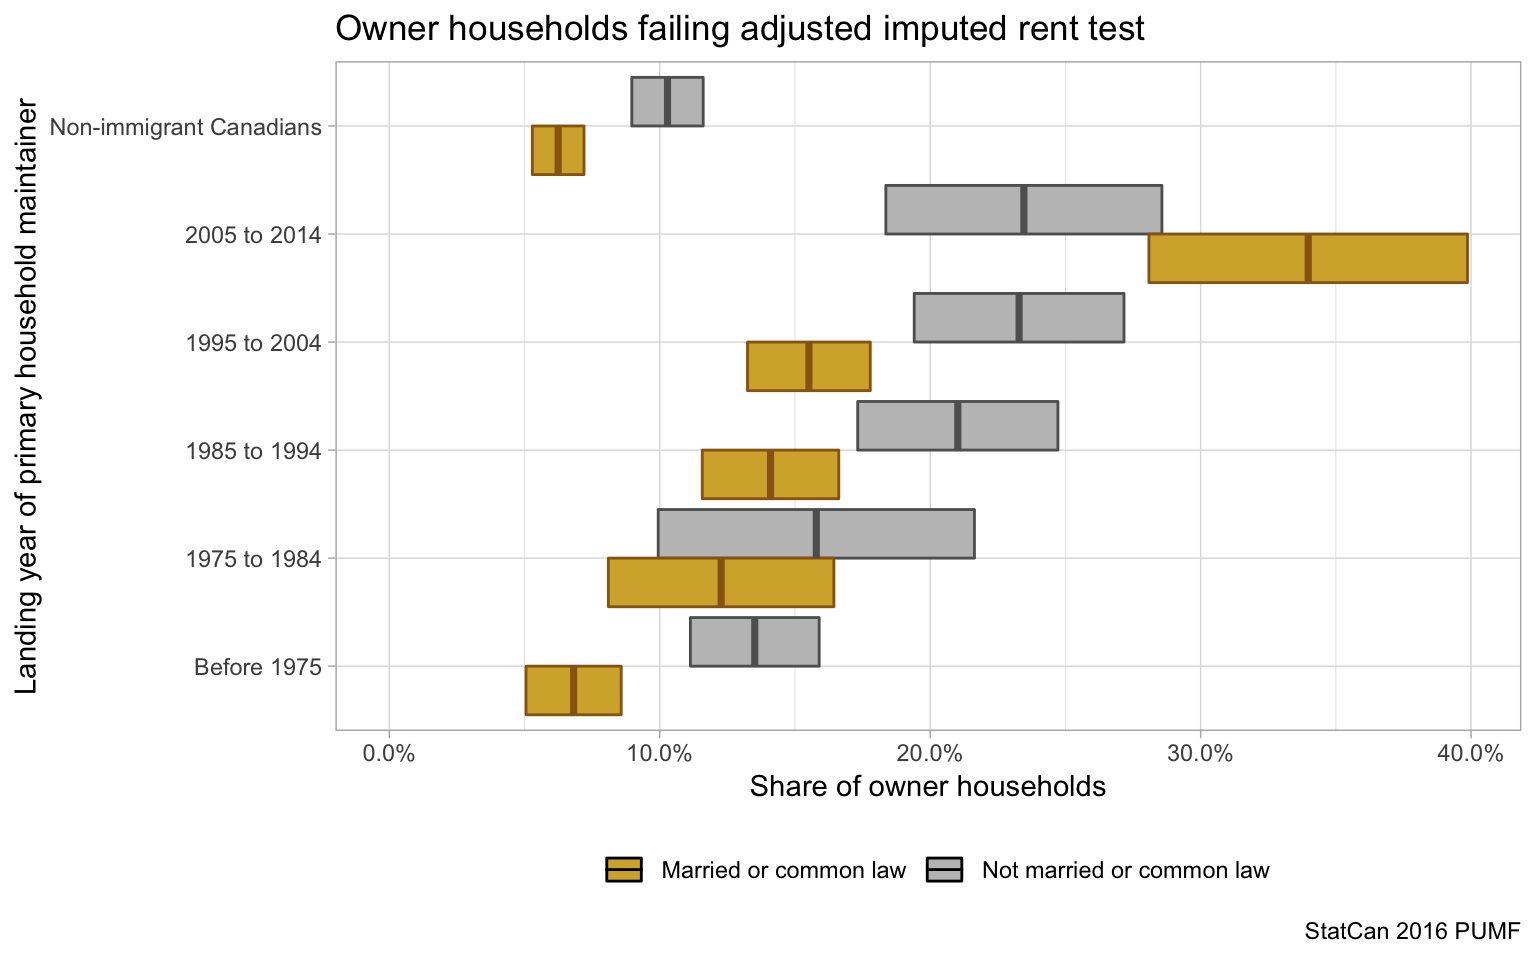
Here we see that higher proportions of recent immigrant owners fail the adjusted imputed rent test than for non-immigrant owners or more established immigrant owners. Reading shares by period of arrival sideways, the evidence would suggest that more recent arrivals owning homes will likely move toward non-immigrant patterns for home owners the longer they remain in Canada. But culture and wealth of immigrants may vary with period, so there may be other explanations at play as well.
Where are those who fail our test coming from? Let’s take a look, using place of birth! Of note, sending countries vary from period to period, meaning the period analysis (above) influences the place of birth analysis (below) and vice-versa. Arrivals from China, in particular, tend to be more recent. We should remind ourselves that place of birth is not necessarily the same as the place people immigrated from. In particular in the case of China, sizable portions of immigrants arriving from Taiwan and Hong Kong were actually born in China.
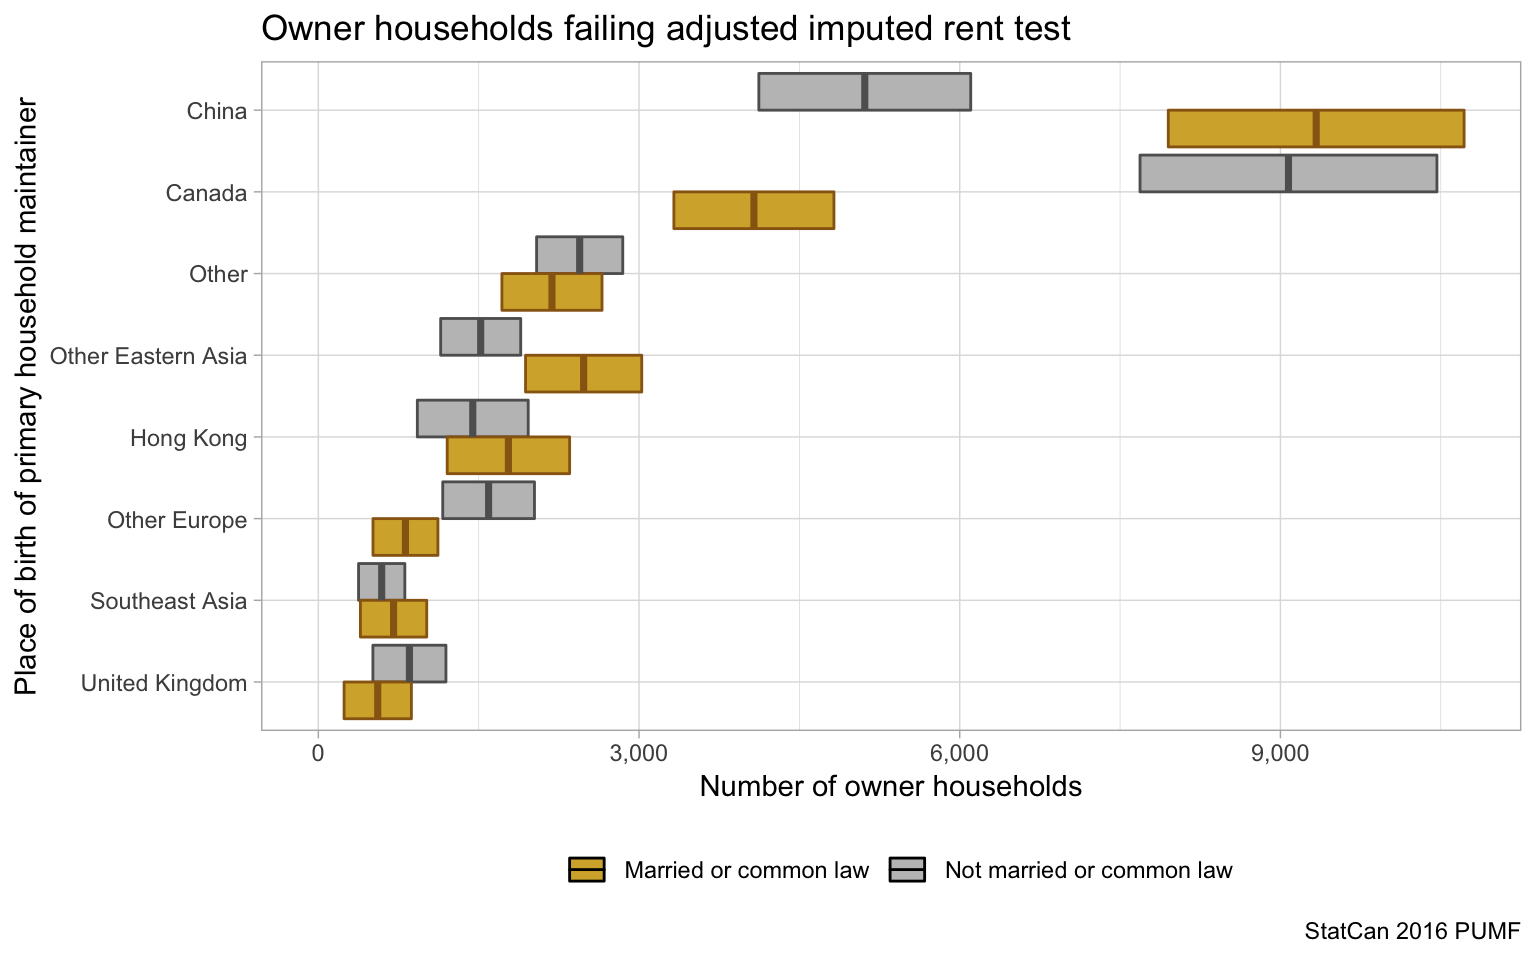
Here Chinese born and Canadian born household maintainers contribute the most to owners failing our adjusted imputed rent test. But other sizable contributors to possible audits include those from Hong Kong, other East Asian countries, and the United Kingdom. The United Kingdom may seem unexpected as a group likely to face audits, but we have already seen some of the relevant cases documented in the news. Let’s look at share of owners failing our adjusted imputed rent test by place of birth.
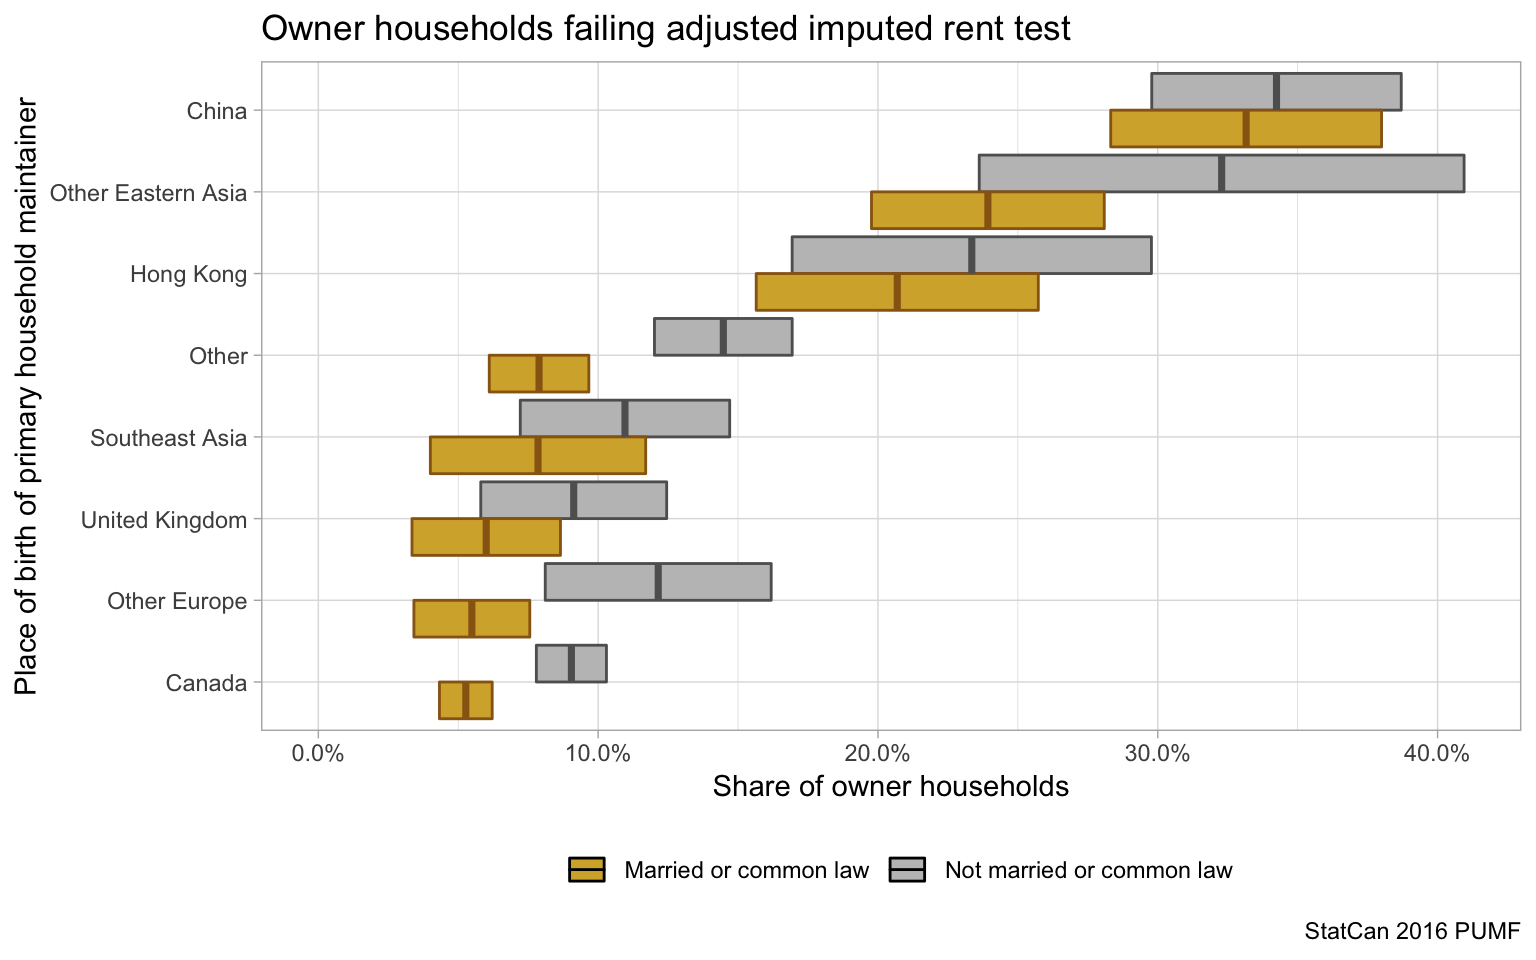
Diving into the share of owners likely to trigger audits, we see in all cases that it’s a minority of owners at risk from each country. The uncertainty ranges are too large to sensibly rank the data by place of birth. We grouped immigrants from birth places with fewer than 30 (unweighted) combined cases into larger groups. Nevertheless there are sizable proportions of owners arriving from China, Hong Kong, and Other Eastern Asian countries at risk of being audited. This likely reflects Canadian immigration programs selecting for wealth, like investor class programs, popular in these countries. Comparing investor immigrants living in the speculation tax regions to all immigrants by place of birth, we notice how the investor program leans heavily toward Pacific Rim countries.
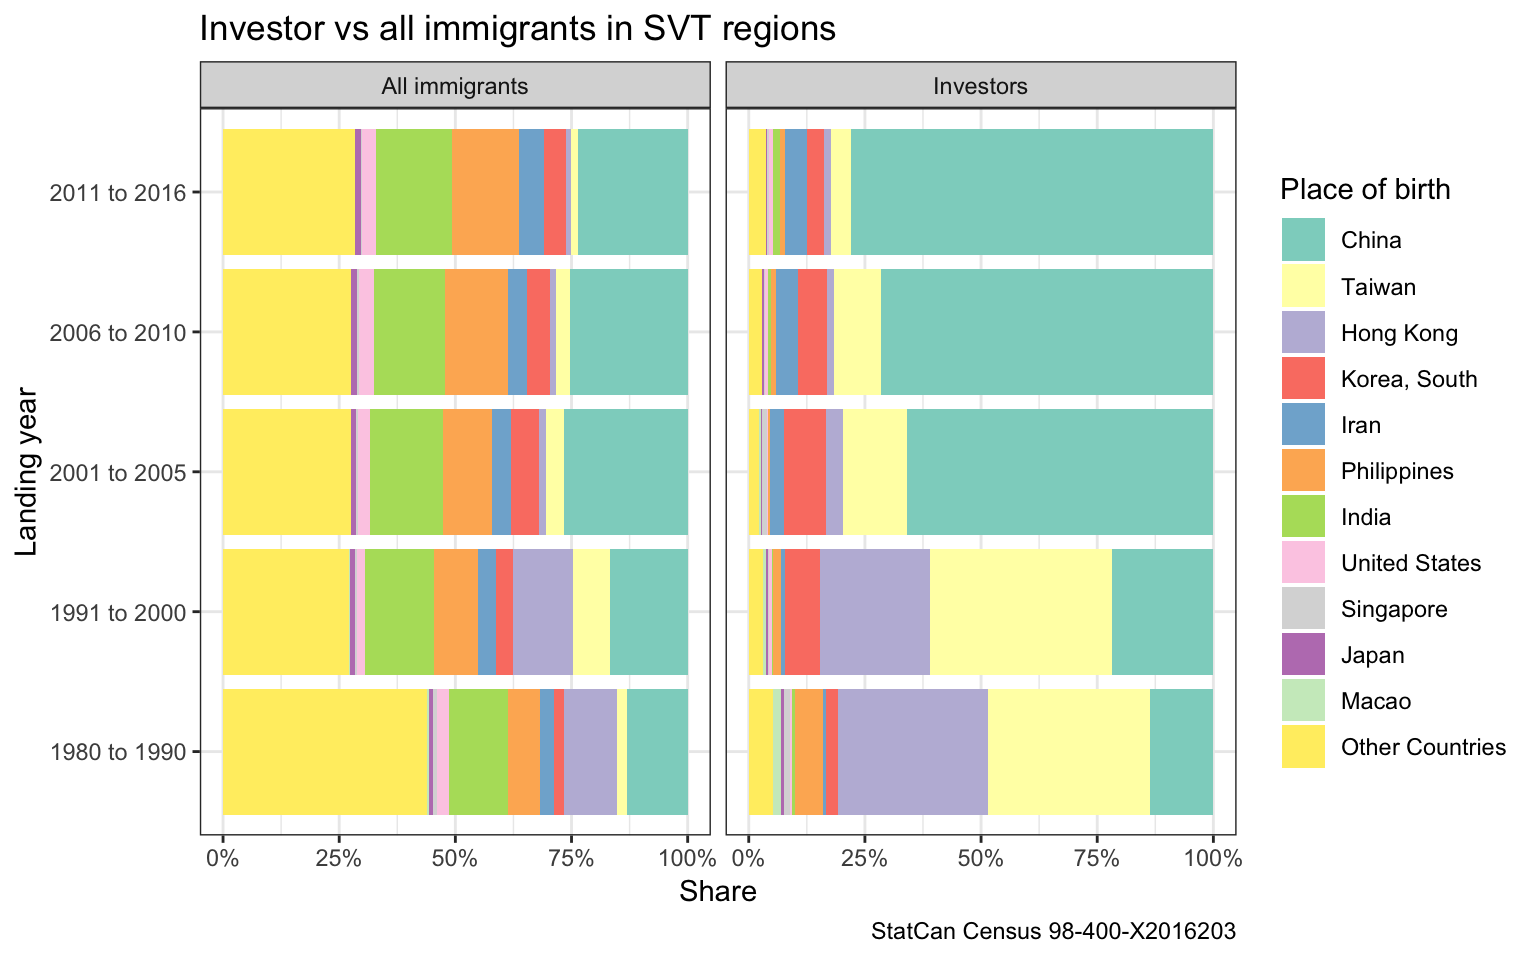
We know just over 22,000 property owners in Metro Vancouver were identified as investor class immigrants in 2018 CHSP data. We also know that the incomes of the investor class immigrants reported in Canada have tended to be lower than for other streams, as confirmed in the 2016 census data below.
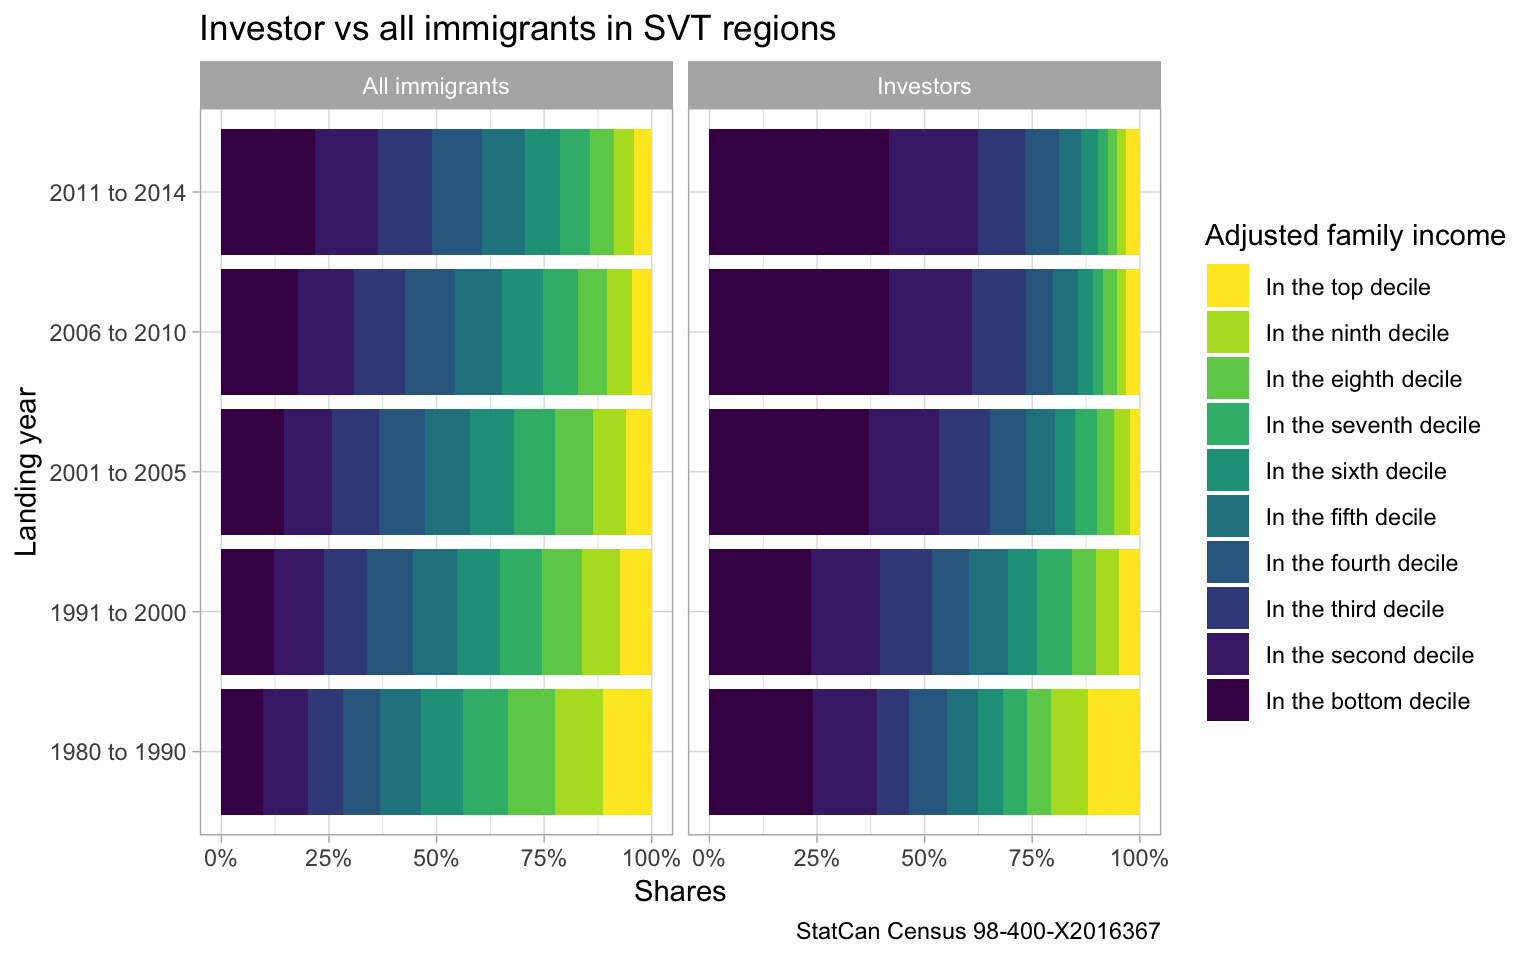
Looking at the adjusted family income deciles, the bottom decile is very strongly represented, with incomes slowly rising the longer the immigrants have been here. While we don’t know how these roughly 62,000 investor immigrants group into households and household types and break up into renter and the 22k owner households, this does provide more circumstantial evidence that a fair number of investor class immigrants will get caught by the adjusted imputed rent audit trigger.
East Asian ownership patterns may also reflect price discrepancies that make Vancouver real estate seem especially cheap to immigrants arriving from across the Pacific Rim. Arrival with wealth, whether from the sale of a pricey residence overseas or other sources, enables movers to quickly purchase housing in Vancouver. Once arrived, they could become satellite families by returning income earners to countries of origin where they see stronger job prospects (and less discrimination), or they could simply be living off of their savings as they adjust to life in Canada as homemaking migrants (ungated version). In this, immigrants may constitute a special case of income volatility in the years after their arrival. And of course let’s not forget that where there is wealth, no matter the source, there are likely to be attempts at tax avoidance and evasion!
Regional Variation
Lastly we quickly check on how properties likely to be declared as satellite families or audited for lifestyle discrepancies are distributed over the CMAs that we consider. Not surprisingly, in terms of sheer numbers, the Speculation and Vacancy Tax is overwhelmingly going to target Metro Vancouver. Almost all of the properties failing our test are in Metro Vancouver. Which isn’t too surprising since it’s where all the people live.
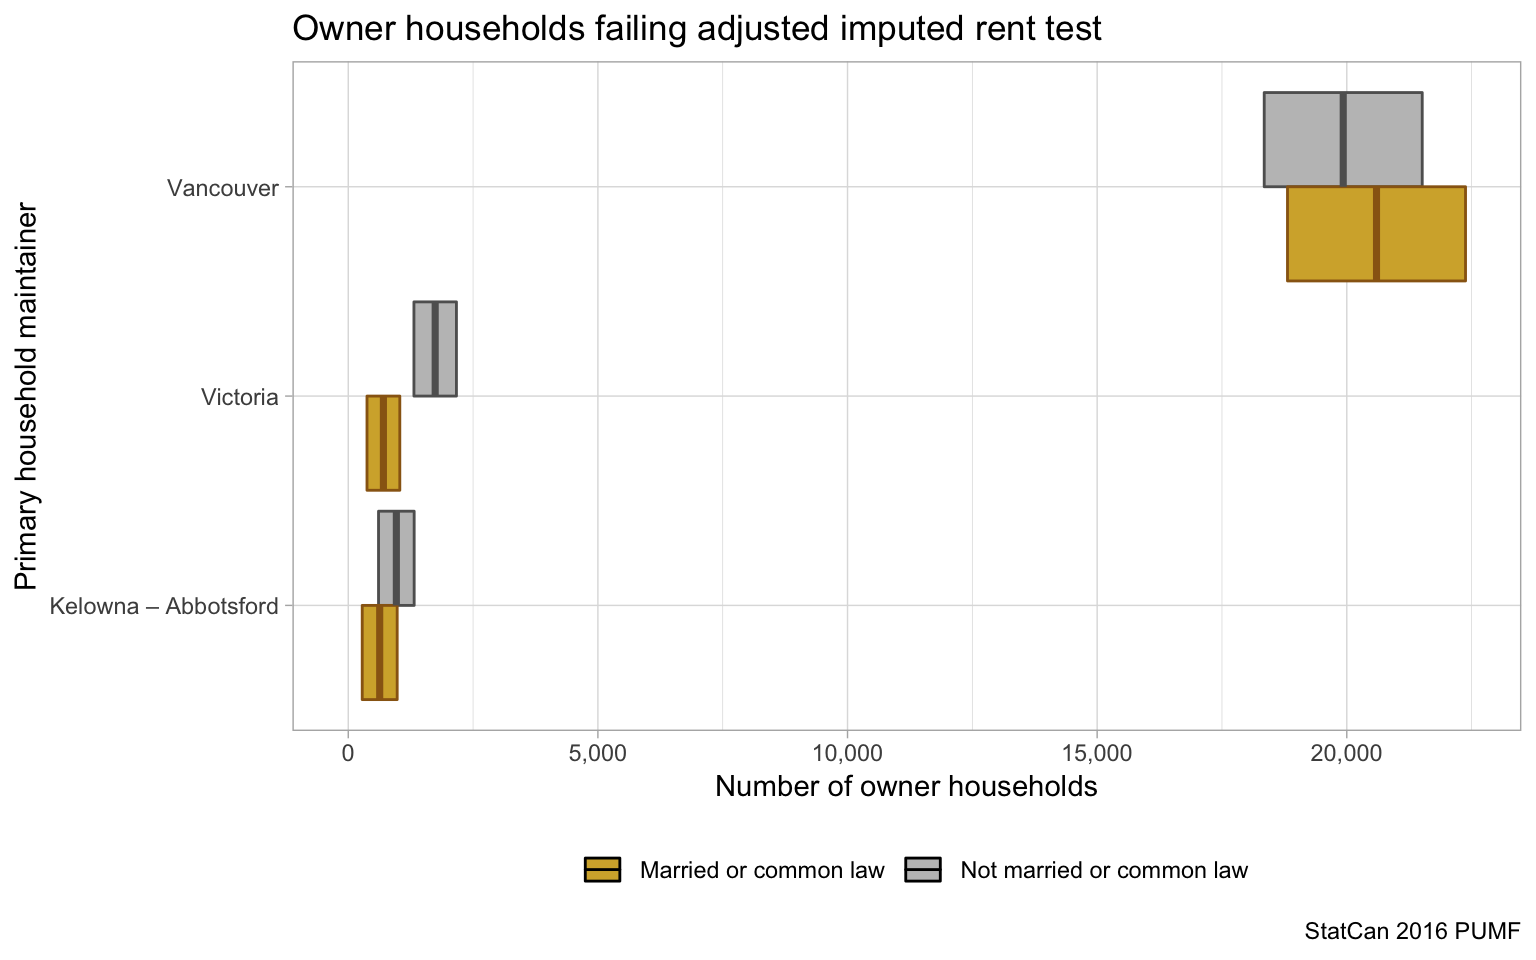
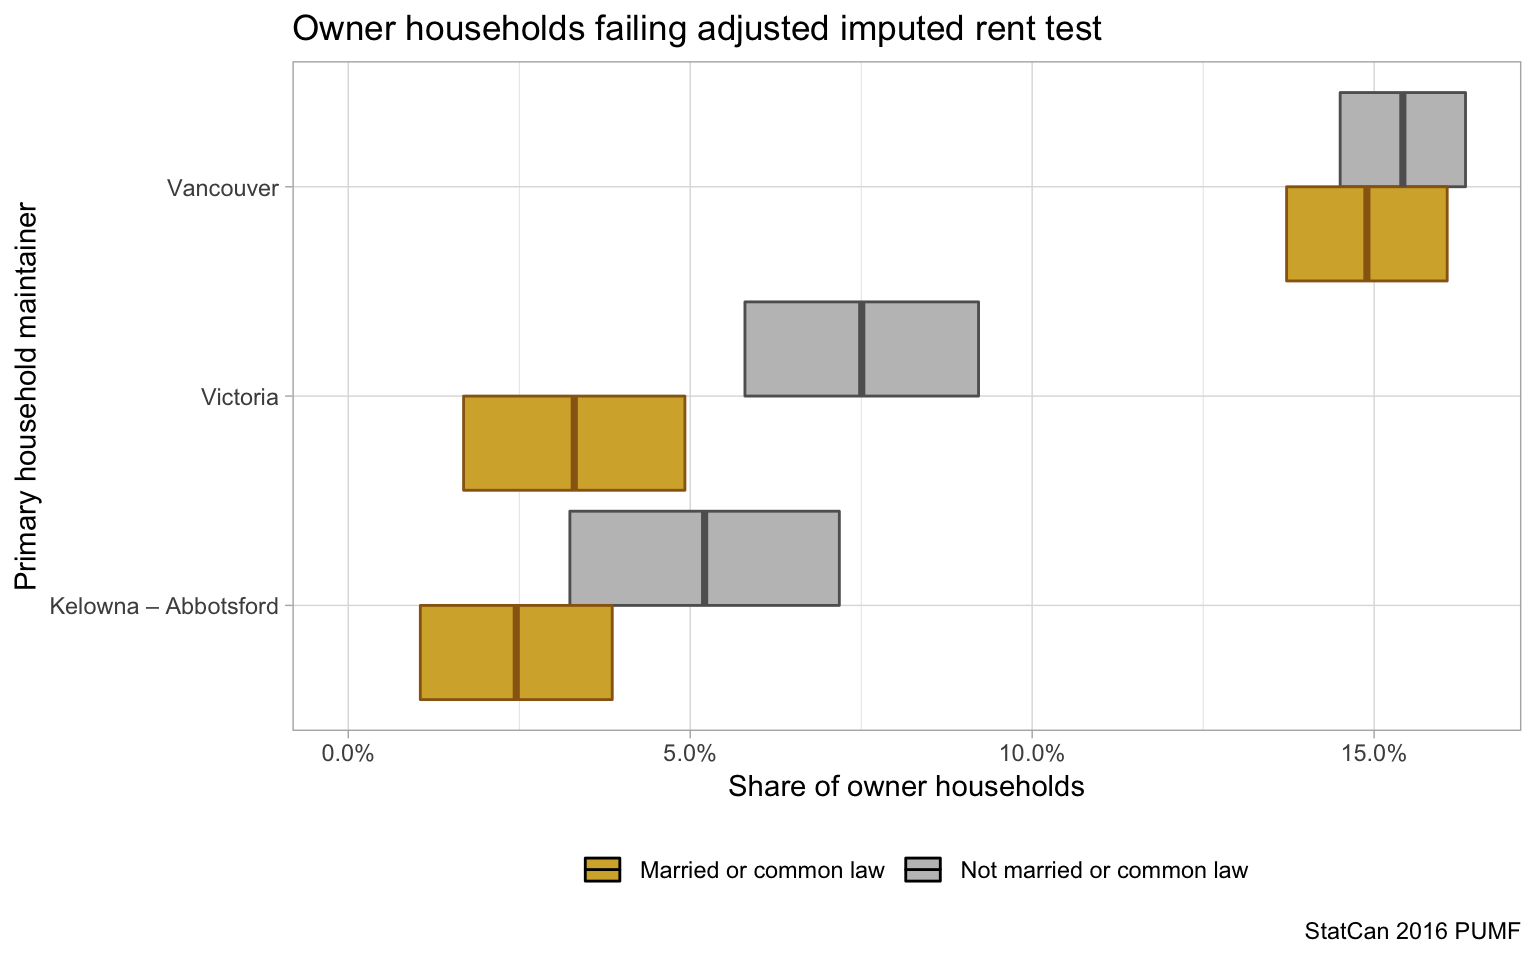
But what about in terms of share? Metro Vancouver is also where the highest value homes are located and the area with the most transnational ties. So perhaps it’s not surprising that the share of households likely to declare as satellite families or be audited as such looks highest in Metro Vancouver. But by share it’s more clear that Victoria, Kelowna, and Abbotsford pull at least some weight.
Comparing to Shelter-cost-to-income triggers
Another measure that has been in the public discussion regarding satellite families is the shelter-cost-to-income ratio. Instead of (adjusted) imputed rent, we can take the actual shelter cost from census data. This won’t be directly available to the government for audit purposes, but the government could try to approximate this using the mortgage registered against the property from their land title database.
Replacing our adjusted imputed rent with shelter cost we now can ask that owners have enough income to cover three times their shelter cost. Folding in the Speculation Tax definition of spouses having to declare at least half their joint spousal income in Canada we arrive at a shelter-cost-to-income cutoff of 66.7%. That’s something that’s reasonably easy to check in Census data, just like we did for renters near the top.
The total numbers of owner households failing the shelter-cost-to-income test is very similar to those failing our adjusted imputed rent test, but the populations don’t fully overlap as the following graph demonstrates.

This shows that the tests are quite sensitive to the definitions, and using these kind of tests for audits will not be entirely straight-forward. Provincial auditors will likely be busy, and will require a robust data-driven audit system in order to be effective.
Rental Income Tax Reporting Compliance
Reading through the requirements one can’t help but think that the BC government will make use of detailed individual tax return data to enforce the regulation. They may be able to use rental income on tax returns to verify the that arm’s length tenancies were correctly declared. At the same time, this should prove a very effective measure to ensure rental income is properly declared by landlords, which in turn forces proper declaration of capital gains taxes in case of a sale of a secondary residence, both of which are suspected to have low compliance. To get a rough idea of the impact, we use census data to estimate the total rent being paid by tenants. The aggregate shelter cost of tenants not in purpose-built, social housing or basement suites in our regions is $3.09B. Here we exclude basement suites because they are affected differently by the speculation tax. Rent is generally a bit lower than shelter costs, because rent may not include utilities. Combined with this, as well as tax write-offs, we assume an effectively 15% of this total is due as tax on rental income. If we take the current compliance rate to be 50%, the compliance rate that was recently estimated for artisanal landlords in London, and assume that the speculation tax increases compliance to 100%, this would generate an additional $232M of tax revenue at the federal and provincial level, which is the same order of magnitude as the projected direct tax revenue from the Speculation Tax. On top of this, declaring rental income makes it harder to evade capital gains tax at the time of sale of as secondary property.
Conclusion
The BC Speculation and Vacancy Tax has been reported to affect about 32,000 homes, about 20,000 of which will be British Columbians with the remaining 12,000 foreigners or residents of other provinces, and generate around $200M in revenue. While we’re not certain where these figures come from, given our estimates above they actually seem pretty reasonable. We’re guessing about 8,800 properties will be considered vacant and non-exempt from the tax, overlapping with 46,000 properties owned by “foreign” owners and subject to the tax if left unattached to a decent rental contract. A sizable 45,000 households may be at risk of being identified (or audited) as satellite families, mostly living in pricey single-family detached (or suited) dwellings. As we note, around a third of these households will be headed by Canadian-born residents, but it’s likely many investor class immigrants will also be hit, and the vast majority affected will be in Metro Vancouver. Finally, the tax will probably generate a lot of revenue indirectly by increasing income tax compliance, quite possibly topping its direct revenue. We’ll be watching to see how it unfolds!
For those interested in more details on our methods, or people that would like to make different assumptions and continue to investigate along these lines, the code for the analysis is available on GitHub.