Checking in with Numbeo

For those interested in making international comparisons concerning rents and housing prices, Numbeo is a potential god-send. I say potential, because there are still some big data quality concerns. But the basic idea is sound: crowd-source estimates of rents and housing prices (as well as costs for all sorts of other things), both for the “centre” of cities and farther out. The end result is a real competitor to even iffier rankings for things like quality of life (looking at you Economist Intelligence Unit!) I’ve been playing around with crowd-sourced data again recently, so I was reminded of Numbeo and thought I’d take a look.

How is Numbeo holding up? And what can it tell us about current housing dynamics? First let’s see what Numbeo tells us about Vancouver, based upon 18 months of crowd-sourced data from 93 contributors (as of Oct 24, 2018):

RENT: Numbeo estimates that rent for a 1BR in the centre of Vancouver average about $1930.86 (CAD). This compares nicely to a listing informed estimate of $1950 for Vancouver 1BRs from Louie Dinh (confirmed as approximate for Downtown unfurnished apartments by a scraper who shall remain anonymous). This runs high compared to CMHC Rental Market estimates of rents for Downtown Vancouver ($1468), but that’s to be expected given that CMHC includes all renters, including long-timers protected by rent control. That said, the CMHC’s estimate for Downtown Condos rented out ($1900) is a lot closer (see p. 35 of report).  All things considered, Numbeo estimates strike me as reasonable for current rents on offer given the vague parameters (Vancouver centre).

PRICE: Numbeo estimates price per square foot for an apartment in the centre of Vancouver at $1,091/sqft. Looking around, this compares pretty reasonably – if a little low – with recent RE/MAX estimates ($1,195/sqft) and even better with realtor Steve Saretsky‘s handy reporting for Sept 2018 ($1,026/sqft). Worth noting that some lag may be expected given the 18 month reporting period from Numbeo.

INCOME: Numbeo estimates an average monthly net salary (after-tax) for Vancouver of $3,170/month. Looking at the Canadian Income Survey (CANSIM 11-10-0238-01), the average monthly after-tax income in 2016 was estimated at $3,042/month, and it’s surely gone up since. Again, seems pretty reasonable as an estimate.

I think it’s worth continuing to check in on Numbeo estimates, which may also vary dramatically from place to place, especially since the number of observers doing the crowd-sourcing also varies a lot (only 18 in Albuquerque!). But on the whole, Numbeo seems to be doing ok for Vancouver, the city I know best.

COMPARISONS: So if Numbeo data seems to be doing ok where I know it best, let’s do some comparisons! Here I provide some basic data for selected North American cities from Numbeo on one-bedroom apartment rents and price per square foot of apartments centrally located in select cities. From here on out, everything is reported in US dollars (just because it made things a little easier).

Price-Comparison-Numbeo-Oct-2018-B1

Cities are ordered by 1 BR centre rents, and the extreme high rent American cities – San Francisco, New York – lead the pack. It takes awhile to get to a Canadian city, starting with Toronto (right after Nashville!) before hitting Vancouver. After that, I pick out a few more of the big Canadian cities. I also add places like Honolulu (expensive resort city) and Albuquerque (one of my home cities!), just for kicks, and low-rent Montreal rounds out the pack at the bottom. Rent and price are correlated (r=0.84), but not perfectly. Strikingly, compared with American cities, all of the Canadian cities have higher prices than one might predict based upon their rents. Of cities examined here, Vancouver ranks 4th highest in price, but 17th in rents.

What happens if we add incomes into the picture? Below I take the same cities and divide both rents and prices by incomes to get simple estimates of relative housing costs. Now the familiar (to Vancouverites) pattern emerges of Vancouver being the priciest real estate in North America, followed by New York and Toronto. Canadian cities look pricey in no small part because our after-tax incomes look relatively low compared to Americans. Rent-wise the story is a bit different. New York and Miami lead the continent, followed by Vancouver, Toronto, LA, San Francisco, and Boston, all hanging reasonably close together.

Price-Comparison-Numbeo-Oct-2018-B2

Relative to income, there’s no doubt both Vancouver and Toronto are expensive places to live in North America. But these are also places with a lot of international immigration. Immigrants make up nearly half the population of Toronto (46%), followed closely by Vancouver (40%). And immigration is increasingly Asian, especially in Vancouver. As I’ve pointed out before, it’s also useful to put Vancouver – in particular – in the context of the broader Pacific Rim.

Here’s base rents and prices (USD), drawn from Numbeo.

Price-Comparison-Numbeo-Oct-2018-B3

San Francisco still leads by rent, but it’s got nothing on Hong Kong when it comes to price. Notably, the price per square foot for apartments in Shanghai, Beijing, Seoul, and Shenzhen are also more expensive than in San Francisco. Add Tokyo and Taipei to the list of Pacific Rim cities with more expensive prices than Vancouver. This helps put Vancouver’s prices into context. Compared to most cities of the Pacific Rim, we’re still cheap. And lots of people are probably coming here with real estate money in their pockets from holdings they’ve sold (or in some cases held onto) back home.

Let’s run the same comparison checking in on income.

Price-Comparison-Numbeo-Oct-2018-B4

Compared to incomes, Vancouver stands out for its pricey real estate in North America. But again, in the broader context of the Pacific Rim from whence many of its immigrants arrive, Vancouver still looks cheap. Real estate is crazy expensive in Hong Kong and the major cities of Mainland China. It’s only slightly less expensive in Taipei and Seoul. Vancouver and Tokyo look quite similar.

The picture for rents is less dramatic than for purchase, and also holds different possible lessons. Average rents for available apartments are still crazy high in Hong Kong, Shanghai, Beijing, and Taipei, consuming over two-thirds the take-home pay of the average income earner. But rents aren’t far behind in Vancouver, San Francisco, and LA, which all hang close to ratios for Shenzhen and Guangzhou. There are a lot of high rent Pacific Rim cities. As I’ve argued before, rents are probably the most important thing to focus on in terms of insuring people can live in our cities. But it’s worth noting that available 1 BR rents take up under 40% of average incomes in Seoul and Tokyo. What might they be doing right in terms of taking care of renters that other Pacific Rim cities could emulate?

At any rate, as before, I’d love feedback on Numbeo numbers! They’re already showing up in academic papers. Do they look right to you? Way off? Better or worse than last time I checked in?

Hit me up with your thoughts!

Addendum: If you want to play around with my data download & the excel sheet I used for the above, here it is: Numbeo-Look-Oct-2018-B  Note that the income data from Numbeo was hand entered, because I couldn’t find a central source for it, unlike the pricing data by City.


Urbanism Axis & IMBY Allies

Last post I talked about how Vancouver’s election provided possible insights into the relationship between Urbanism (or IMBY-ism) as a political axis running perpendicular to more traditional Left-Right axes. Now we have results!

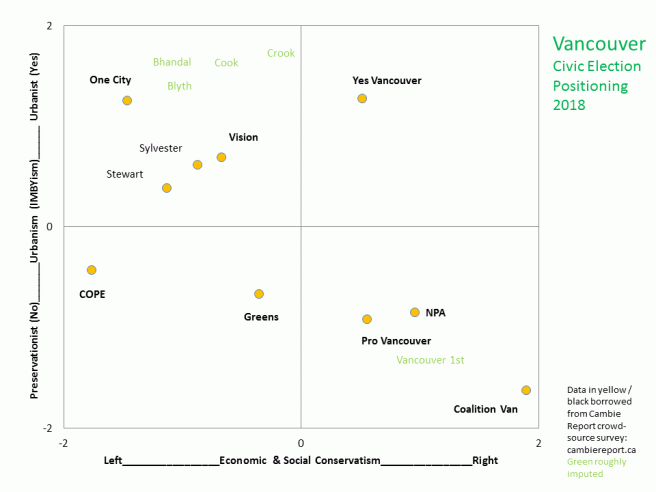
But first: a clarification. Initially I drew from the Cambie Report‘s clever crowd-sourcing of placements for political parties and prominent independents in Vancouver along both a municipal urbanism axis and social and economic left-right axes (ultimately combined), as follows.

Election-2018-positions1

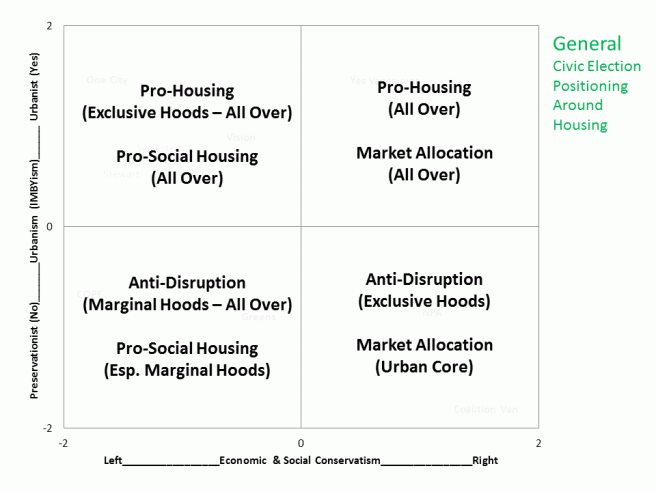
Positions were allocated (and defined) by the wisdom of crowds. Not surprisingly, I received some pushback for accepting this wisdom – not everyone agrees with crowds! And that’s fair. Many policy positions and histories, especially within my area of housing, were actually more nuanced. Here I’ll provide a – still very rough – breakdown of how I see the axes providing important information about different positions and histories, which may be of use both for interpreting Vancouver and thinking through IMBY coalitions more broadly.

Election-2018-positions5

Starting with the Urbanist Right in the upper-right quadrant, we have a relatively familiar market urbanism: anti-zoning and libertarian inspired. Pro-housing everywhere “the market” wants it. Market urbanists tend to extol the virtues of density and disruption. YIMBY everywhere.

Moving clockwise, below we have the Preservationist Right. To add a bit of nuance, this is a position that I’ve argued actually much better characterizes the North American tradition: Rigid zoning for exclusive single-family neighbourhoods and more flexible market allocation of housing within a constrained urban core. Right leaning municipal coalitions offer a grand bargain between middle-class detached homeowners’ relatively conservative desires to be left alone and developers’ interests in making money downtown. The mantra goes something like: “Strong protections for me and the market for thee.” Or NIMBY in the Great House Reserve, YIMBY in the Urban Core.

Continuing around the clock to the Preservationist Left, we move toward the left-leaning reaction against the North American tradition. Anti-poverty alliances frequently identify developers as villains. This makes sense insofar as many alliances have borne repeated witness to the displacement that can result from unleashing market development upon the marginalized neighbourhoods of the urban core. Anti-developer politics can seem like a progressive end in their own right and can sometimes also win over middle-class voters (think “All neighbourhoods matter”). For a farther left subset, the socialization of housing seems the best bet for protecting those marginalized by the market. Lots more social housing is in order – but often concentrated in and meant to preserve neighbourhoods viewed as under development pressure. The orientation runs from NIMBY everywhere to PHIMBY (Public Housing in My Back Yard).

Moving up to the Urbanist Left, we find alliances that often view urban growth as good, both in terms of promoting diversity and in terms of reducing environmental impacts. Many accept that disruption is part of living in a city. But it shouldn’t be imposed unequally and policies should work to avoid displacement. Those I’ve also termed Inclusive Urbanists set their sights on returning exclusionary neighbourhoods to the urban fabric by reforming single-family zoning. They look to introduce social housing and diverse rental options to every neighbourhood. The tendency is YIMBY, but reform-oriented, with an egalitarian emphasis directed at diversifying single-family exclusionary hoods and large helpings of PHIMBY.

Ok, now let’s get back to what happened in Vancouver, where we had parties occupying each of these quadrants. Who won? And what does it tell us about IMBY-coalitions?

Let’s start with mayor.

Election-2018-positions6

The mayoral race ended up a showdown between two strong Urbanist Left candidates (Kennedy Stewart and Shauna Sylvester) and the strongest of the Preservationist Right (Ken Sim from the NPA – historically the epitome of the grand bargain party: NIMBY for detached home-owners, YIMBY in the urban core). Stewart beat Sim by less than a thousand votes (half a percentage point) in a real squeaker of a race.

Broadly speaking, both the Urbanist Left and the Preservationist Right fielded strong candidates. But what happened to the Urbanist Right and the Preservationist Left? The Urbanist Right candidate was clearly Hector Bremner, and at 5.7% of the vote, his Yes Vancouver party failed to attract much support beyond its passionate young base of market YIMBYs. The Preservationist Left initially had a party-supported candidate in COPE’s Patrick Condon (who early on made clear he wouldn’t run if the Green Party’s Adriane Carr had decided to try for the mayorship). But Condon dropped out after experiencing a stroke. Late in the race he endorsed independent candidate Sean Cassidy, who failed to attract much other support. Even adding in support for the fringe candidacy of IDEA Vancouver’s Connie Fogal (widow of progressive hero Harry Rankin), the Preservationist Left failed to crack 2% in the mayoral race.

So can we collapse the field, calling YIMBYism a left-wing phenomenon and NIMBYism mostly driven by more conservative impulses? Not quite so fast… let’s turn to Council! Here I note the average % of total council votes accorded to candidates in each party, highlighting the parties that actually won council seats (no independents won seats, despite overall respectable showings). I also provide the range of averages for major parties in each quadrant.

Election-2018-positions7

While the mayor’s race seemed to reduce relatively neatly to a singularly important Urbanist Left – Preservationist Right axis, the council race sees a real and strong split between the Preservationist Left (COPE and the Greens) and the Urbanist Left (OneCity and Vision), with the Preservationist Centre-Left ultimately receiving the most support. Indeed, the new council will be made up of five members from the Preservationist Right (NPA), four members from the Preservationist Centre-Left (three Greens and one COPE), and one member from the Urbanist Left (OneCity).

So what does this all this tell us about IMBY coalitions?

First: it’s important to distinguish those BYs: the backyards of Single-Family House neighbourhoods are treated differently from the backyards of the Urban Core.

Second: Right-leaning coalitions tend to do well in cities only when they leave the back yards of Single-Family House neighbourhoods alone. So far there’s little evidence that a right-leaning YIMBY coalition can win, though this could change in the future, as single-family neighbourhoods continue to lose population.

Third: Most YIMBYs lean left by quite a large margin, and left-leaning YIMBY coalitions can win. A Lefty Urbanist won the mayoral race in 2018, despite the competition from an exceptionally strong contender in the same quadrant. Moreover, Vision Vancouver’s coalition held power for the last ten years until their organizational implosion in 2018, and still placed well ahead of most other parties even if they won no seats.

Fourth: There’s a real and consequential split between Lefty Urbanists and Lefty Preservationists. I think this is often about perspective. From the point of view of anti-poverty activists working in the urban core, developers almost always look like villains (non-profit developers MAY be exceptions). From the point of view of people feeling excluded from cities’ vast tracts of single-family neighbourhoods, developers look like potential allies. On the flip side, the path to political success often runs through middle-class homeowners, and it’s easier to get them on your side by promising it won’t inconvenience them much than by suggesting they might need to sacrifice some parking or sunlight on their gardens. Vancouver’s Green Party, in particular, has walked this line to great success.

Theoretically, this election should put to rest the notion that all or even most YIMBYs are mostly market-oriented. After all, if they were they would’ve come out in mass for Yes Vancouver. Instead YIMBYs seemed to support Urbanist Left candidates in numbers easily surpassing support for the Urbanist Right. But to be fair, this was also a really messy election, witnessing the organizational implosion of the reigning party (Vision) and a confusing profusion of new parties. This likely benefitted those older organizations that managed to avoid imploding (Greens, COPE, and above all the NPA, who recovered strong from a shaky start), above and beyond informed platform comparisons.

Final Question: Can those Urbanist Leftys who made it into office this year work with their Preservationist Left or Preservationist Right colleagues? I’m guessing efforts to Make Room in single-family neighbourhoods are going to slow down again after Vision’s successful last-minute drive to introduce duplexes (with suites!), opening up all nearly all lots to four potential dwelling units (2x owned, 2x rented) across the City. Given housing plans put forward by the NPA and Greens, maybe we’ll eventually get matching legalization of an additional main unit rental suite (1x owned, 2x rented, 1x laneway rented), legalizing what’s already happening on the ground in many places. It’s less clear what will happen in the urban core, where alliances may shift project by project (remember, NPA councillors look pretty market YIMBY outside of single-family zones).

Let’s animate that GIF:

Election-2018-outcome-anim


Addendum: (preliminary) vote tallies from the City of Vancouver obtained here! Looking forward to the voting location breakdown we got from the 2014 election.


A Very Imby Election

Vancouver’s heading into an exciting municipal election!

Yes, yes, it’s exciting in all the normal ways elections are exciting: rah, rah, I really want my team to win! Strategy, strategy, wonder what messaging will work? Etc. (I’m a bit of a political junkie).

BUT this election is also super interesting to me as a major test of backyard building (-IMBY) coalitions and positioning. There are parties that tend toward Yes! build more housing in-my-backyard (YIMBY), and there are parties that tend toward No, No, No more building in-my-backyard (NIMBY). What’s great about this election is that there are SO many parties involved that we can actually fill out a scatterplot of IMBYism positioned within more traditional left-right coalitions. The folks over the Cambie Report did a bang-up job of illustrating this, with their crowd-sourcing of positioning for the parties (and major independent mayoral candidates). Borrowing from their crowd-sourced scoring of party and major mayoral candidate positions (but centering the scores and inverting the urbanism scoring), here’s pretty much what the political landscape looks like:

Election-2018-positions1

The election is very exciting because there’s someone in every corner! Assuming everyone shares these perceptions of the parties and they’ve been able to get their message out, we get a real test of how urbanist welcome (YIMBY) coalitions line up with more traditional left/right divides in terms of voting strength.

Do most (voting) free-market fiscal conservatives vote YIMBY? We’ll be able to compare the Yes Vancouver! vote relative to the NPA/Pro Vancouver/Coalition Vancouver vote to find out. Are most NIMBY voters progressive-leaning or conservative-leaning (or somewhere in the middle)? We can look to compare COPE to the N/P/C vote to the Greens. Do left-leaning YIMBYs outnumber left-leaning preservationists? Compare OneCity & Vision turnout to COPE/Greens.

And just who makes up YIMBY coalitions anyway? This, I think, is perhaps the most interesting question, primarily because debates sometimes frame YIMBYs as anti-regulation free-marketeers, when in fact there appears to be a rather large group of re-regulation socialist-friendly YIMBYs out there. This election should provide some insight into just how large these different facets of YIMBY coalitions might be by comparing OneCity & Vision votes to Yes Vancouver votes. Fun!

Of course, there’s also bound to be a lot of noise. The chaos in this election suggests that low-information voters, in particular, may fall back on familiar rubrics, perhaps benefiting parties that have been around awhile (NPA, Vision, Greens). The Greens, in particular, may benefit from their mixture of party recognition at other levels of government and progressive sheen mixed with centrist positions historically appealing to many homeowners (there’s a reason Carr was the most popular candidate in the last election). There are also real efforts underway to retain the strength of more traditional left-right divides, at least on the left, where the Vancouver District Labour Council (VDLC) has attempted to broker an alliance. (Does Labour have a stake in this election? Oh yes! Lots of contracts coming up…)

Election-2018-positions2

In order to form their slate, the VDLC had to choose between the two mayoral candidacies of Sylvester and Stewart (setting aside left-leaning alternates like Campbell and Condon, who’ve now dropped out). They chose Stewart, previously an NDP parliamentary politician representing nearby Burnaby. You can scroll through their fancy collector cards (cute gimmick!) on twitter.

In addition to the more organized efforts of parties and labour organizations, it’s worth noting that this year’s election is just a bonanza of independent candidates. Aside from Stewart and Sylvester, the two serious independent mayoral candidates, there’s just a ton of independent council candidates. I can’t fit them all on here, but just to demonstrate a couple of candidates (and a party) missed by the Cambie Report survey, I’ll estimate positions from following folks on twitter as below.

Election-2018-positions3

Bhandal has positioned herself close to OneCity. Cook and Crook are proud YIMBYs and look closer to somewhere between OneCity and Yes Vancouver. Blyth has mostly focused on calling attention to the opiod crisis (to her everlasting credit!) but also seems to have placed herself (or been placed) close to OneCity. Altogether, you could fill out significantly more quadrants using independent candidates. (I just don’t have the time or energy to do it!)

So… where do I fall? Relying heavily on my read of Iris Marion Young’s* brilliant Justice and the Politics of Difference, and in particular, her understanding of the City as an Ideal for Justice, I very clearly fall into what I’d call the “inclusive urbanism” camp, exemplified by OneCity (note: it’s possible I have a sign supporting OneCity out on my balcony right now). I swoon over their campaign slogan of Every Neighbourhood for Everyone. And what do you know, when you add in independents, there’s enough other candidates in that quadrant to fill out a whole ballot! This includes the reigning Vision party, who in my view does not get enough credit for tacking against the broader North American winds to move Vancouver in a more inclusive and urbanist direction.

Election-2018-positions4

That’s not to say there aren’t lots of other good ideas floating around out there in urbanist camps (hi Yes Vancouver!), and good energy in other left-leaning parties (COPE gets full credit for making politics built around fighting class inequities look like fun!) Speaking of fun, I’m gonna do an animated gif thing to round things off. Here you go.

Election-2018-position-animated

Some Related Takes:

Cambie Report Data: google doc

Tom Davidoff‘s gradesheet approach: google doc

Christopher Porter’s (nicely done!): housing platform comparison

Allen Pike’s: breakdown


*- Worth noting: Iris Marion Young practically takes an anarchist stance on zoning: that it challenges the urban diversity she dearly wants to foster. As I discuss in my book, I’d rather reform zoning than abolish it, but overall she’s not wrong. She also thinks all planning should be done at a regional level (kinda like Metro Vancouver!).