
(co-authored with Jens von Bergmann and cross-posted at MountainMath)
In a previous post we looked at the history of planning regimes in the City of Vancouver. Similar shifts happened in other municipalities in the region, and they also fit into a broader shift in planning at the regional level. Regional level planning is less concerned with zoning and the regulations that govern housing production, and more with coordinating services and the broader guiding principles applying to municipal policies. Service provision means regional level planning has an interest in keeping track of population. But how far does that interest go?
First let’s take a look at our history of regional population growth, shown here for the Vancouver Census Metropolitan Area (CMA). The Vancouver CMA now matches governing level of the Greater Vancouver Regional District (GVRD) recently rebranded as Metro Vancouver, but this has not always been the case. Moreover, even the Vancouver CMA boundaries have changed, experiencing an expansion in 1971, and we break the census count timelines at 1966 based on the respective census geographies.
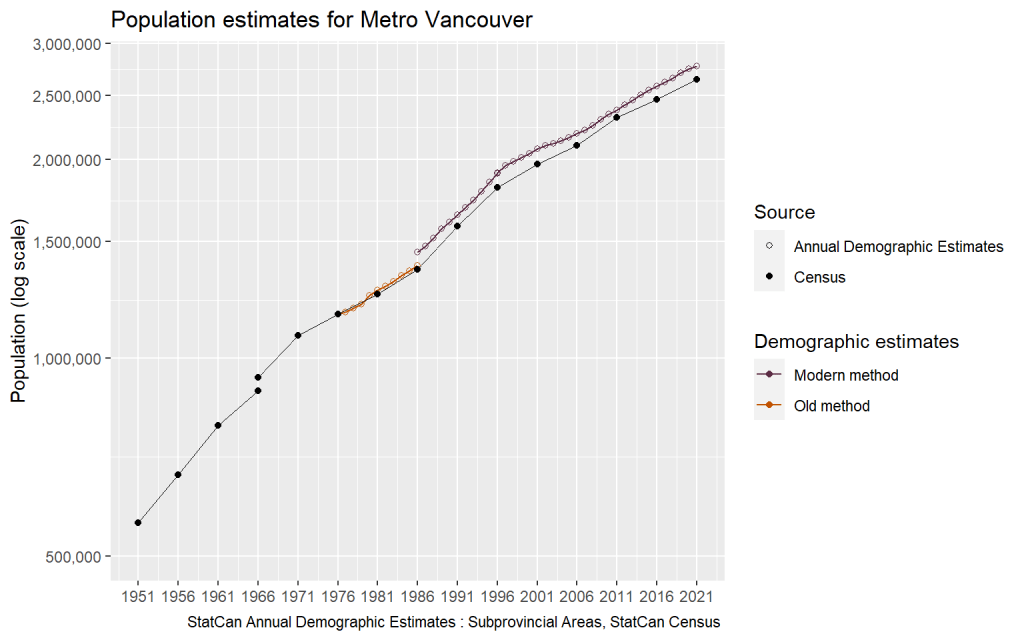
Some of the intricacies of measuring population, let alone projecting its future growth, become evident in this graph. Geographic extent, census count procedures, and population estimation methods all matter. We also note that the growth rate has varied, and shows several inflection points, including a slowing of the growth rate in 1971, an increase in the growth rate in 1986 and a slowing again in 1996. This population history brings us back to consideration of the history of regional planning.
Regional planning bodies sit between the provincial and municipal levels. Their structure is governed by the province. In BC they have been set up as federations of municipalities, with dedicated staff responding largely to the politicians elected to represent each contained municipality. The Lower Mainland Regional Planning Board (LMRPB) began operating in this capacity in 1949, mostly in response to catastrophic flooding all along the Fraser River the year prior. The province set up regional districts more broadly in 1965, but then subdivided the LMRPB in 1969 into four separate regional district governments, including the Greater Vancouver Regional District (GVRD), recently renamed Metro Vancouver (more on Metro Vancouver governance here).
There are several good overviews of the history of Vancouver regional planning, including Metro Vancouver’s own Creating Our Future: The History, Status, and Prospects for Regional Planning, Tom Hutton’s look at the regional planning between 1976 to 2011 and the entertaining if somewhat more partisan City Making in Paradise. The latter, written by former mayor and NDP premier Mike Harcourt in conjunction with Metro planner Ken Cameron and reporter Sean Rossiter, makes the case that the shift from LMPRB to GVRD was politically motivated and consequential, especially for planning around ports. In this post we want to take a different angle with a focus on housing. In particular we want to look at shifts in planning objectives in relation to housing that occurred between the 1966 regional plan (under the LMRPB) and the 1975 regional plan (under the GVRD). We’ll argue that these shifts were similarly consequential.
A Comparison of Key Goals and Strategies
| 1966 Official Regional Plan | 1975 Livable Region Plan | |
|---|---|---|
| 1 | The orderly, staged, and diversified development of the Region, its communities and its resources. | Achieve Residential Growth Targets in Each Part of the Region. |
| 2 | An environment that provides for the health, safety, convenience, and satisfaction of the people living, working, visiting, and playing in the Region. | Promote a Balance of Jobs to Population in Each Part of the Region. |
| 3 | The utilization of land in the Region for its most suitable use. | Create Regional Town Centres. |
| 4 | A transportation system that provides for the efficient movement of goods and people between the many parts of the Region. | Provide a Transit-Oriented Transportation System Linking Residential Areas, Regional Town Centres and Major Work Areas. |
| 5 | A sound Regional economy including a broad range of employment opportunities throughout the region. | Protect and Develop Regional Open Space. |
The 1966 Official Regional Plan
In 1952, shortly after the creation of the LMRPB with its mandate to “prepare plans for the physical development of the region,” the Planning Commission published The Lower Mainland looks ahead report. It describes the basic conditions of the lower mainland, a largely resource-driven economy at the time, and lays out some principles to guide development. After collecting considerably more information in conjunction with consultation, the work of the LMRPB accumulated in the 1966 Offical Regional Plan, which established a “guide for development, both public and private, in the Lower Mainland Region.”
The objectives of the 1966 LMRPB plan are laid out in the table above. The parts pertaining to residential development laid out a broad plan where development should be encouraged, e.g. the development of “compact regional towns” with surrounding areas developed via “staged expansion with subdivision”. Subdivision of land was to be strictly limited in absence of water pipe and sewerage extension. At the same time the plan forbid developments in the floodplains, except in parts “committed to urban development through early settlement, in which case further development for URBAN uses shall be contingent upon floodproofing.” The plan had little to say directly about housing relative to other “URBAN” uses of land, except that areas considered for expansion of the urban footprint should not be allowed to develop into multi-family residential forms. Within the existing urban footprint, municipal authorities were left to do pretty much as they wished, at least as long as they invested in protection from flooding.
The authority of the LMRPB was to be short-lived. The Lower Mainland Regional Planning Board dissolved in 1968 and was replaced with the four regional bodies spanning the Fraser Valley, with the largest being the Greater Vancouver Regional District (GVRD). These bodies would collaborate on a 1980 Plan, but otherwise governed their affairs separately. The end of the LMRPB may have followed simply from the expanding regulatory interests and capacities of the province, or it may have derived from the personal animosity of the premier at the time, as in the telling of City Making in Paradise. Either way, the premiership of W.A.C. Bennett wouldn’t last much longer than the LMRPB as the 1970s ushered in the tumultuous rise of new political powers both in the City of Vancouver (TEAM) and across the province of British Columbia (NDP).
The 1975 Livable Region Plan
The new GVRD began their planning efforts within a very different context than the old LMRPB. The new political parties in the province and local municipalities rode to power in part on the strength of resistance to development (see our discussion of the rise of a Spot Discretionary Regime in Vancouver). The NDP solidified the protections for agricultural land encouraged by the old LMRPB through formalization of the Agricultural Land Reserve, constraining further outward expansion of the region’s urban footprint. The culture within planning had changed as well, embracing many of the critiques launched by reformers like Jane Jacobs, and turning toward public consultation for solutions. Local activist planners like Walter Hardwick and Darlene Marzari circulated between academic, professional, and political positions. Of note, where the leading edge of the Baby Boom had just turned 20 by the time of the 1966 report, their demographic impact on housing demand was really picking up by the 1970s. Into this new moment, the GVRD launched a new consultation-heavy planning process, culminating in the 1975 Livable Region Plan, intended as a blueprint to carry metropolitan Vancouver forward from 1976 to 1986. Housing would figure prominently. But the document would place fears about growth front and centre in its introduction.
We have tried to make proposals rooted in the hopes and fears of the people living here who seem to have a modest but challenging dream: let Greater Vancouver continue to be a good place to live. Their fear is that growth will spoil the Region, and that governments at all levels cannot or will not act to maintain livability in the face of growth.
While the 1975 Plan pointedly avoided a statement on whether growth was good or bad, GVRD staff began presenting policy proposals to their Board in 1974 for “bringing the overall growth rate under control.” The 1975 Plan summarized the bases for a shift in direction.
Based on this series of studies, public meetings and seminars, the Board has adopted the following policy changes:
- Overall Growth Rate: From a policy of accepting all growth that comes, to a policy which recognizes that the overall rate of growth is capable of being controlled, but not by GVRD alone.
- Sharing Growth: From a policy of accepting natural growth trends to a policy of determining the amount of growth each part of the Region can accommodate.
These key shifts show up in the first strategy forwarded by the 1975 Plan. The “growth targets” represented not aspirations, so much as caps, and the plan called very explicitly to limit population growth by rationing housing throughout the region. The plan elaborates on point 1 from the table up top:
The overall growth of the Region to 1986 should be shared among the municipalities on a rational basis. We propose population growth targets for each part of Greater Vancouver, based on 13 livability concerns such as the preservation of open space and recreation areas, minimizing travel time and inconvenience, and minimizing disruption to existing communities.
By contrast, strategy point 2 signaled a milder departure from the previous emphasis on economic development by subjugating jobs growth to the location of residential developments, indicating an eagerness to fragment the job market. As assessed by Tom Hutton “the idea of ‘deflecting’ office development from downtown Vancouver to the suburban RTCs suggested a naïve understanding of how commercial property markets operate, and more specifically the power of agglomeration in office location”. Points 3, 4, and 5 connected even more closely with prior goals from the 1966 LMRPB plan.
Transforming a Projection into a Gate
In short order, the population targets of the 1975 GVRD Plan took a relatively crude set of population projections, lowered them, and turned them into a gate to control growth. The targets were couched in pseudo-scientific language and mechanisms that partially obscured the severity of the shift to population control as a objective of metro planning. The “rational basis” for the targets took the annual population growth rate between 1971 and 1976 (using population estimates for 1976) of 3.2% and reduced it to 2.1% for the next 10 years. The document grouped municipalities into sub-regions of the GVRD, and compared 1971 population counts from the census with estimated 1976 population estimates to project out “trends” to 1986.
The actual data work in the document remains opaque; the “trend” extrapolations given in the document follow neither geometric nor arithmetic population growth trends, with the region-wide growth rate explicitly fixed to the lower rate of 2.1% and the municipal trend adjusted to fit this in some obscure way that results in an increased trend for some municipalities and a decreased rate for others.
The 1975 Plan then proceeded to modify the regional trends according to ten criteria “based on opinions of the GVRD Planning Committee and the reports of the citizens’ advisory Policy Committees” that were translated into numeric population targets “with the help of a computer program”, but did so in way that left the (previously lowered) overall projected population for 1986 unchanged.
The plan did not explicitly translate these population targets into housing targets. The conversion of the population targets to housing units and floor space quotas was left to individual municipalities. Strikingly, at the same time as the plan set growth targets it also acknowledged a worsening of housing outcomes:
For the last few years we have had a shortage of affordable housing, especially rental housing. This shortage has helped to push up rents and house prices, and caused an increase in doubling- up and crowding of households in existing accommodation. These effects strike hardest at the poor, people who are in large part not newcomers to Vancouver.
The 1975 Plan presciently continued to explain how reducing growth via their new gates would adversely affect housing outcomes, in particular for lower income groups.
Trying to keep out newcomers by reducing the amount of housing will only hurt our own lowest income groups more, and perhaps not stop very many newcomers.
Modeled on consultation only with existing residents, the 1975 Plan emphasized that it was not concerned with the fate of newcomers. But limiting housing would also hit the existing population.
Such a policy would make Greater Vancouver a lot less livable for many people who are already here, and our objective is to maintain livability for all who live in Vancouver.
The report did not provide a clear justification for how it arrived at its overall population projections, other than applying a lower growth rate than observed in the recent past. It justified the reduction with concerns about population growth while acknowledging that reducing housing development would hurt housing affordability, in particular for lower income people, which it claimed constituted a concern. To resolve this apparent contradiction the 1975 Plan suggested that:
regional and municipal officials can work with senior levels of government to influence immigration and other factors which affect overall population growth.
More explicitly it suggested the federal government should:
- work with provincial and regional governments to create a settlement policy for the country, just as the Regional District is working with its municipalities to develop a settlement policy in the Region,
- co-ordinate immigration policy with the national settlement policy when it is developed,
- work to create growth centres outside of the fast-growing metropolitan areas, as part of the population settlement policy,
- finance and participate in a study with the GVRD on the impact of immigration on the Vancouver Region.
Of note, these suggestions for controlling the growth of cities look strikingly similar to those put forward by Harvey Molotch’s influential “Growth Machine” paper within Sociology, published in 1976.
All of the work of the 1975 Plan happened against a backdrop of already high housing prices, signalling pent-up demographic demand for housing both from suppressed households in the region as well as migration pressures. Planning ahead for this demographic demand would suggest scaling up the development of housing. But the 1975 Livable Region Plan did just the opposite, attempting to install a gate to control further growth.
The idea that the federal government should adjust immigration policy to fit the regional preference to build less housing instead of fitting the housing strategy to accommodate federal immigration policy is a theme in media and municipal policy-making that carries on through this day. As noted above, there were a lot of things happening in the 1970s, including a resurgent neo-Malthusianism directly referenced by the 1975 Plan. But it is possibly no coincidence that local calls to adjust federal immigration policy grew in conjunction with a more open shift in immigration policy and the arrival of many more immigrants from outside Europe and the United States, as evidenced in the graph below showing the makeup of the foreign-born population in each census year.

Targets vs actuals
Did the gate work? It’s always useful to check, after the fact, how targets compare to actual population growth. While municipal representatives to the GVRD expressed supported for limiting growth, it’s not clear the targets were at all binding, especially after regional plans were effectively nullified through provincial restraint bills in the 1980s. Perhaps more pressingly, there were no clear guides for how to translate population targets into housing approvals, especially given instability in household sizes. It’s doubtful any authorities adequately monitored how population aging and changes in family formation and childbearing implied more housing was going to be needed for every future person added to the population in the years to come.
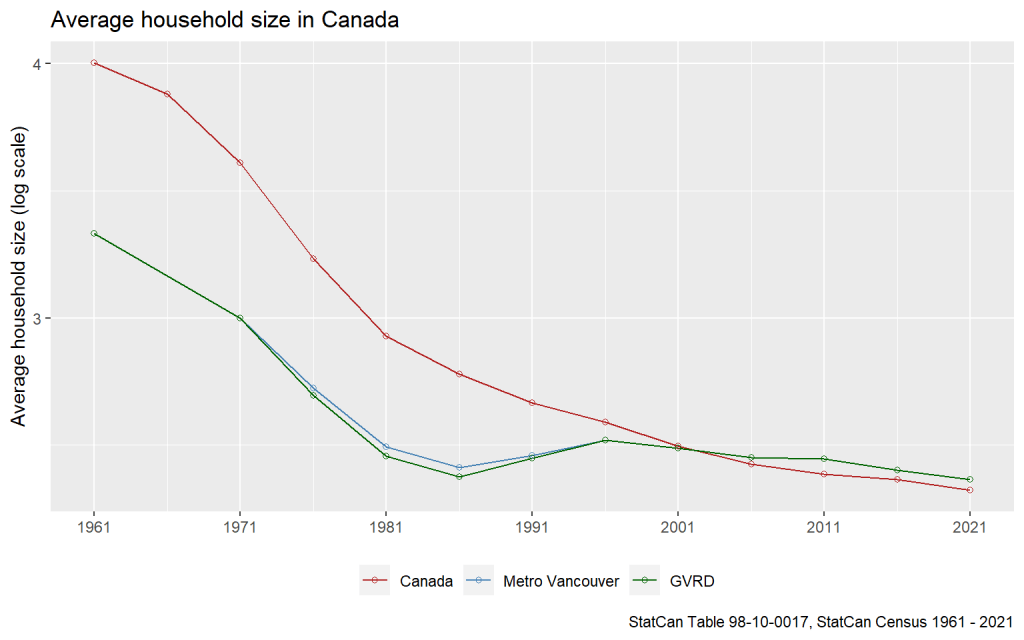
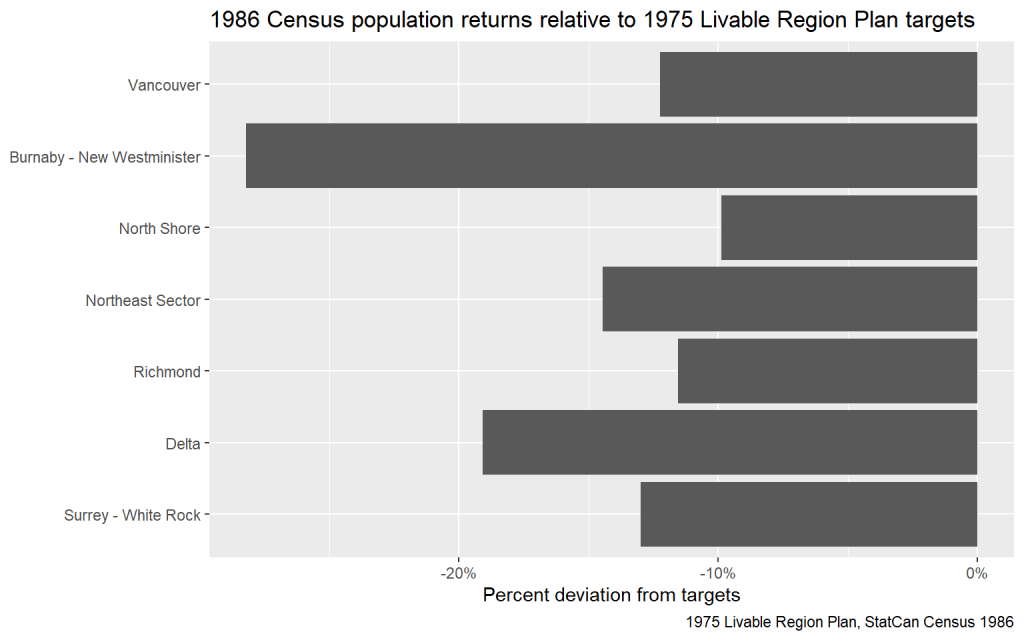
Where an average dwelling might have contained nearly 4 residents in Canada in the 1960s, this figure dropped below 3 by the 1980s. While households were smaller in urban areas like Metro Vancouver, the fall in household size was similar precipitous in the lead up to 1976. But by 1986, household size began to rise again, with sizes in Metro Vancouver ultimately rising above the average for the rest of Canada (see also our post on age-specific household maintainer rates during these years). Overall it’s likely that the fuzziness of the methodology to set population targets, and the lack of guidance on how to translate these into housing units and approvals, led to all sub-regions, with the exception of the very small “Other” region (not shown in the graph below), failing to meet even their lowered GVRD targets by wide margins.
In conjunction with the planned reduction relative to the pre-1971 growth rate this further reduced the average annual growth between 1971 and 1986 that was actually achieved to 1.4%. One interpretation might be that the gate worked even better than planned. But many things were happening in the 1970s and 1980s, including rapid inflation, enormous hikes in interest rates, and a major recession that hit BC especially hard. So it’s probably too soon to celebrate or condemn the success of the Livable Region Plan’s gate.
Subsequent regional growth strategies
If the 1975 Plan attempted to transform a projection into a gate, subsequent plans would take that gate and elaborate upon it until they could pretend it was a projection again. The initial haphazard way in which population trends were projected into the future, and then linked to targets, was partially professionalized in subsequent iterations of the regional growth strategy and related planning documents. At the same time, equity concerns largely shifted from broader social equity to more specific inter-municipal equity. Regional planning documents downplayed recognition and concern that limiting housing could have large negative impacts on affordability, particularly for low income households. Illustrating these shifts, the 1996 GVRD plan attempted to take changing household sizes into account, but also took population trends and targets a step further to estimate “growth capacities” out to 2021, including separate capacities for ground-oriented and apartment households. The 1996 GVRD plan took a more pessimistic view of the prospects for controlling growth, but slowing and/or managing growth remained on the table, with little discussion of negative consequences.
Experience around the world has shown that population growth cannot be stopped by rules and regulations. Even slowing growth is a challenge with many possible consequences. However, we are able to manage growth in a way that preserves the essential qualities that make our region such a special place.
Aside from minor shifts, the basic methods of projection and target setting have remained the same through the present. The Regional Growth Strategy does not engage with the question of demand for housing, but instead relies upon mechanistic population “projections” that naively extrapolate past patterns. In doing so, the Regional Growth Strategy continues to systematically enshrine past housing shortages and worsen them, although the technical machinery to do this has advanced considerably.
In effect, the technical machinery excludes everyone pushed out of the region in the past. The only ones who count are those who make it into the region and manage to stay in the region despite the growth reduction efforts of local authorities. The technical machinery also casts realized household size as perfectly matched to preferences. Everyone stuck living with their parents’ or in bad roommate situations is treated the same as if they were living out their dreams.
City Development and Regional Planning Regimes
We can now place a rough periodization of Regional Planning Regimes alongside our earlier periodization of City Development Regimes. Lack of regional coordination was linked to a permissive development regime through City and Metro’s earliest years. The City shifted in a more regulated regime first, adopting zoning as a key tool by 1931, primarily aimed at coordinating growth. The Region organized only after the 1948 flood, similarly focused on coordinating growth for major infrastructure. The City shifted to a Spot Discretionary Regime, whereby development was much more tightly controlled by 1972. Metro shifted toward a similar controlling stance, attempting to install gates to slow and manage growth, right around the same time.
| City Development Regimes (Vancouver) | Regional Planning Regimes (Metro Van) |
|---|---|
| 1886-1931 The Permissive Regime | -1949 No Regional Regime |
| 1931-1972 The Zoning for Growth Regime | 1949-1968 The Infrastructure for Growth Regime |
| 1972-Present The Spot Discretionary Regime | 1968-Present The Gate Management Regime |
Managing regional allocation
The gating work done by Metro Vancouver projections also remains tied to separate and managed allocation for each municipality. Allocations are partially informed by past trends, but also by evolving calculations of “land use capacity” linked to municipal community plans and inter-municipal negotiation. The results are complex, retaining some focus on the encouragement of compact urban communities (where we still see targets), but also essentially guiding housing and population growth into regions where there’s the least political resistance instead of focusing on demand for where people want to live. Exclusive and exclusionary municipalities are effectively encouraged to stay that way.
To understand the fundamental problem with how the Metro Vancouver growth strategy allocates housing targets to municipalities, consider how the Regional Growth Strategy to 2040 projections in the following municipalities stack up against actual growth over a ten year time period. Here we gloss over the issue with census undercounts, implicitly assuming that the ratio of the undercounts in each municipality did not change between the 2011 and 2021 censuses.
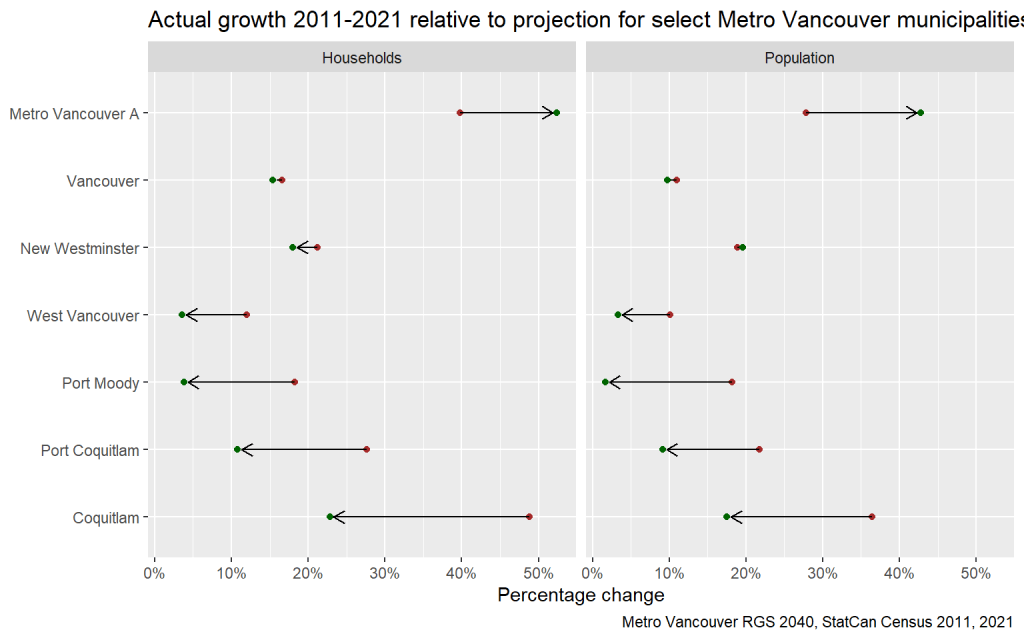
Take Metro Vancouver A, the area around UBC. Population growth was substantially higher than projected, and this is entirely due to more housing getting built than projected. For the City of Vancouver, population growth came out very close to projections. Does that mean that Metro Vancouver properly estimated demand to live in the City of Vancouver? Of course not, prices and rents rose enormously over this period. It’s simply because the City of Vancouver built as much housing as Metro projected it would; it’s a self-fulfilling prophecy. Similarly for West Vancouver, Port Moody, Port Coquitlam, and Coquitlam the population came in significantly short of projections not because people don’t want to live there, but because the municipalities failed to build the projected amount of housing.
This raises two questions:
- Why stick to flawed methodology for projections?
- Do projections and targets from the Regional Growth Strategy matter, or do municipalities do what they want anyway?
We will look at these in reverse order.
Do RGS projections matter?
The Regional Growth Strategy housing targets aren’t binding for municipalities. While some go over the targets, most stay below their targeted growth. Metro Vancouver does at times exert pressure if it feels that contained jurisdictions divert too much from their targets, as happened when UBC wanted to build more housing than what the Regional Growth Strategy called for. But there is little Metro Vancouver can do if municipalities decide to ignore targets. So how do they matter in maintaining and reinforcing our housing shortage if it all come down to municipalities?
While it’s up to the municipalities how much housing to build, the Regional Growth Strategy plays two important roles. Individual municipalities have little chance to make a serious dent in the housing crisis by increasing the rate at which they add housing. It’s an uphill battle to start with given how large our housing deficit is, but if other municipalities are pulling in a different direction it’s next to impossible. Regional coordination matters. And if regional targets are set to reinforce housing scarcity all bets are off. At the same time, the low regional housing targets give individual municipalities engaging in fiscal zoning cover to keep housing scarce in their municipality.
Why stick to flawed methodology?
It is not uncommon that flawed methodology survives unquestioned for a long time. There is significant inertia inherent in established methods, and it can require concerted effort to overthrow them. In part it’s because technical detail helps wrap flaws up into an authoritative sounding package. But in part it’s also because the flawed projections have important defenders, serving a variety of roles for different groups involved. They enable staff to justify planning positions and point toward a source of authority and expertise; they enable politicians to begin negotiations over seemingly neutral starting projections while side-stepping very different views of the most desirable future, both between themselves and their constituents; finally, they enable both staff and municipal politicians to speak to provincial and federal governments in terms all parties can understand, even if they can’t agree upon desirable outcomes. This helps explain their inherent inertia. Even when they’re wrong, they can still be useful to the right people.
The bottom line is that the broad availability of housing, and the ensuing improved housing affordability it would provide, is not a universal good. A large portion of the voting population does not feel the negative consequences of housing scarcity because they already have secure housing, and they might even like the feeling of observing their primary asset steadily appreciating in value.
The nature of Metro Vancouver planning is that it relies on the individual municipalities signing off on any agreement. In order to fix the flawed planning and data processes and put them on a path of more realistically assessing the interplay between housing and population/demographics, one first needs to more clearly separate the planning and data processes from the political processes. Politicians may well choose to vote to continue to constrain housing growth and perpetuate our housing shortage, but they should do so explicitly instead of hiding their values under flawed data work and technocratic language.
Upshot
Our focus in the post is on housing, and regional planning has an important role to play when it comes to coordinating planning for housing and population growth, especially in a heavily balkanized environment like Metro Vancouver (containing 21 municipalities, an electoral area, a First Nation Treaty Land, and, while not explicitly represented in Metro Vancouver planning processes, 16 First Nation reserves). We can see and clearly mark a regime change. Starting with plans from the 1970s, the GVRD moved away from coordinating for growth and toward gate management. This laid a strong foundation for housing scarcity, and Metro Vancouver has to this day continued to work toward perpetuating and deepening housing scarcity in the region through its projection and coordination work. While it is unclear how important the Metro Vancouver Regional Growth Strategies have been in coordinating municipal limits on housing development, they have at a minimum given cover to municipalities for perpetuating and deepening housing scarcity and spatial misallocation, shifting growth away from where people want to live.
The Province has already begun to look more closely at municipalities that have failed to accommodate more housing, and the inclusion on the “naughty list” of so many municipalities within Metro Vancouver should come as no surprise. But the regional planning body could also use an overhaul. A first step in reform should be reconfiguring the methods by which Metro Vancouver attempts to coordinate the housing targets of sub-regions. Past expert consultations (attended by one of the authors of this post) have identified problems with projections, making the key point that for a region with a severe housing shortage, housing development leads to population growth rather than the other way around. So far these critiques of Metro methods have not yet sunk in. Now might be a good time to shake things up.
As usual, the code for this post is available on GitHub for anyone to reproduce or adapt for their own purposes.
