No Shortage in Housing BS

(Joint with Jens von Bergmann and cross-posted at MountainMath)

Say you built a bunch of housing in a cornfield in the middle of rural Iowa. Would people come to live in it? Maybe. But probably not. Let’s imagine the same scenario scooted over to Vancouver. The conditions for our little field of dreams have changed. Here we’re pretty comfortable predicting: if you build it, they will come. Housing limits population growth here in a way it does not in rural Iowa.

Continue reading

Recent Sightings

A round-up of recent sightings on-line (cause where else am I gonna show up?)

June through July saw me presenting at the Canadian Sociological Association (CSA) meetings, joining a panel presentation with the Vancouver City Planning Commission (VCPC), and giving an invited talk with the QMI / Urbanarium Urban Lunch Series ahead of the forthcoming visit by Alain Bertaud. Details, Abstracts, Slides, and Video Links (where available) below!

Continue reading

Vancouver’s Crime Pandemic! That wasn’t.

We now have over six months of pandemic conditions in Vancouver and crime data to (roughly) match. We also have all kinds of claims about crime flying around, sometimes pushed by the police (VPD) themselves, only heightened by click-seeking reporters and the vote-seeking politicians. So we should probably check into the data. Long story short: there’s scant evidence of a crime wave showing up in the VPD crime data.

Continue reading

Wealth vs. Income

co-authored with Jens von Bergmann & cross-posted over at MountainMath

Wealth and income are different things. Wealth is measured in terms of assets minus debts at any given point in time. It can accumulate or deplete over a lifetime and across generations. By contrast, income represents some variation of how much money one makes over a given time period (usually a year). Most people get this on some level. But since both income and wealth deal with people and their money, the terms are also often used interchangeably. So it was that the CBC yesterday reported that “B.C. budget 2020 promises new tax on wealthy to help ensure future surpluses” despite the actual new tax being a tax on high-income individuals. Continue reading

Running on Empties

(co-authored with Jens von Bergmann and cross-posted at MountainMath)


A spectre haunts housing policy. The spectre of empty homes. So how many empty homes are out there?

Unfortunately, inept analyses of census data often leaves us with incomplete, or even worse, completely wrong answers to this question. When we get data on empty homes for a given city, they’re seldom put into comparative perspective. What’s worse, sometimes when they’re put into comparative perspective, they’re compared with the wrong data and picked up by credulous media, spreading misinformation. So let’s try to do it right!

Here we want to compare some big metro areas and cities in Canada with similar metro areas and cities in the US. As a bonus, this comparison sheds some light on our incomplete data in Canada, and why empty homes have managed to become so central to Canadian housing discussions.

Empty homes

In Canada we only have one national measure of empty homes, the Census. It estimates the number of dwelling units that are not occupied on census day. It does not offer any insight to why those homes are not occupied. Nor is it part of the standard release data, for most censuses it is only available as a custom tabulation. However, the related number of homes not occupied by usual residents is part of the general census release data and available down to the census block level. It is given by the number of dwellings minus the number of households (aka “occupied dwelling units”), so it includes dwellings that are occupied by people who usually reside in a different “household.” To understand what that means we need to remind ourselves that the census counts people, and tries to count them only once. And each person belongs to exactly one household. This gets tricky for people that call several places their “home”, for example a student that rents an apartment near university but also lives with their parents during summer, or someone working in Fort McMurray for months at a time but lives with their family elsewhere during work breaks. These people may think of their family’s home as “home”, and the other place as “temporary”. In the census, the “temporary” home will be counted as “occupied by temporary residents” and not count as a “household,” as their main household is elsewhere.

Canadian numbers

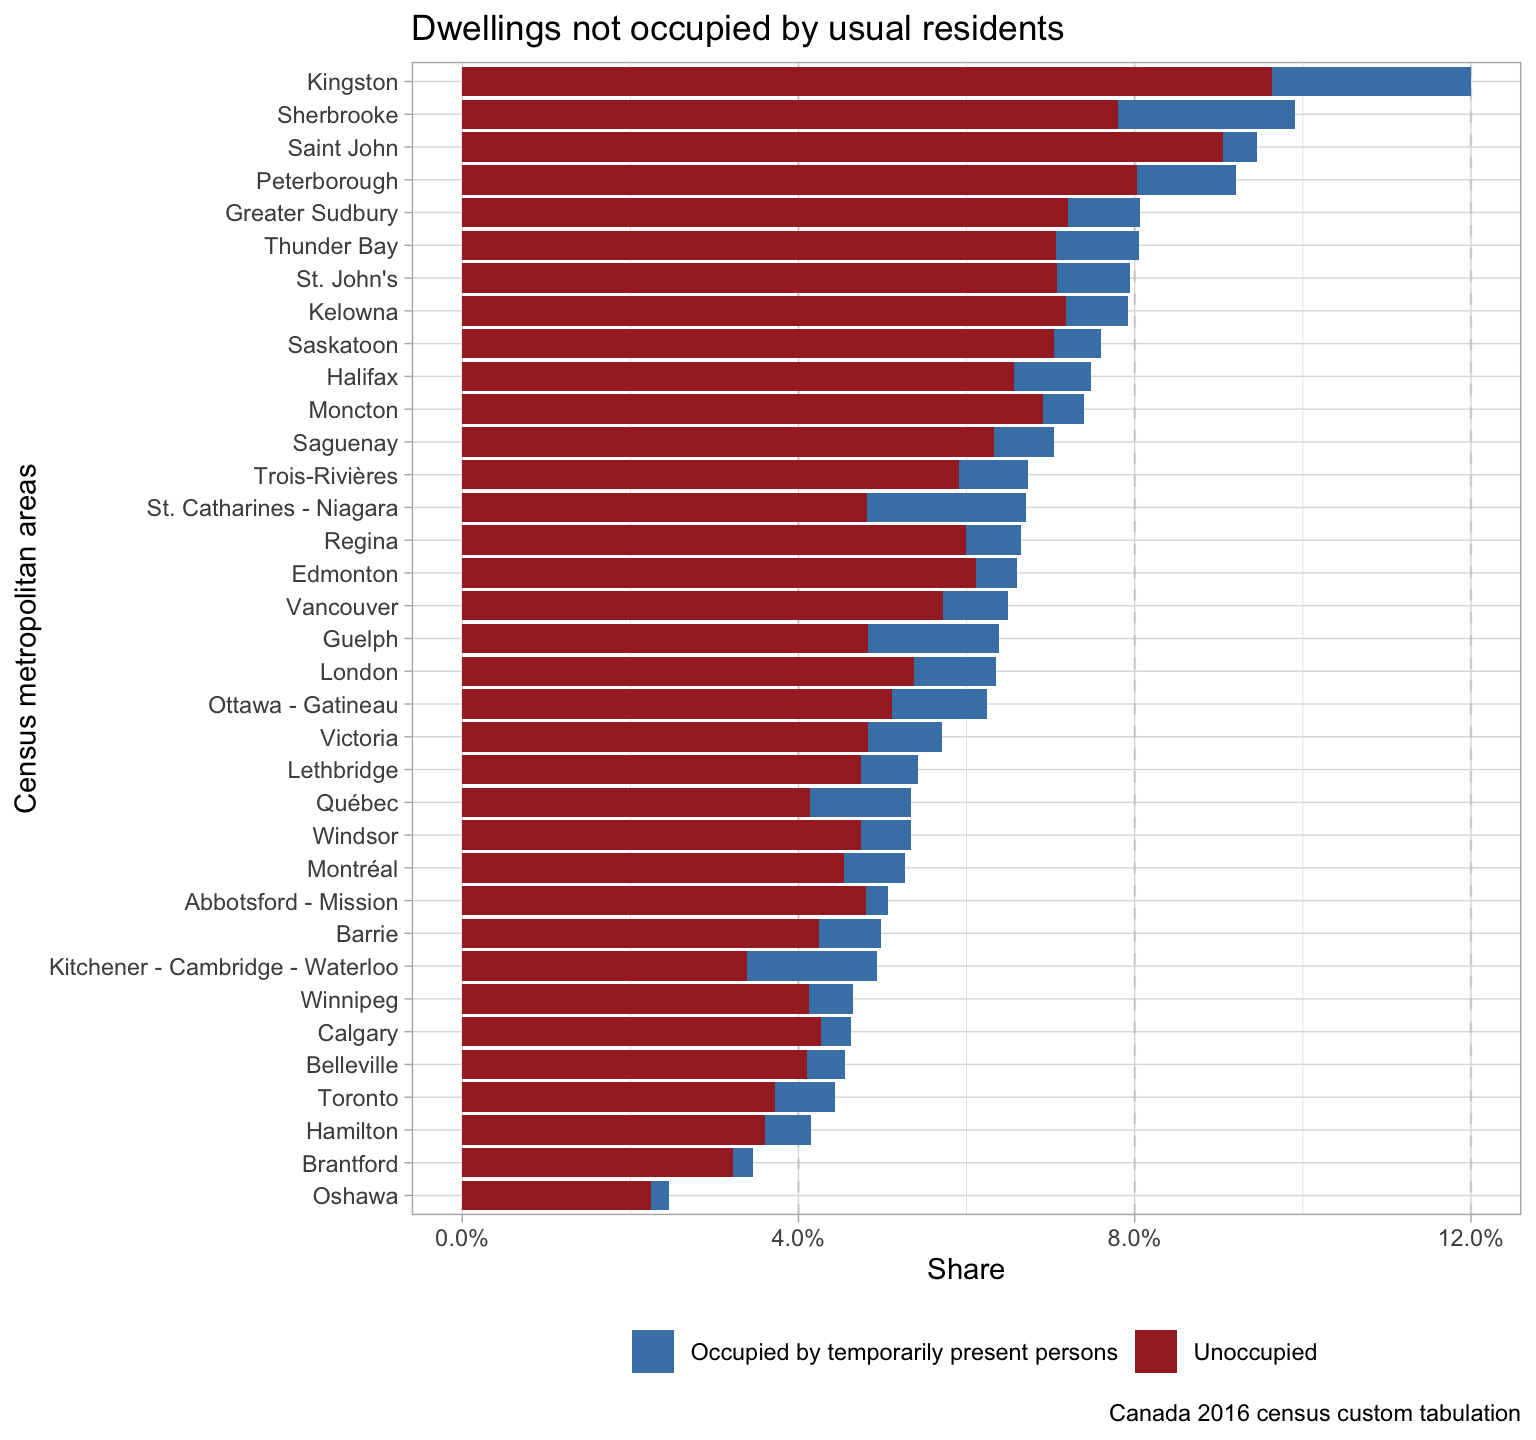
Canadian data is pretty simple. To start off we look at Canada’s major census metropolitan areas by their share of unoccupied dwellings. For context we also show the temporarily occupied units. We get a range of unoccupied households somewhere between roughly 2% and 10%, with most bigger metros hanging toward the middle, between 4% and 8% (or what the Lincoln Land Institute considers the desirable range of “reasonable vacancy”).


Fig1

We can also look at municipalities, keeping in mind that the comparison across municipalities is inherently difficult as different municipalities play different roles within (or outside of) metropolitan areas. Here’s a selection of municipalities, including the boundaries for the old (pre-amalgamation) City of Toronto, just for kicks. Note that municipalities still tend to hang between the 4% to 8% reasonable vacancy range, but the high share of temporarily occupied homes in Waterloo stands out, likely a function of students making up a large share of the town’s population.

Fig2

US Data

US data on unoccupied homes is available from multiple places. Here we use the American Community Survey as similar to the Canadian Census. (But see also the American Housing Survey for fun cross-referencing).

Fig3

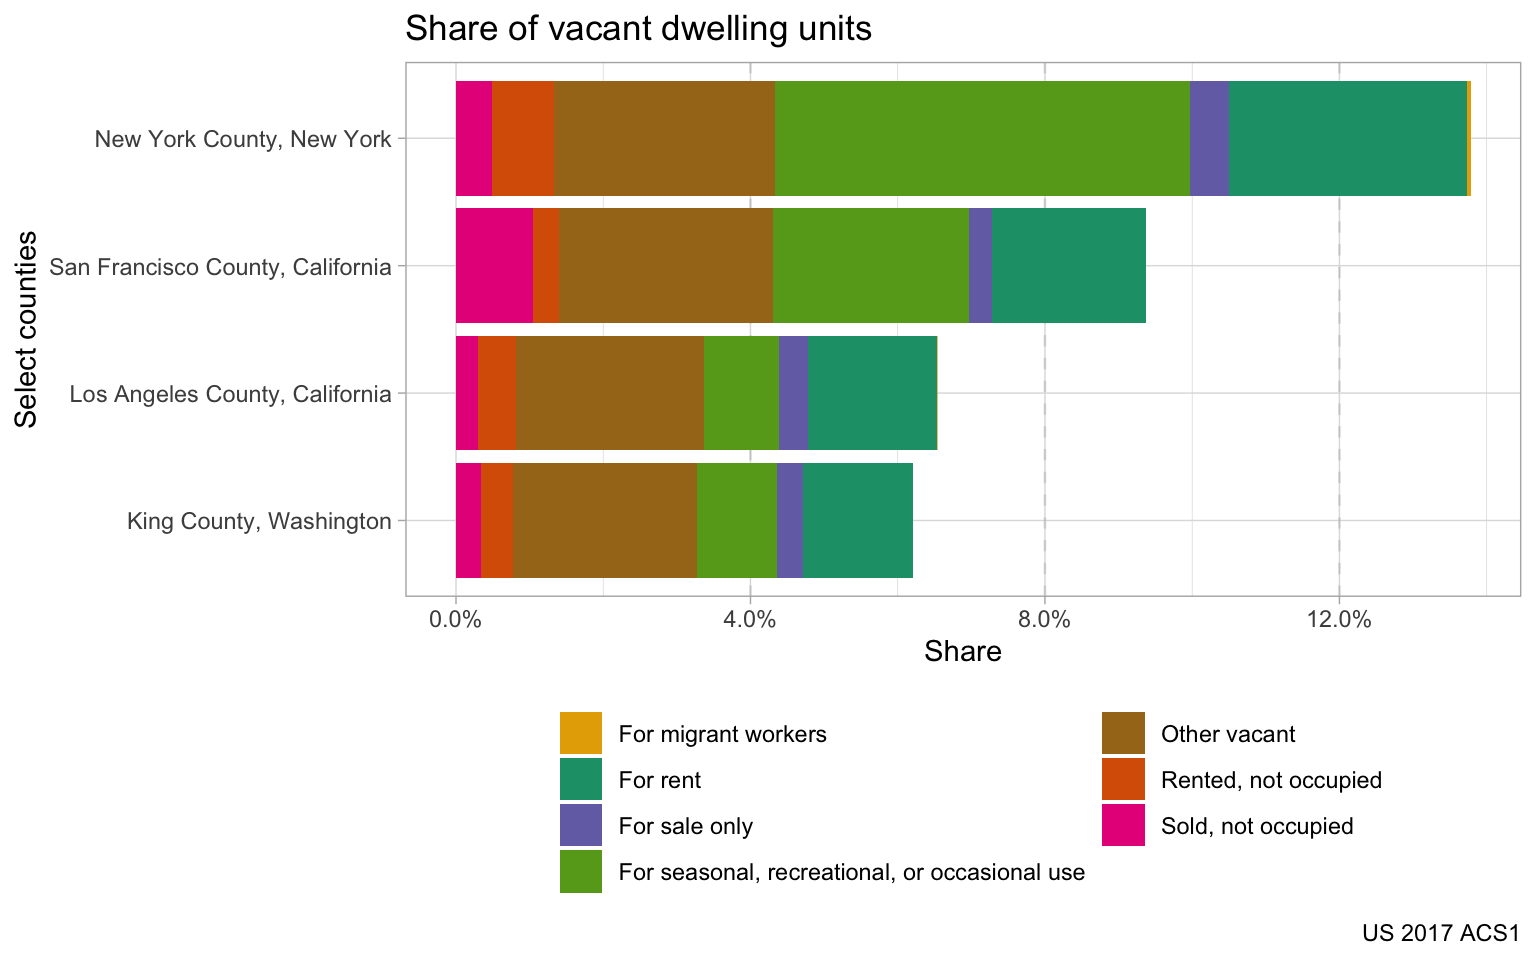
US data is great in that it adds important context to unoccupied units, specifying the reason the unit is unoccupied. This context is often completely absent from Canadian housing discussions. It clearly splits out the transactional vacancies, (units for rent or for sale), from moving vacancies (units sold or rented, but not yet occupied), from recreational vacancies (units for recreational, seasonal or occasional use), from other vacancies (not otherwise accounted for).

The range for US Metropoles is also much higher than for Canada, running 12% and higher in the seasonal vacation-oriented metros of Florida, Arizona, and Southern California. Just below these metros sit some of the rust belt metros (Pittsburgh, Detroit, St. Louis) that have lost population, resulting in higher “other vacancies” from homes left behind. Houston seems driven by a high proportion of dwellings available for rent. Overall the data show that many empty homes may be accounted for by these kind of transactional vacancies and moving vacancies, together comprising vacancies we might also think of as good vacancies insofar as they enable people to move between homes to find the best fit. Down toward at the bottom we see just under 5% in the Twin Cities of Minnesota.

Overall, vacancies tend to be higher in the US than in Canada. As unoccupied dwellings rise much above 5%, they seem to be increasingly explained by recreational vacancies and other vacancies. A baseline of other vacancies remains largely unavoidable (e.g. homes under major renovations, tied up in court cases, etc.), and also appears to include people showing up as temporary residents in Canada. We can use ACS data on Usual Residence Elsewhere to provide figures similar to what we get in Canada, comparing all North American metros on roughly the same basis. Here we’ll just show the 14 biggest US metros along with the 6 biggest in Canada.

Fig4

Overall Canadian metros tend to have lower vacancy rates (combining unoccupied with temporarily occupied) than US metros. Seasonal destinations (Miami and Phoenix) – that also provide second homes for many Canadians – top the vacancy rates for large metro areas, followed by a diverse mix of large metros. Edmonton and Vancouver, though high for Canada, fit very comfortably in the low end for the US (running from Seattle to Boston), while Toronto, Calgary and Montreal occupy the bottom.

What of the bad kind of vacancies, often associated with second or higher order homes for the wealthy or holding properties off the market for speculative purposes? Empty Homes Taxes and Vacancy Taxes in Vancouver and BC attempt to target just these kinds of dwellings, and so far they indicate that just over 1 in 9 unoccupied units end up getting taxed as second homes or otherwise vacant without defensible cause. Vacancy data from the US suggests that were such taxes imposed in places like Miami, that figure would likely be a lot higher. But Miami markets itself as a seasonal or vacation destination.

Vancouver’s Empty Homes Tax covers the City. BC’s speculation tax covers a region larger than cities or even any given metropolitan area. Just for kicks, let’s peek in on counties, a unit of governance in the US with no firm equivalent in Canada. Weirdly, counties can contain portions of cities, like New York County, which contains only the island of Manhattan within NYC. Sometimes counties are the same as cities, as seems to be the case for San Francisco county. Other times counties are a little larger, as with King County (containing Seattle). Sometimes they’re much larger, as with LA County. How heavily would vacancy taxes likely fall in these various counties? In the counties acting like metropolitan areas, including King County and LA County, overall unoccupancy rates are similar to Metro Vancouver. Vacation homes would likely be hit unless deemed ineligible for year round use. Some, but not all, other vacancies would likely be taxed. The vast majority of empty units probably wouldn’t remain empty long enough to trigger taxation. Counties containing Manhattan and San Francisco, with much higher seasonal use, would probably be hit much harder.

Fig5

Altogether, unoccupied dwellings are broadly similar between the US and Canada, with slightly more dwellings showing up as unoccupied in most metro areas to the south. Lots of municipalities, regions, and counties might profitably consider Empty Homes or Vacancy Taxes. But most unoccupied dwellings in most metros wouldn’t be much affected by them.

Code linked at GitHub!

Gateway Communities of Vancouver

Gated Communities are kind of awful, but the communities that form at GateWAYS are actually pretty cool. In a world of immigration, that’s where we tend to get a lot of our diversity.

As Canada’s Gateway to the Pacific Rim, Vancouver is fortunate to be full of Gateway Communities, both as a central City and as a broader Metropolitan Area. Nearly half of Vancouver’s residents were born outside of Canada. Where do they come from? All over, but we get especially large representation from across Asia. Media stories tend to focus on Chinese immigrants to the area, where Mainland immigrants have recently overtaken historical streams from Hong Kong and Taiwan. But the streams from China constitute only a minority of Asian immigrants overall. Large streams from the Philippines, India, Iran, South Korea, and Vietnam also pour into both the City and Metro region of Vancouver. Other streams from the UK and Europe, the USA and the Americas, and Oceania (especially Australia) build upon the proximity and colonial legacy of Canada. Relative to the descendants of settlers past, First Nations and other Aboriginal identified Canadians make up only a small proportion of the area’s residents, though their cultural impact is profound and local First Nation bands are emerging as a development powerhouse in the area.

Let’s draw upon Statistics Canada’s community profile data from the last Census (2016) to put this all up for comparison:

Metro-City-Immig-2016

The City of Vancouver and the Metro Region have similar aboriginal identified populations. There are slightly more settler descendants in the surrounding municipalities than in the City of Vancouver proper. Non-permanent residents, including those on student and work visas, round out the population, and are slightly over represented in the City of Vancouver relative to the Metro area as a whole. In terms of immigrant Gateway Communities, the City of Vancouver and the Metro Region as a whole are relatively well-matched. The big exception is that the City of Vancouver has historically added more immigrants from China than the region as a whole, which has added more immigrants from India. For recent migrants, this trade-off has shifted. Now the City of Vancouver and the Metro Region add about the same proportion of immigrants from China, but where the City of Vancouver loses immigrants from India, it adds immigrants from Europe and the Americas (especially the UK and the USA).

Metro-Suburbs-RecentImmig-2016

We can break out a selection of suburbs by their recent immigrants to see where people are going. Immigrants from India tend to favour Surrey as a destination. Richmond received outsized attention from Chinese immigrants. North Vancouver selects for Iranian immigrants. Also, North Vancouver, like the City of Vancouver, seems to select for immigrants from Europe and the Americas. As pointed out recently by Kishone Roy and in the past by others, American immigration to Vancouver probably hasn’t received as much attention as it should! Especially since the USA’s Federal Voting Assistance Program believes Vancouver houses more American citizens abroad than any other world city! (Given that the Census only shows 26,445 immigrants to Vancouver born in the USA, many of these Americans abroad are undoubtedly dual citizens who were granted citizenship from past residency in the USA or from their parents).

OverseasAmericans-2016

As demonstrated by the difference between citizenship and place of birth in the case of ties to the USA, just looking at place of birth doesn’t fully represent the nature of Gateway Communities. The same issues certainly arise in comparing those born in Hong Kong to the much larger community claiming ties to Hong Kong. Aside from place of birth and citizenship, there are other ways to think about and chart the diversity gathered in Vancouver by virtue of its Gateway status. Immigration often produces linguistic communities, that are sometimes (but not always) passed between generations of immigrants. How many languages have 5,000 or more speakers in Metro Vancouver?

Metro-LinguisticCommunities-2016

The wonderful thing about looking at languages is that it helps break down nations into their component parts. Cantonese, once the dominant Chinese linguistic community in Vancouver, must now share with Mandarin. But Wu and Min Nan linguistic communities also remain vibrant and point toward the diversity within China as well as the Chinese diaspora. Similarly, we get a lot of immigrants from India, but we get an especially large number from the Punjab. When they arrive, they pass on Punjabi between generations. Far fewer speak Hindi, despite its dominance in India. We also see multiple linguistic communities from the Philippines, with both Tagalog and Ilocano having over 5,000 speakers. The vast majority of residents speak English, but French is also relatively common and a diverse cast of other European languages find a home in Vancouver.

Let’s look at the diversity of Vancouver in one more way. Instead of thinking about how different communities measure up to one another in Vancouver, let’s see how they measure up to their sending countries. In some ways this is similar to the study of Americans abroad carried out by the USA’s FVAP above, but we’ll put it in context of the population of sending country. How many people immigrate to Metro Vancouver per million people living in their homeland (i.e. country of birth)? This gives us a rough sense of the “risk” of moving to Vancouver and/or its “pull” upon various places around the world. We can look at both total immigrants born elsewhere and just recent immigrants, having arrived in the five years prior to the 2016 Census (2011-2016).

Metro-ImmigrantsPerMillionHome-2016

In terms of “pull,” Hong Kong is the hands-down winner. There’s at least one Hong Kong transplant living in Metro Vancouver now for every one hundred residents of Hong Kong. The pattern is similar, if less pronounced, for Taiwan. But Hong Kong and Taiwan are also (kind of) cheating. They are both still considered part of China in many respects, though their historical patterns of connection to Vancouver are far more intense. For more recent immigrant streams, the connection is less pronounced, but still there. The recent pull from the Philippines contends with Hong Kong, and along with South Korea and Iran, conspires to beat the pull for recent immigrants from Taiwan.

In terms of “pull” for recent migrants, about twenty-six Chinese in a million immigrated to Metro Vancouver between 2011-2016. This means Mainland China lags far behind Hong Kong, Taiwan, the Philippines, South Korea, Iran, the United Kingdom, and all of Oceania in terms of risk of immigrating into the region. But, of course, there are a lot more people living in Mainland China than any of these other places.

There aren’t that many more people in China than in India. India’s patterns of immigration to Vancouver are somewhat deceiving. Most arrivals are from the Punjab region, and the numbers belie the importance of Vancouver to the Punjabi Sikh diaspora. Looking just at residents of Vancouver with knowledge of Punjabi who were born abroad, the estimate for how many Punjabis have moved to Vancouver sits around 3,000 per Million residents of the Indian Pubjab, placing the “pull” of Vancouver for this particular region inbetween the pull for Taiwan and Hong Kong.

Overall, this is a reminder that the Gateway Communities of Vancouver are strikingly diverse. Ideally media stories should strive to avoid erasing this diversity when talking about how immigration affects the City and the region. ALL of these collectives offer the possibility for meaningful communities to form, gathered together here in Vancouver, just inside the Gates to Canada. Considered all together, they help keep the Gates to Canada open.

There is no Brain Drain, but there might be Zombies

co-authored by Jens von Bergmann & cross-posted at MountainMath & (as of Feb 8th) updated with slightly better mortality estimation


Zombie attack! Zombies fleeing Vancouver want to eat your brain… drain… or something.

A couple of weeks ago The Canadian Press reported a story asserting that young professionals were leaving Vancouver because of the high cost of housing. This fits in with a common zombie refrain that we hear from the media. It’s a story that just won’t die, no matter how many times it’s proven wrong: Millennials, or young people, or boomers, or people important for some other reason are leaving Vancouver because of housing. Usually there are supporting anecdotes, and indeed, it’s not too hard to find people leaving Vancouver who will tell you about their frustrations with housing. But here’s the thing: there is almost never supporting data that actually indicates a decline in people worth caring about. Why? Two reasons. First, in growing cities, like Vancouver, when some people leave, even more people come in to replace them. Second, ALL people are worth caring about.

If we set aside that ALL people are worth caring about – just for a moment – we can take up some important questions about differences in in-flows and out-flows of people in Vancouver. Maybe there are aspects of in-flows and out-flows that should trouble us. In The Canadian Press story, we’re led to believe Vancouver is experiencing a brain drain, so that all the smartest and best people are somehow leaving and they’re either being replaced with people who are not so smart OR they’re not being replaced at all. As noted above, Vancouver is growing. So we know whoever leaves is being replaced, and then some, by new people coming in. But are the people arriving in Vancouver somehow less brainy than those leaving? We’re both immigrants to Vancouver, and quite frankly we find that a little offensive. Everyone arriving in Vancouver has a brain, so population growth cannot result in a brain drain. But we set aside, for a moment that idea that ALL people were worth caring about. So let’s try putting differences in in-flows and out-flows in slightly less offensive terms by returning to the “young professional” framework. Are people arriving in Vancouver unable to do the same kind of professional work as those who leave? Are we losing out on educational credentials?

Ideally we could easily access direct information on in-flows and out-flows to Vancouver (and in some places with population registry data, this is easily accomplished). In Canada we work mostly with census data, and the out-flow data, in particular, isn’t generally made public. But as we’ve demonstrated previously, we can compare across censuses to get net migration data broken down by age group. We just age people forward from one census to the next and compare how many we see in the next census to get a sense of how many people – in net terms – must’ve moved in or out over the years in between.

Now if we’re interested in education then it complicates age-based net migration models. After all, people can and do acquire new educational credentials as they age forward in time. That said, we can probably assume that most people who acquire university degrees and more advanced credentials do so by age 25. We’ll leave out some late achievers, for sure, but if we assume we have a pretty stable division into those with a completed Bachelor’s degree or more, and those without by age 25, then we can get a sense of how those populations change as they age forward in time. So, with apologies to late achievers, that’s what we’re going to do.

We’ve got ten year age groupings by education to work with in 2016 data. So let’s go back to 2006 data for comparison. Is it plausible that we lost a bunch of “young professionals,” defined as people with university degrees, who weren’t replaced as they aged forward and left Metro Vancouver between 2006 and 2016? Data says… nope.

Prof-Updated-Mortality2

As a matter of fact, Vancouver added a lot more young university graduates than left. Young people with university degrees continued to arrive in greater numbers than they left well through their thirties and on into their forties (we like to think of forties as young). The age labels here refer to people’s “in between” age, that is the ages they mostly passed through between 2006 and 2016 (i.e., the age range each group was in 2011). It’s only once those with university degrees hit their fifties that we start to see a roughly even net flow out of in Vancouver. What’s more, this pattern looks very similar in other major Canadian metro areas. The only exception is Montreal, where people with university degrees really do stop arriving in their forties. But it’s probably not a housing crisis driving them out.

Strikingly, across the board, young people with university degrees are far more likely, on net, to move into our major metro areas than people without university degrees. In many respects, we should expect this. Professionals, in particular, are often drawn by their economic opportunities. Once they arrive anywhere, they’re often paid well enough that they have an easier time navigating local housing markets than non-professionals. Yes, professionals may also have higher expectations about what kinds of housing they deem acceptable than others, but people adapt. One of us has written a book with that theme. In the same way that professionals may drive gentrification, professionals are actually at LESS risk of displacement out of expensive places, like Vancouver, than are non-professionals.

Let’s double-check the results for Vancouver by looking at in-flow data. The Census provides information about where people lived five years before arriving at their current destination. Do we really see a lot of professionals moving into Vancouver through their thirties and forties? Yes. In fact, for “Skill Level A Professionals” this is exactly what we see. We don’t know how many are leaving from this data, but we know a lot of professionals are arriving – more so than in other occupational skill-level categories.

occupation-inmove-2

For mobility data the age group labels refer to people’s age in 2016. For an alternative view we can group non-movers and non-migrants (people that did move but not to a different city) together and show the makeup of each skill level by mobility and age group. Again we see that professionals tend to have higher shares of migrants than other skill levels, especially in our lower two age brackets. Those in occupations requiring only a high school degree or on-the-job-training are actually the least likely to come from afar.

occupation-inmove-3

Takeaway: we do not have to worry about a “brain drain” in growing cities like Vancouver. Moreover, we don’t have to worry about professionals leaving. Due to better pay, professionals are better equipped to deal with a tight housing market than most others. Building more housing would certainly give professionals more options to choose from, and we might want to relax our millionaire zoning to direct professionals toward competing with the independently wealthy rather than the poor and working class. But it’s the poor and working class we should really be worried about losing. More housing can lead to a more equitable city with room for people who aren’t well-paid professionals or independently wealthy. And if we want to prevent displacement, we should focus more on those actually at risk. That suggests both building more and promoting a LOT more non-market and rental housing.

Methods

There are some details to be explained when computing net migration data for professionals. We already noted that professionals might get degrees at some later stage in life, but that tends to bias our estimates toward lower professional in-migration. Furthermore, when computing net migration one needs to kill off an appropriate number of professionals to account for mortality as Nathan has explained in details before. We use BC mortality rates for the appropriate years and age groups for this, but that probably over-estimates mortality as educated people tend to have lower mortality rates. This would bias our estimates toward higher professional in-migration. We could adjust for that by reading into the literature to figure out the appropriate fudge factor, but the effect is so small that we just ignored this. We made some adjustement to how we compute mortality rates and now assume a 20% reduced mortality rate for people with bachelor or above, and according higher mortality rates for people below a bachelor. This is a very rough approximation of the impact of educational attainment on mortality.

Those interested in even more details we direct to the code for the analysis, where Jens is teaching Nathan how to code with R.

When journalists attack!

Public intellectuals beware! Not everyone agrees with you, and some will be nasty about it. So how does it work when muck-raking journalists attack?

First some context: an observation of mine on twitter led to a little dust-up concerning the discourse around “foreign money” in Vancouver. I quickly muted the conversation, but it summoned many trolls, including the ghost of Margaret Wente (which paradoxically made me feel all warm & fuzzy, like I’d done something right). South China Morning Post reporter Ian Young, one of the chief troll-masters, decided to put out the equivalent of a journalistic hit on me. I suspect this is a pattern with Ian, given his past attacks on other public figures he disagrees with (like UBC’s Tsur Somerville). So I’m posting my responses here for future reference. Hopefully this will serve three purposes: 1) it may help keep Ian honest in his muck-raking; 2) it may have broader lessons for other academics who dare raise their voices in the rough and tumble public sphere; and 3) some people might actually be interested in my answers to Ian’s questions.

How things unfolded: After an initial relatively professional inquiry about getting my input on general issues (foreign money, racism, real estate), Ian sent me the following questions, which focus less on my input and more on my conduct, including both my tweet (which brought all the trolls to the yard) and my participation as an expert witness in a court case challenging BC’s foreign-buyer tax. But it doesn’t stop there. Read on if you’re also interested in strata wind-ups, because there’s a part two to the journalistic hit-story where Ian dives even deeper to try and find dirt on me!

Ian’s initial questions [in bold]:

  1. In your affidavit in the Jing Li case, you say the role of “foreign buyers” in the Vancouver real estate market has likely been exaggerated. How big a role do you think “foreign money” – specifically, Chinese money (brought by both immigrants and non-immigrants) –  plays in the Vancouver real estate market?

“Foreign money” is a problematic and sloppy concept, especially as applied to the wealth immigrants bring with them. I think immigrants play a strong role in driving Vancouver real estate, and we attract a disproportionate share of wealthy immigrants. We can talk immigration policy, and while I’m generally pro-immigrant (and an immigrant myself), I’m on the record against “investor” immigration programs. But when people immigrate to Canada, I no longer think of their wealth as “foreign.”

It would appear from data I’ve seen and analyzed, as compiled by the CMHC and Statistics Canada, that the role of people investing in Vancouver real estate while living elsewhere is a real but relatively small part of the local market. The evidence suggests local investors are far more prominent.

As for the issues of tax avoidance and money laundering (that people sometimes pretend only apply to “foreign money”), I take it for granted that these are bad things that should be ended regardless of how big a role they play in real estate.


  1. Can you elaborate on the role of racism in the debate over foreign money and Chinese money in the Vancouver affordability debate?

I believe a number of different logics or motivations have driven the debate over “foreign money,” which as I’ve mentioned, I consider a problematic and sloppy concept. Many people are drawn to the “foreign money” explanation as a ready answer to their understandable confusion over prices that keep them from obtaining housing they feel like their parents might’ve been able to afford or that they could still easily obtain in other parts of Canada. They’re looking for answers – especially answers that don’t make them feel like failures for not achieving their particular homeownership goals, which are often associated with middle-class success, becoming an adult, and being a good parent. In this sense, there’s a real moral and personal element to debates over housing. And people are right to look beyond their own circumstances for explanations into Vancouver’s affordability woes. It’s a very sociological instinct!

But blaming foreigners isn’t helpful and the distinction between foreigners and foreign money isn’t very clearly drawn, just as blaming Chinese people isn’t helpful and the distinction between Chinese people and Chinese money is fuzzy at best. Racism certainly plays a part in the popularity of “foreign money” discourse, and Vancouver has a long and troubled history there. But we’re also in a very broad-ranging and very real populist moment where a generalizable xenophobia has taken root around the world. It takes different forms in different places, but it troubles me wherever I see it. Then there are also dynamics that are quite specific to Vancouver and its waves of immigrants from Hong Kong and Mainland China (and to a lesser extent, from Taiwan). Many people from Hong Kong are understandably worried over the future of their home city, seeing both Hong Kong and now Vancouver as threatened by Mainland China. These worries are frequently expressed through anti-Mainlander prejudice. I don’t think the term “racism” captures all of these logics or motivations, but it’s part of a somewhat toxic brew that in Vancouver is often targeted at Mainland China and Mainland Chinese.


  1. Can you explain the continuum of racism in BC and what role it plays in government policies and public opinion relating to real estate here?

As you suggest in your questions, the debate about “foreign money” and “foreign buyers” was also particularized by many people as a debate about “Chinese money” and “Chinese buyers.” People moved back and forth between identifying Canadian sovereignty (vs. foreign) as their primary concern and targeting a particular nationality (“Chinese”) as a concern. My understanding is that anti-Chinese sentiment takes many forms, including those driven by race-logics and racism (and particularly prominent in Vancouver’s past), and those driven by logics and motivations internal to the Chinese diaspora that aren’t racial in nature, but rather reflect tensions with the Mainland. Anti-Chinese sentiment has historically played a very strong role in government policies in Vancouver and BC more broadly. Both governments have acknowledged and apologized for this, but I believe it would be naïve to suggest anti-Chinese sentiment no longer plays a role in driving policy.


  1. Regarding your “national socialism” tweet…were you offering a sincere observation, or being deliberately hyperbolic?

[See tweet here]

It was a sincere observation, but couched as a worry rather than an accusation. Indeed, I went out of my way to grant good motivations to those involved in the discussion. My worry involved an underlying transformation in logic. Socialist logics focus on privatized wealth & related inequality as a problem. National socialist logics veer far to the right by twisting concerns about inequality to focus on particular groups of people, demonizing them as enemies of the nation and identifying their wealth or perceived power alone as the problem. To return to our local discussion, it isn’t hard to find far-right, pro-fascist organizations cheering on discourse about “Chinese buyers” and “Chinese money” being to blame for Vancouver housing woes.  To put this in very simple and personal terms: if you think “foreign money” is the problem and you focus on the money part, I’ll be with you. If you think “foreign money” is the problem and focus on the foreign part, I won’t. This relates to what I think of as quite important underlying shifts in logic that are very pertinent to the present moment in time.


  1. Where do you want the policy debate over real estate affordability in Vancouver to go? What areas deserve more emphasis than addressing foreign money and foreign buyers in the market, as a means of improving affordability, and why?

The most important aspects of affordability in Vancouver often get the least amount of attention. Those people currently marginalized by the market distribution of housing, including the homeless and those living in core housing need, should receive the most attention. They are the ones for whom housing is a life and death matter. Temporary Modular Housing is a great move here, and that and related programs should be expanded. Next we should focus on renters. They’re the ones in dire need of more options (Vancouver’s vacancy rate being at 1%) and at most risk of falling into core housing need. There are lots of policy options here, and we should be creating way more social housing options, including a big expansion of non-equity cooperatives. We should also encourage and enable many more market options. Far behind these groups, we get to owners and those desiring to own. There are real benefits to having a very large and broad range of property owners rather than letting property ownership accrue only within a very small and select class. There are also real benefits to having lots of different kinds of housing stock that enable a broad range of options for people to pool their resources together and buy housing, while also encouraging more environmentally friendly lifestyles. I don’t think we need any more programs encouraging and promoting home ownership, which is too often where affordability debates take us, but I don’t think it should be discouraged either.


  1. What were the circumstances that led you to provide your affadavit in the Jing Li case?

I was approached by the law firm representing Jing Li to act as an expert witness in the case. Representatives of the firm very clearly and repeatedly assured me that as an expert witness, my duty would be to the Court rather than the law firm or their client. This was an important part of my decision to accept the role of expert witness. Through my work as an expert witness, I carried out research to answer questions posed to me by the law firm (through my letter of engagement), with my obligation being to provide truthful and well-researched (“expert”) answers to the Court.


The story continues

These were Ian’s first questions, and I initially agreed to delay blogging my answers until around the time Ian’s article came out. But after his first round of questions, Ian sent me follow-up questions focused solely on my conduct and concerning my former strata association’s wind-up and sale. He’d tracked down the buyers of the strata and apparently identified them as the very personification of evil “Chinese money.” So he sent me targeted questions about this being an unidentified conflict of interest influencing all of my public commentary. “It turns out that disagreeable professor was being paid by ‘Chinese money’ all along! Now we’ve got him!”

It’s a bit of a scoop! But not in the way Ian thinks. As I’ll discuss below, the strata wind-up was a complicated process that I felt ambivalent about, and I knew very little about the ultimate buyer. I’ve been planning on blogging about the experience of being part of a strata wind-up from the inside, but I’ve delayed for a variety of practical reasons. Now my story is in danger of being scooped by someone else! So let me tell you a little bit about what went down before Ian does whatever he’s going to do with his take.


What about my strata wind-up and sale?

My partner and I were initially quite angry when news broke that our strata council was considering looking at winding up the strata and putting it on the market. We liked our townhouse just fine, and we hadn’t been there very long. Ours was a mixed strata, comprised of townhouses and a low-rise building. The main issue seemed to be that the low-rise building was worried about their expenses, which were treated separate from ours, and wanted to compare estimates for fixing the place with what they could get for selling the place. We initially took this to suggest that the low-rise hadn’t been keeping up their building the way they should, and it didn’t seem fair that we in the townhouses should have to sell to cover their expenses. But then the possibility for big money from a sale also started getting thrown around in a lot of conversations with neighbours. Some were very excited by the prospect. Others were noticeably distraught that they might have to leave. After much discussion and many meetings, the strata as a whole voted to market the place to see how much it could sell for. Working with Colliers, we ended up with an offer that entailed a lot of money (around twice our assessed values). We knew very little about who made the offer, but the realtors told us it was a new developer with interests both in Canada and China. Then we had a vote on whether or not to accept the offer and wind-up the strata. My partner and I were conflicted in our voting. A lot of money was on the table, but we really liked our place and sympathized with those who wanted to stay. In the end our vote didn’t matter. The vote to sell easily met the threshold required under the new strata wind-up regulations.

There were minor complications throughout – it’s a big and involved process to wind-up and sell a strata – and we still weren’t certain the deal would go through for several months after the vote. In fact, we kind of hoped the deal would fall apart (especially when the flowers came out in our little townhouse yard!) But eventually all the t’s got crossed and the i’s dotted. And now we’re renters! (We negotiated a period of time in which we could rent back our properties while looking for someplace new to live).

Overall, the strata wind-up and sale is something that happened to us, rather than something that we actively sought. We weren’t at all certain we wanted it to go through. I learned lots from it, but it did not otherwise affect my public commentary* and I did not know who the beneficial buyers were until Ian sent me their names, nor have I ever had contact with the beneficial buyers. As in most real estate transactions, their identities were never anything more than a curiosity throughout the process. I remain curious, as ever, about what they’ll do with the place once we’ve all left. Until then, speaking as a tenant, if Ian wants to dig up dirt on my new landlords, I’ve got no problem with that.


*- There is one exception regarding the strata wind-up and sale affecting my public commentary! My partner and I are dual-citizens, and as a result we’ll be paying capital gains taxes on the sale to the USA, where sales of principal residence are not exempt from taxation. We don’t mind this in principal, and we kind of feel like windfall gains should be taxed. But we really, really wish our taxes were going to Canada. So its possible my advocacy for taxing the profit on sales of principal residences in Canada has been strengthened by the strata wind-up. Take my money Canada! Please!

Fact-checking Vancouver’s Swamp Drainers

[co-authored with Jens von Bergmann and cross-posted with MountainMath]

Swampy facts: the dark, broken, and ugly side of housing talk in Vancouver.

Down south of the border, a politician who shall remain nameless campaigned on “draining the swamp” of Washington D.C., trafficked in countless conspiracies, and lied his way into office. His lies painted a picture of a United States turned dark, corrupt and menacing. He promised to fix it, Making American Great Again, mostly by shutting down globalization and kicking out the immigrants.

In Canada, we like to think we’re immune to this kind of rhetoric. But a strain has made its way into discussions concerning Vancouver, where the intersection of real estate, politics, and globalization are increasingly portrayed as a swamp in need of draining. We don’t believe most of those portraying Vancouver as swamp-like are intentionally lying (and in real life they surely favour the preservation of environmentally sensitive wetlands). Nevertheless many commenters are muddying the discourse with poorly sourced claims as a means of scoring political points and attacking various aspects of globalization.

It’s tricky to track down the spread of all the false claims out there. Fortunately a bunch of them were concentrated in a recent piece on “Dirty Money” in Macleans by Terry Glavin that views Vancouver as “a case study in the dark, broken and ugly side of globalization.” Recognizing that getting facts and interpretations right is often difficult for even the most well-intentioned, let’s work toward correcting a few misperceptions, line by line:

“At least 20,000 Vancouver homes are empty, and nobody’s really sure who owns them.”

Variations of similar statements permeate the media, with various degrees of factual accuracy. The most common misrepresentation is to refer to the 25k homes not “occupied by usual residents” as “empty”, which the above quote avoids by using an appropriately lower number.

The main issue with the above quote is that it’s portraying those “at least 20,000” homes as problematic vacancies, neglecting that that count includes moving vacancies around census day, empty suites (about 4000 of them), and units in buildings that completed around census time and did not have the time to fill in yet.

Accounting for these types of vacancies, we arrive at the ballpark of the Ecotagious Study based on BC Hydro data that found between 10,800 (for year-long vacancies) to around 13,500 (for four-month vacancies) and now the 8,481 empty homes through the Empty Homes Tax declarations, although some of those empty homes found via the EHT are outside of the universe Ecotagious reported on.

When quoting these numbers, the key question is what are the numbers supposed to be used for. If it’s to highlight “problematic” vacancies, then the Ecotagious numbers probably get us the best estimate for that point in time. Since then the number has likely dropped due to Empty Homes Tax pressure, we will have to wait until the repeat of the Ecotagious study to get confirmation on by how much.

And the reason we don’t know who owns them is not for some nefarious reason but simply because the methods we have for estimating empty homes (other than the ones caught by the Empty Homes Tax) do not allow for the identification of units.

“Another 25,000 residences are occupied by homeowners whose declared taxable household incomes are mysteriously lower than the amount they’re shelling out in property taxes, utilities and mortgage payments.”

That’s plain false, we have looked at this before. The 2016 census counted only 8,940 owner households with higher shelter costs than income. An additional 14,510 renter households paid more than their income in rent and utilities, making for a total of 23,450 households in the City of Vancouver that had higher shelter cost than income, most of which were renter households.

The wording of the sentence, followed by the next talking about tax avoidance in British Columbia real estate, seemingly suggests that the majority of these 23,450 households were cheating in some way. Let’s take a closer look at these households with shelter cost higher than income.

One of us (Jens) is partially responsible for bringing this stat into circulation and failing to provide more extensive context from the get-go.

figure-chunk-1

Looking more closely, we see that the bulk of these households are non-census-family households, probably roommates in many cases. Students likely account for a lot of the data. Single parents are also common. While there are some indications of irregularities in the data worth investigating further, broadly suggesting all these households are tax cheats is irresponsible.

“Non-residents own roughly $45 billion worth of Metro Vancouver’s residential properties, and non-residents picked up one in five condominiums sold in Metro Vancouver over the past three years.”

The first part is fairly accurate, CHCP reports that $43 billion worth of residential properties in Metro Vancouver were owned by non-residents. Of course that’s less than 5% of the total value of $884.5 billion.

The second part is a prime example of making statements without understanding the data. We don’t have data on non-resident buyers, presumably referring to buyers with primary resident outside of Canada at the time of the sale.

Considering similar statements in an earlier article by the same author, our best guess is that the author was referring to non-resident owners of condos that were built between 2016 and late 2017. Owners of recently built condos could be taken as a proxy for buyers if one makes some assumptions on resales.

Except the ratio of condo units built between 2016 and late 2017 that were held by non-resident owners is one in 7.1 for Metro Vancouver, and for the City of Vancouver that the previous article was referring to the ratio is one in 6.5. (CANSIM 33-10-0003)

In summary it seems the original statement is the product of playing loose with definitions, Metro vs City mixup and aggressive rounding to pump up the numbers.

“But Transparency International reckons about half of Vancouver’s west-side residences are owned by mystery trusts or shell companies.”

Big if true, a claim so outrageous that it needs data to back it up. It seems that this is based on a transparency international report that the author also referred to in a February column, where the author characterized this as “Transparency International estimates that perhaps half of Vancouver’s high-end residences are now owned by shell companies or trusts”. Now this has morphed into “about half of Vancouver’s west-side residences”. It’s good to remember what the Transparency International study actually did, it looked at the 100 most expensive properties in Metro Vancouver and found that 46 of these were owned by companies or trusts (not all of which have opaque ownership).

Via StatCan’s CHSP (CANSIM 39-10-0003) we now know that 5.61% of Metro Vancouver’s residential properties are owned by companies or trusts (or “non-individuals”), roughly in line with most other Canadian metropolitan areas in BC and ON as the following graph shows. Needless to say, the 100 most expensive properties on Vancouver’s west side are likely quite distinct from the rest.

Even after adding the non-resident owners to the non-individual owners, Vancouver still looks a lot like most other metro areas. In fact, the only metro area that really stands out is London, ON. Otherwise it’s the non-metropolitan portions of BC and ON that have the highest representation of company and trust ownership structures.

figure-chunk-2.company_non_resident

“In Metro Vancouver, homeownership costs amount to 87.8 per cent of a typical household’s income”

It does not. Most people spend far less, as the following graph on share of income spent by owners on shelter costs demonstrates.

figure-chunk-3

The author appears to be conflating running shelter costs of owner households with the RBC affordability metric which compares the cost of financing the typical home for sale in the region to the typical household income. The latter metric may (imperfectly) reflect some of the difficulty now facing those wishing to jump from renting to owning, but has little bearing on how much typical households currently spend in either category.

“Vancouver has also become a major global hub for organized crime networks based in China.”

Here the author immediately pivots to the opioid crisis and the suspicious transactions identified in the recent money laundering report concerning lax oversight of casinos, attempting to link these to broader affordability issues and to globalization. To be clear, both the opioid epidemic and money laundering are serious issues in their own right. The fentanyl crisis has killed way too many British Columbians. As a recent report by Sandy Garossino notes, the criminal organizations associated with money laundering through BC Casinos have also claimed multiple lives. We should be outraged by the crisis and the crime ring, but it’s wrong, as Garossino adds, that this, “mainly bugs us because we figure it’s driving up the cost of housing in Vancouver.” The opioid epidemic demands more sustained attention than it’s likely to receive as a prop for tarring globalization. That’s not at all what it’s about. It requires a comprehensive re-think of our health care systems, pain management strategies, and criminalization of drug use, and the biggest villain in the story so far appears to be a major American pharmaceutical company. As for money laundering, further reporting on its role within the real estate sector has been promised by the Attorney General, but so far it’s not clear that shady practices – while certainly present – have had much to do with driving up real estate prices. As multiple commenters have noted, even if all the $100 million so far reported to have been laundered in our casinos over 10 years was re-invested in real estate, it would represent at most tiny fraction of total real estate transactions. Property transfer tax data shows that Metro Vancouver averaged $5.2bn worth of residential real estate transactions each month in 2017, dropping to $4.4bn during the first 5 months of 2018. There are real reasons to be outraged over the opioid epidemic and money laundering. But the link between these issues and affordability remains tenuous, and insisting upon the link in the absence of further reporting diminishes the importance of the documented damage they’ve already generated without pointing toward any good solutions for affordability, the opioid crisis, or tackling money laundering.

“Freeland could have been describing Vancouver: ‘Median wages have been stagnating, jobs are becoming more precarious, pensions uncertain, housing, child care and education harder to afford.’”

This is plain false. To its credit, back in February the NDP government moved to make childcare much more affordable for British Columbians. Why ignore this progress? Moreover, Vancouver has seen strong jobs and income growth. To gauge wage growth, we look at full-time employment income for couple families, lone parent families and unattached individuals and compare the trajectories to Metro Toronto.

figure-chunk-4

We see that Vancouver CMA has overtaken Toronto for non-family individual income and lone-parent median income, and almost closed the cap on couple family income.

figure-chunk-5

This shows how Vancouver’s labour force participation rate has increased with respect to Toronto while the unemployment rate decreased. Lastly we can look at the regional job vacancy rate for the respective economic regions to see how Vancouver’s job market is much stronger than the labour force is able to fill.

figure-chunk-6

Afterword

In our hyper-polarized environment it is probably not enough to simply point out factual errors without further comment. So we take this opportunity to state that we strongly support stricter oversight and enforcement of money-laundering, as well as implementing measures to increase transparency in property ownership. We are also gravely concerned about Vancouver’s affordability problems. We’ve supported a number of housing policies recently put forward by local governments, including the empty homes tax, the school tax, and the boost to social housing investments, all aimed at fixing regulation and providing more housing to those most in need. It’s important to separate out what governments are doing right from where they might be failing. This is where swamp imagery fails us, blending everything together and dragging it all into the mud.

We think fixing our affordability problems is going to involve making tough choices and policy tradeoffs, and we should approach them with a clear sense of what’s at stake rather than mixed up facts, vague swamp-ish imagery and the sense it can all be blamed on the dark, corrupting forces of globalization. We’ve all seen where that last route can take us.

As usual (for Jens), the underlying R Notebook for this post that includes all the code for the graphs and numbers in this post is available on GitHub. Feel free to download it to reproduce the analysis or adapt it for your own purposes. Hopefully this kind of transparent and reproducible analysis can help establish a shared base of facts. And reduce the amount of guessing needed to make sense of people’s numbers and statements.


Update (July 27, 2018)

Several people have pointed out via Twitter and comments that inflation-adjusted income growth might be a better metric to use. And that’s a good point. In the context of housing we often have nominal housing prices in mind, so nominal income can be a good metric in this context. But inflation-adjusted incomes add another important perspective.

figure-chunk-Add

Here we used Canada-wide inflation estimates, Vancouver’s income growth looks even stronger when normalizing by CMA-specific CPI. (Digging into the reasons for this would probably make another interesting blog post.) The two graphs show the inflation-adjusted incomes, as well as change in adjusted incomes indexed to 2000. We can clearly see the growth in all categories, both in absolute terms, as well as in relative terms compared to Toronto. Despite this, the notion of “stagnant incomes” in Vancouver is quite pervasive in news stories.