We now have over six months of pandemic conditions in Vancouver and crime data to (roughly) match. We also have all kinds of claims about crime flying around, sometimes pushed by the police (VPD) themselves, only heightened by click-seeking reporters and the vote-seeking politicians. So we should probably check into the data. Long story short: there’s scant evidence of a crime wave showing up in the VPD crime data.
First a quick round-up of claims. Let’s start with a recent police report, promoting the idea that crime, and particularly assaults, have risen. This was touted by various media reports and politicians as pointing toward a breakdown in law & order associated with the pandemic and prominent tent cities in parks near downtown. But the police report – though they failed to emphasize this point properly – explicitly referred to data from the first two quarters of the year. In other words, they mixed pre-pandemic and post-pandemic data from earlier in the year, and this data was used to make claims about conditions on the ground now. This was perhaps potentially useful to the VPD in the face of calls to defund the police, but bad form overall! The report has been joined to anecdotes, polls, and neighbourhood and political campaigning all pushing the idea of a pandemic-induced breakdown in public order.
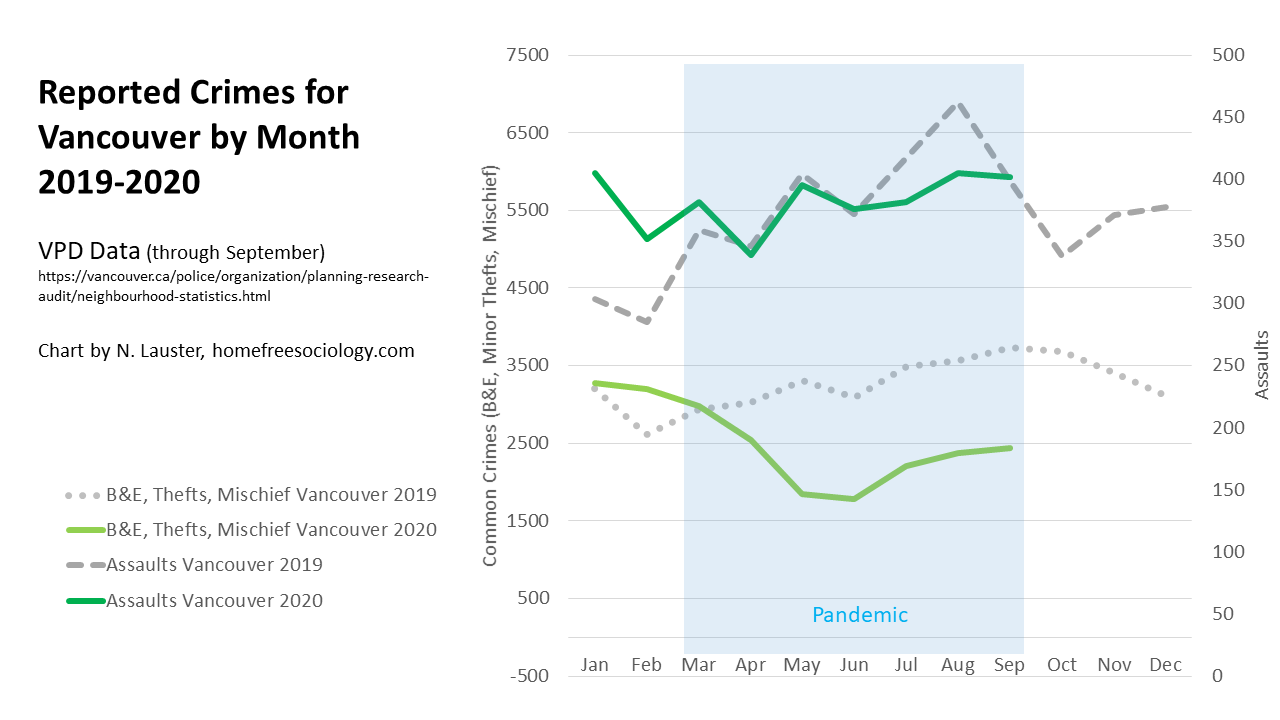
Despite the VPD reporting only on data from January to June, regular monthly VPD data now extends through August. We can use this data to more carefully separate pre- and post-pandemic conditions. Let’s first do this for the most common crimes reported (i.e. those where trends are most easily distinguished from random variation). These include both violent (Assaults) and non-violent (Break & Enters, Thefts of Motor Vehicle, Thefts from Vehicles, Thefts up to and around $5,000, and Mischief) crimes, all of which tend to average more than 100 cases a month. We’ll compare all of 2019 to the pandemic period we’re currently experiencing. What’s that look like?
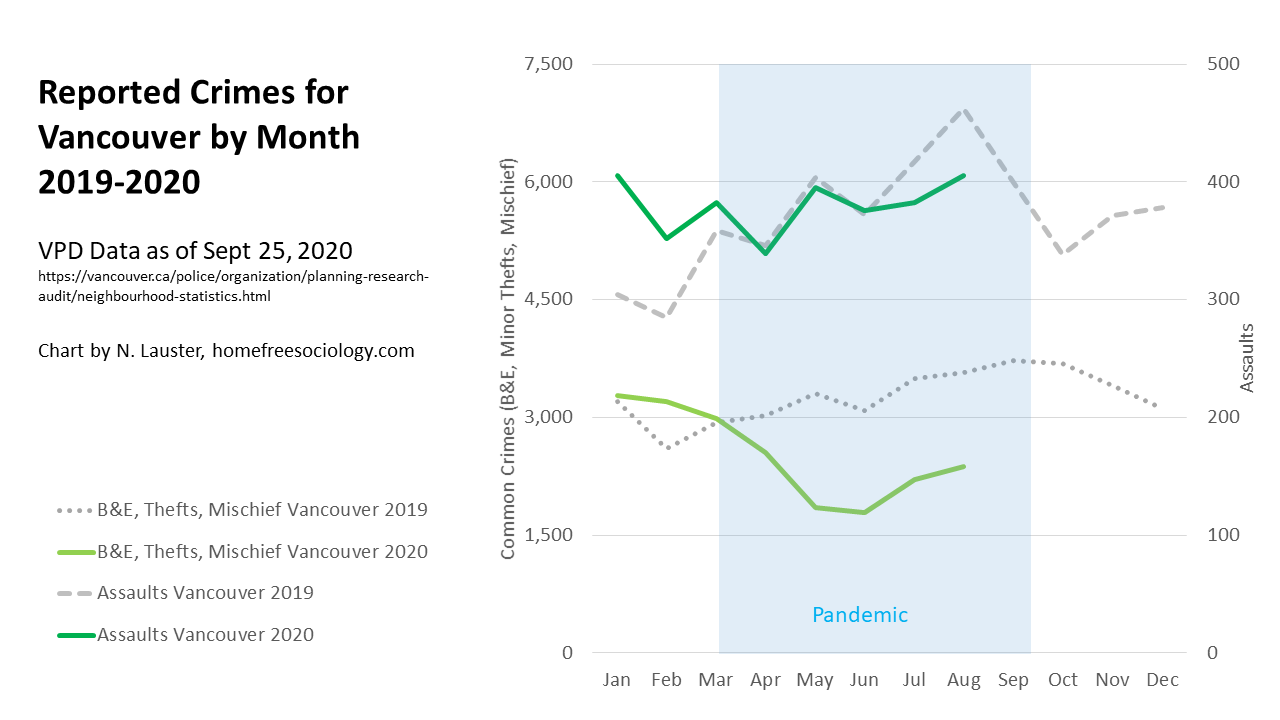
Let’s start with assaults, the most common violent crime (top lines above). It looks like any rise in assaults relative to 2019 occurred BEFORE the pandemic. Indeed, for July and August, we’re running well below where assaults were in 2019. Of course it’s possible that the composition of assaults have changed, with drunken brawls on Granville down, and hate crimes up. So it’s worth paying closer attention to the data than is available in VPD reporting. But there’s nothing about post-pandemic 2020 that looks like a violent crime wave.
The picture for common non-violent crimes is more suggestive. But here it looks like we’ve seen a dramatic drop in crime reporting associated with the pandemic. The seasonal pattern from 2019 whereby crime rises through the summer months looks like it might’ve been replicated in data from June to August of 2020, but at a much lower level overall relative to 2019. Looking at the most common crimes, we’re not in a crime wave. If anything we’re in a crime trough.
But does it cover the spots most identified as trouble spots by recent political rhetoric? The VPD data also allow us to break out data by neighbourhood. Here I’ll zoom in on Downtown Vancouver (the Central Business District) and the Strathcona neighbourhood, both of which surround and contain the neighbourhood of the Downtown Eastside, where many have recently claimed a breakdown in public order (also associated with tent cities in parks) is threatening public safety. What do assaults look like in these neighbourhoods?
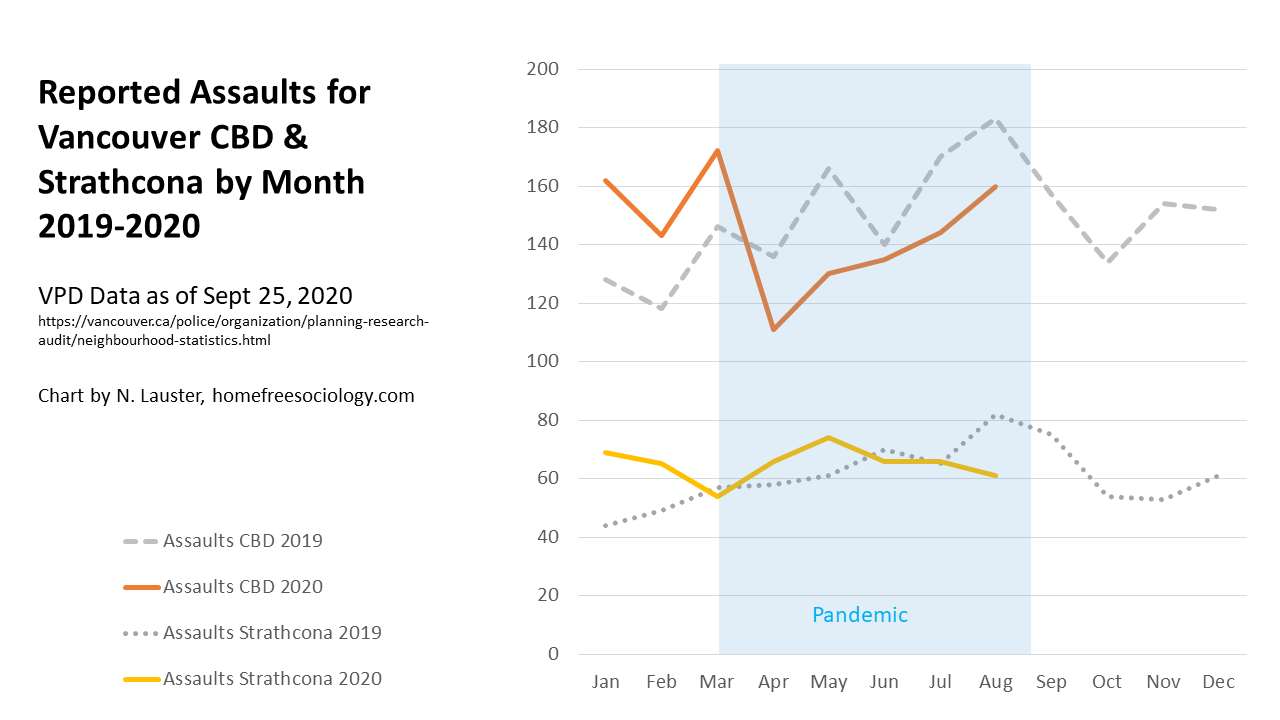
The patterns for assaults are pretty similar in these neighbourhoods as what we see for the city as a whole, but there as some variations. Assaults downtown ran high in January and February, but seemed to drop dramatically at the beginning of the pandemic, and have since risen with the warm weather, but not to levels comparable level to 2019. In Strathcona there wasn’t any sustained drop in assaults early in the pandemic, but relative to 2019 they declined from heightened levels in January and February to roughly match and recently drop below 2019 patterns.
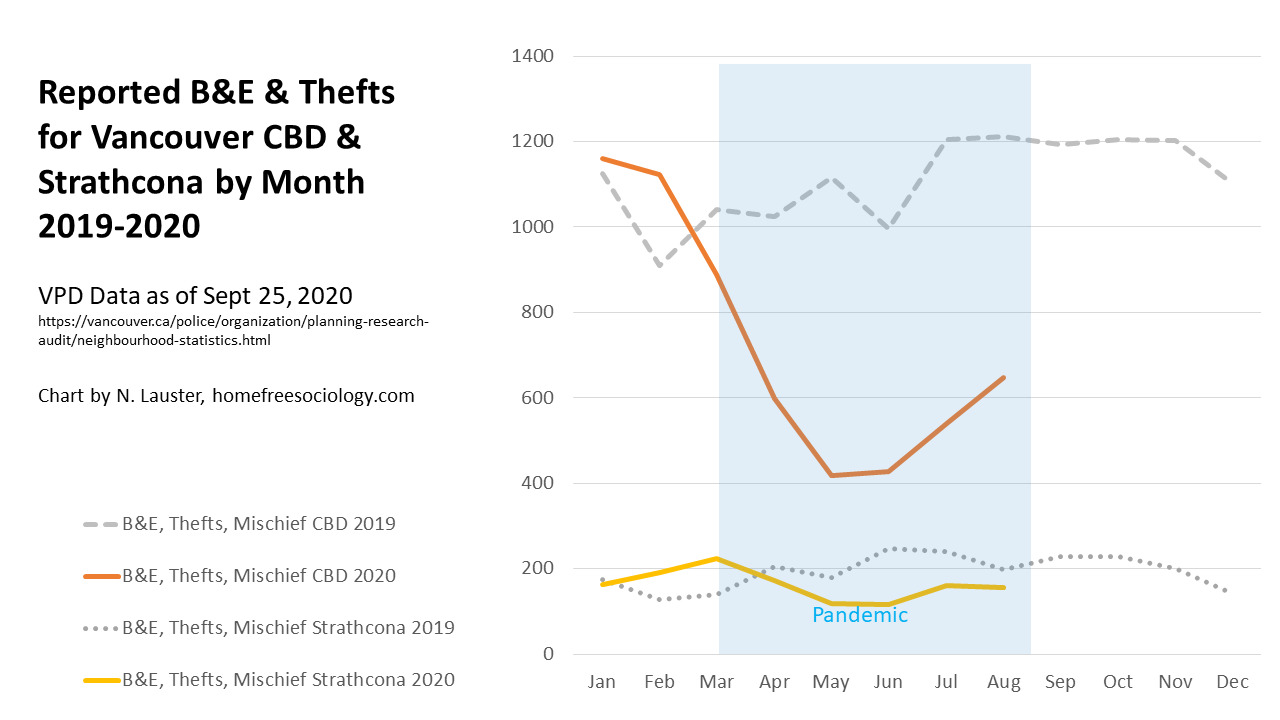
The pattern for non-violent common crimes looks much the same for Downtown and Strathcona as it does for the rest of Vancouver. There’s been a big and sustained drop in these kinds of crimes relative to 2019. If there’s been a breakdown in public disorder, it’s not showing up in common reported crime data.
Are we seeing anything different in less common crimes? I’m wary of monthly patterns in the data, but including March, we’ve now got six months of data since the pandemic began. So let’s look at all kinds of crime reported by the VPD and compare the six months of the pandemic (March – August 2020) to the data for the six months prior (September 2019 – February 2020), as well as the six months matching the same year-over-year period (March through August) from 2019.
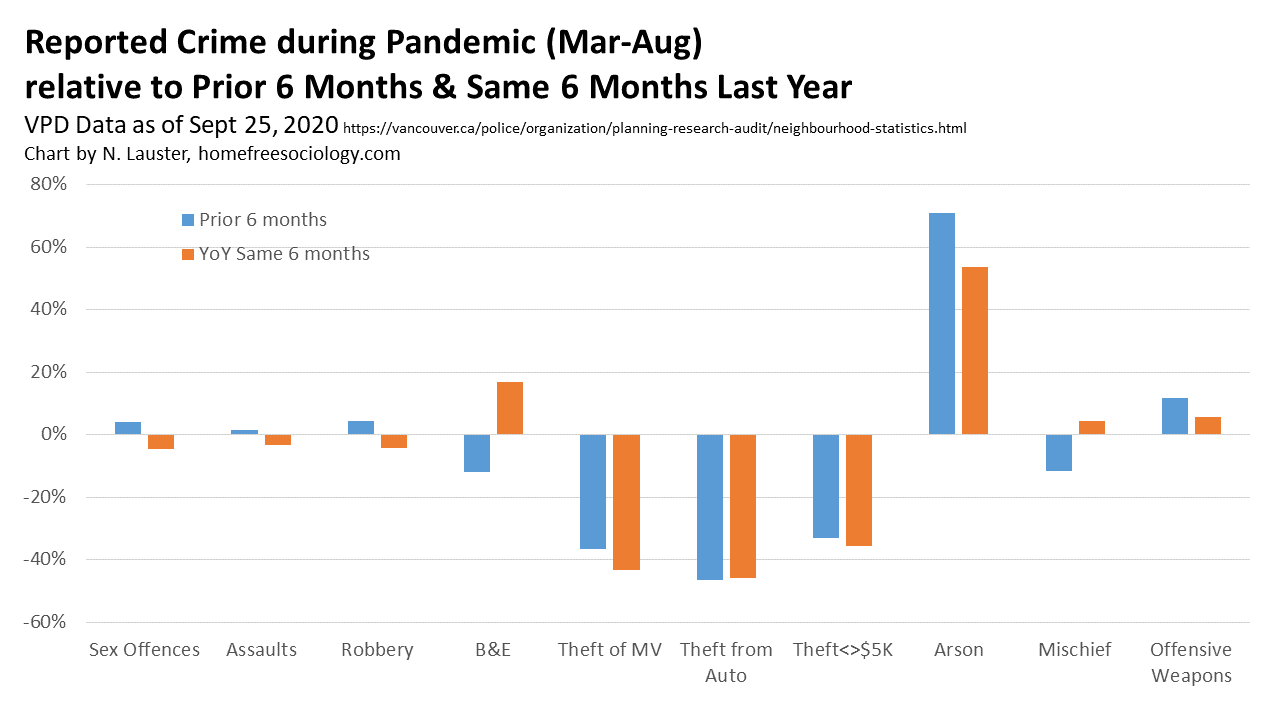
Here we can see that there’s not a lot of variation in most crimes between how they’ve appeared in the pandemic relative to the prior six months or the same set of months last year. The most recent drop off in Assaults doesn’t really show up as notable across the full six month period. But the decline in Thefts of all kinds is striking and strong (as compared to the other crimes of Break & Enters and Mischief, which appear down relative to the prior six months). Overall, very little evidence to support a pandemic crime wave. But there is one exception to the trend…
What’s up with Arson?
Any interpretation of Arson data needs to be keep in mind that Arson is not a common crime, but let’s set aside my concern about random fluctuations to just take a peek at the monthly arson data. Is this a sustained rise, or driven by a weird month?
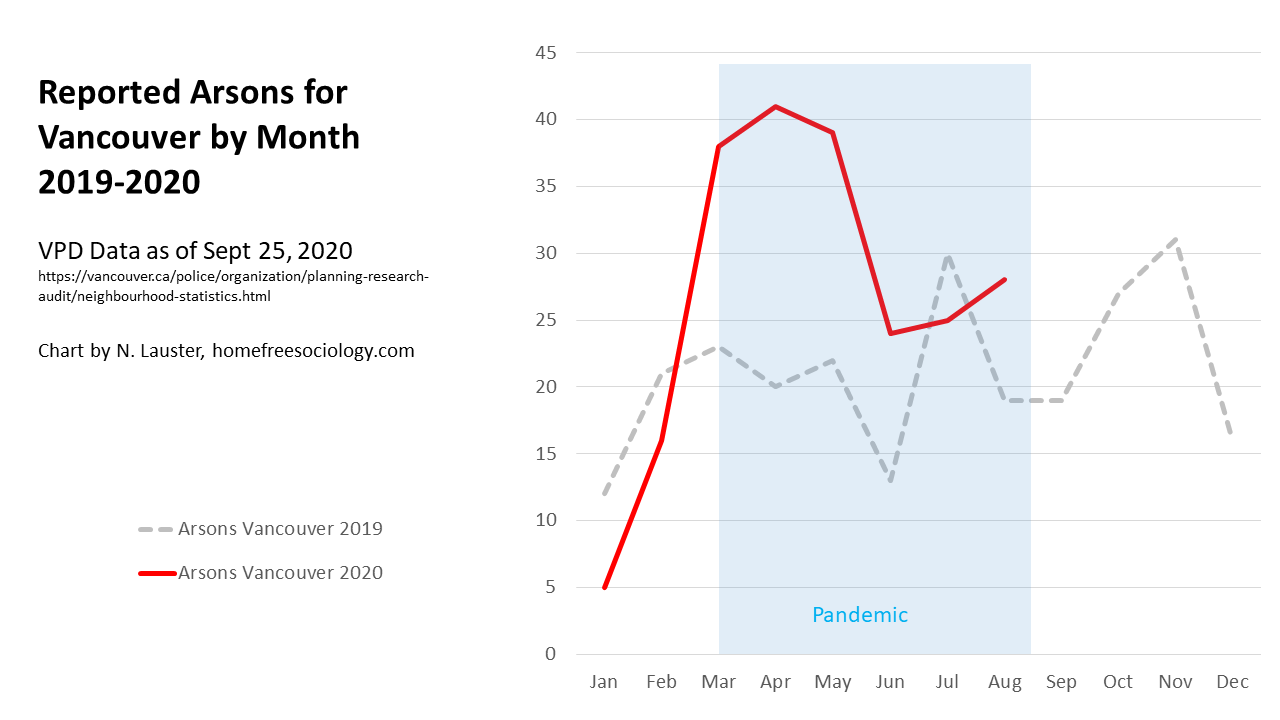
That looks… pretty sustained. Though arson cases generally remain rare relative to other kinds of crime (nowhere near my arbitrary cut-off of a hundred cases a month for common crimes), they appear to have gone up, mostly in conjunction with the pandemic itself. The one month during the pandemic where they drop below 2019 levels looks like a weird spike in arson in July of 2019.
It’s hard to fully interpret the arson data without more context. Properties left unattended subject to a particular form of mischief? Business owners weighing their insurance policies against the cost of staying open? Pretty interesting… but who knows? Not me. The consequences, as with the New Westminster Pier, can be terrible. But overall, arson is still pretty rare.
My big takeaway: we’re not seeing a big crime wave associated with the pandemic here in Vancouver. Anyone running on that theme would appear to be doing so with bad information or in bad faith.
If anyone wants to play around with the data themselves, I’ve downloaded the VPD monthly report pdfs into a common spreadsheet here, complete with the summary of data and figures above. Enjoy!
*** UPDATE Nov 17, 2020 ***
Given that crime and VPD remain in the news with the VPD’s survey on crime feelings and attempt to set up a new unit, I thought I’d update the chart to their latest data (now from September, but October should be out soon). The story remains consistent with the above. Feelings aside, no evidence of a pandemic crime wave, assaults comparable or below 2019, common property crimes still waaay down.