
A couple of months ago I took the blog for a visit to the airport to check out historical passenger data and see what’s happened since COVID. Today I want to return, both to provide an update and to pull YVR Passenger data (enplaned & deplaned pdf) together with BC CDC Flight Exposure data (full pdf), providing a check on air travel’s contributions to spreading COVID.
First the update!
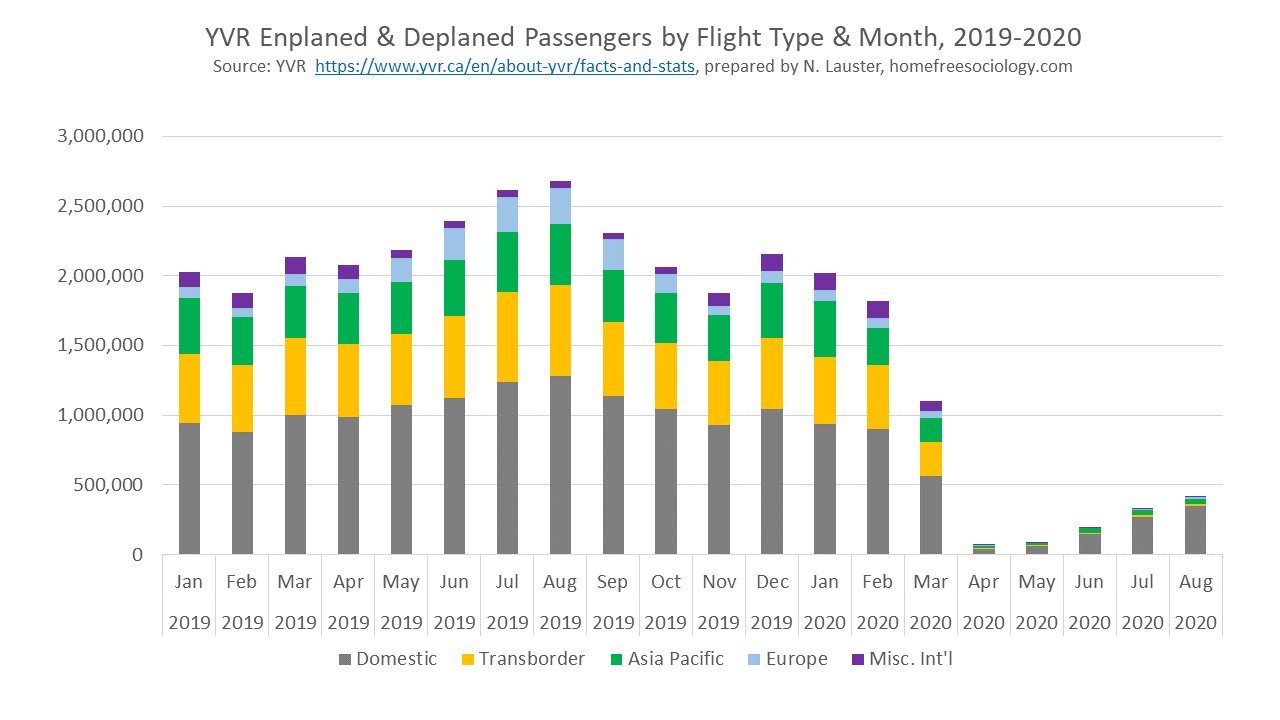
We can see that through August (last month of data available as of today), flights are still gradually rising toward a return to 2019 levels, but they’ve still got a loooong way to go. Mostly the rise has been led by domestic air travel within Canada. We can zoom in, looking at monthly passenger totals for 2020 as a percentage of passenger totals for 2019.
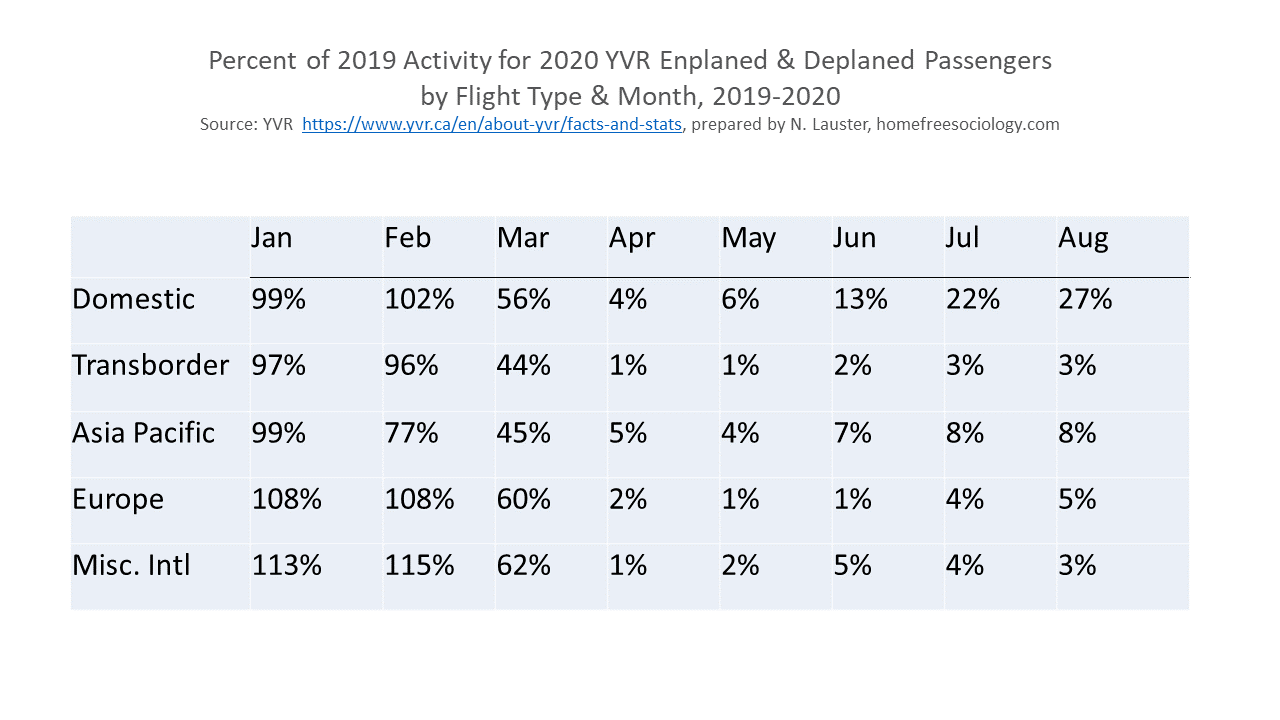
Sure enough, by the end of August we’re back up to over a quarter of the Domestic air travel from the same month in 2019. International flights still remain far below 2019 levels, with the biggest drop in Transborder trips between Vancouver and cities in the USA. Miscellaneous International trips that mostly cover Latin America and the Caribbean have seen a recent decline from slightly higher numbers in June and July. Passengers to and from Asia Pacific destinations never dropped as much as other international passengers and have bounced back a little, and passengers to Europe appeared to rise through July and August.
So how are we doing containing COVID exposures on these flights? The BC CDC lists exposures by flight number, origin and destination, and affected rows, and as of today includes exposures through September 30, though given lags in reporting it’s possible the September listings aren’t yet complete (none have yet been listed for October). Here I separate inbound and outbound flight exposures for Vancouver by Origin/Destination Stream roughly matching YVR categories (I remain less certain exactly how flights to and from Mexico fit in, and have included them here as Misc. Intl).
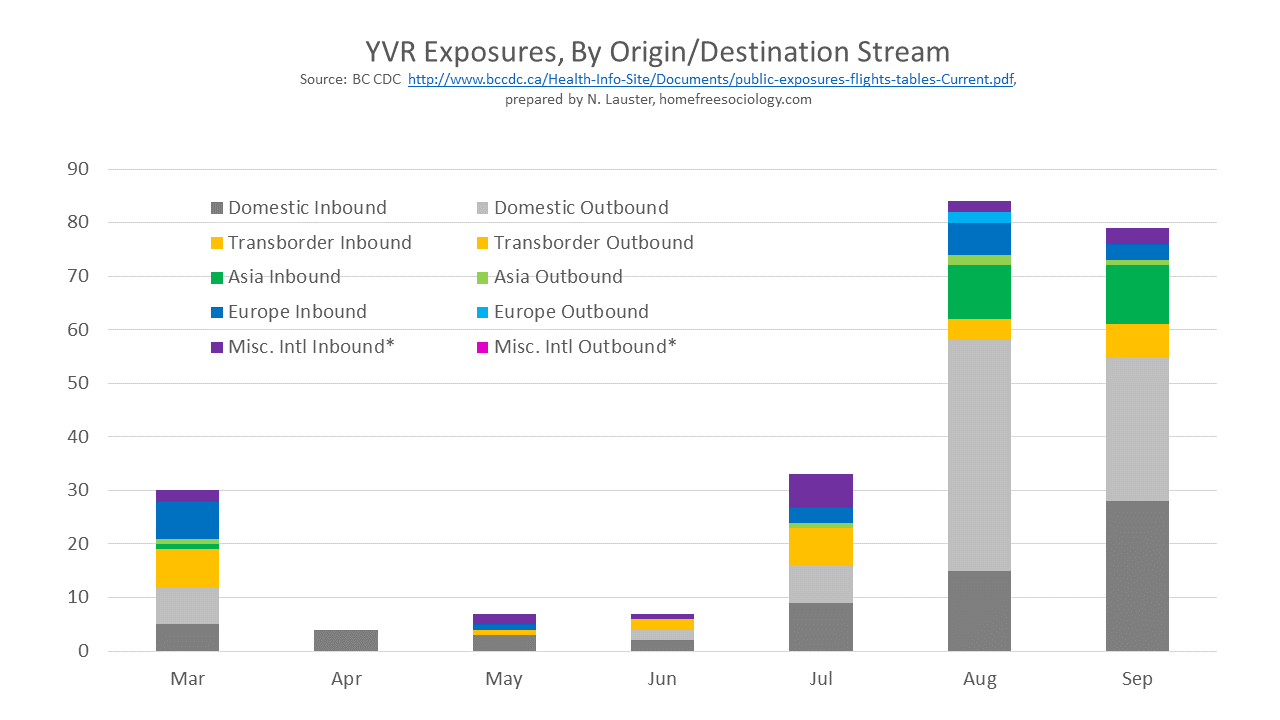
Overall, it’s clear that COVID exposures on flights have declined and then risen again with flights overall between March and August, with the pattern likely continuing into September (again, we don’t yet know if September data is complete and we don’t have YVR passenger data for September yet). Domestic exposures dominate flight exposures overall, especially the rise in August and September.
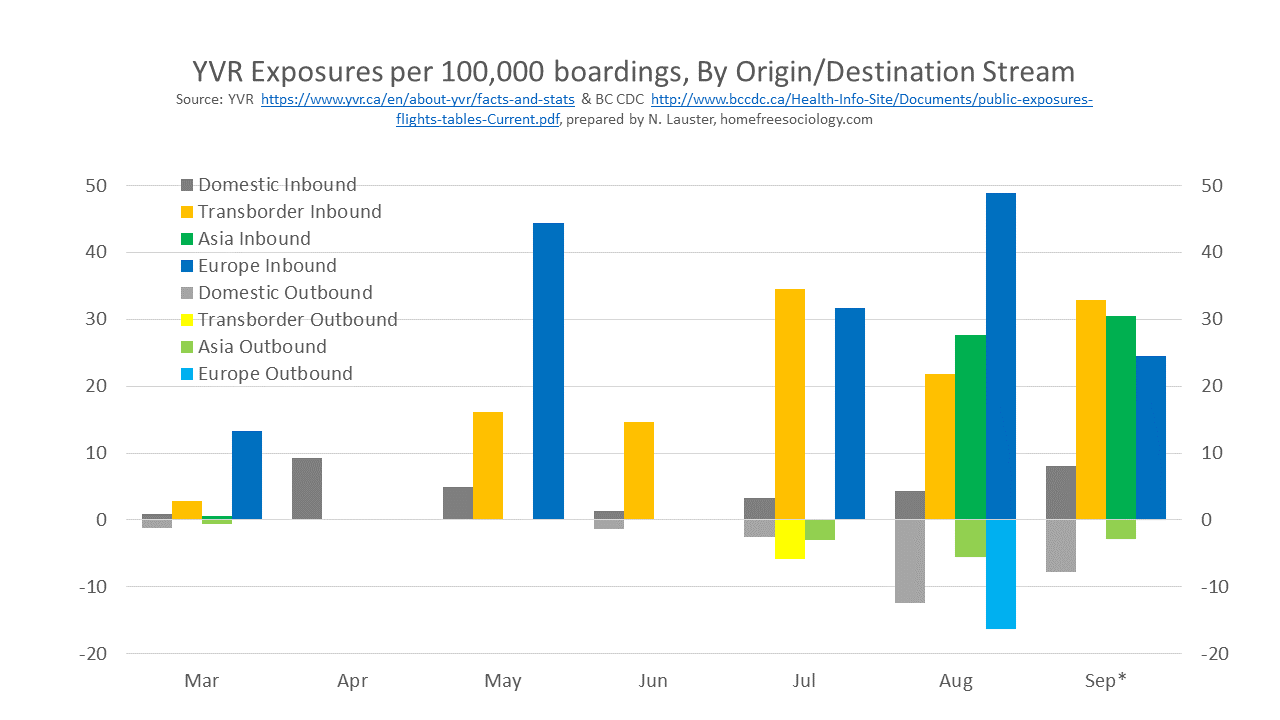
Finally, we can combine the two sources of data to provide a rough estimate of the inbound and outbound specific risks associated with exposures. How many exposures do we see per 100,000 passengers for different streams of travel? Here I’ve given outbound exposures negative values, and inbound exposures positive values, which tells us something about the direction COVID is traveling relative to YVR during exposure events on flights. I’ve proxied September passenger data with August passenger data to match with September exposure data, and I’ve dropped International Miscellaneous flights, which mostly involve flights to and from Mexico and harder for me to confidently link to passenger data.
A few takeaways:
- We get the sense that risks of exposures per 100,000 boardings are real, but generally pretty low, at least as discovered and reported by the BC CDC (where are there have been occasional transparency issues).
- We can also see that while most YVR related COVID exposures are happening on Domestic flights between Vancouver and other Canadian cities, the risks of exposure on these flights tend to be lower than the risks of exposure on inbound international flights.
- We get a peek at the gateway pattern by which international exposures tend to arrive at YVR from elsewhere, while YVR has tended, in recent months, to send more exposures to the rest of Canada than it receives from Domestic flights.
- Finally, while all inbound international travel remains risky relative to domestic travel, European and Transborder (USA) flights generally alternate the lead for most risk, with Asia Pacific flights trailing. That said scanning the international exposure data reveals that European and Transborder risks are generally diverse across cities, while most recent Asia Pacific exposures seem to relate specifically to flights to and from Delhi.
Big takeaway: the tentative and on-going return of air travel will likely continue to contribute to the on-going return of COVID infections, both Domestic and International. Air travel provides a key link between the rise in cases elsewhere and what happens here, potentially turning visitors into vectors. Definitely something to keep an eye on as we continue into Fall!

In theory higher rates should be coming from Toronto, Montreal and other areas of high incidence. Unless they are doing more preboarding screening. With lower incidence in BC there should be fewer cases originating here. Unless the screening is slack. You might compare airlines?
LikeLiked by 1 person