
So, what’s happening at the airport these days?
Here in Vancouver (or more specifically, Richmond), I discovered that YVR actually posts some of their data. This is great! I’m going to look at their recent passenger data to get a sense of two things. First, how much air travel into and through Vancouver has grown in recent years. Hello globalization! Second, how much air travel into and through Vancouver has shrunk in recent months. Hi there world-wide pandemic!
Let’s take a look, first at annual data, which YVR has posted from 1992 on. Of note, this series begins just YVR completed its international terminal expansion in 1996. Also, the series starts after Vancouver’s first global party event (Expo 86), but before its second (2010 Olympics), both of which are mentioned in YVR’s declarative history of the airport.
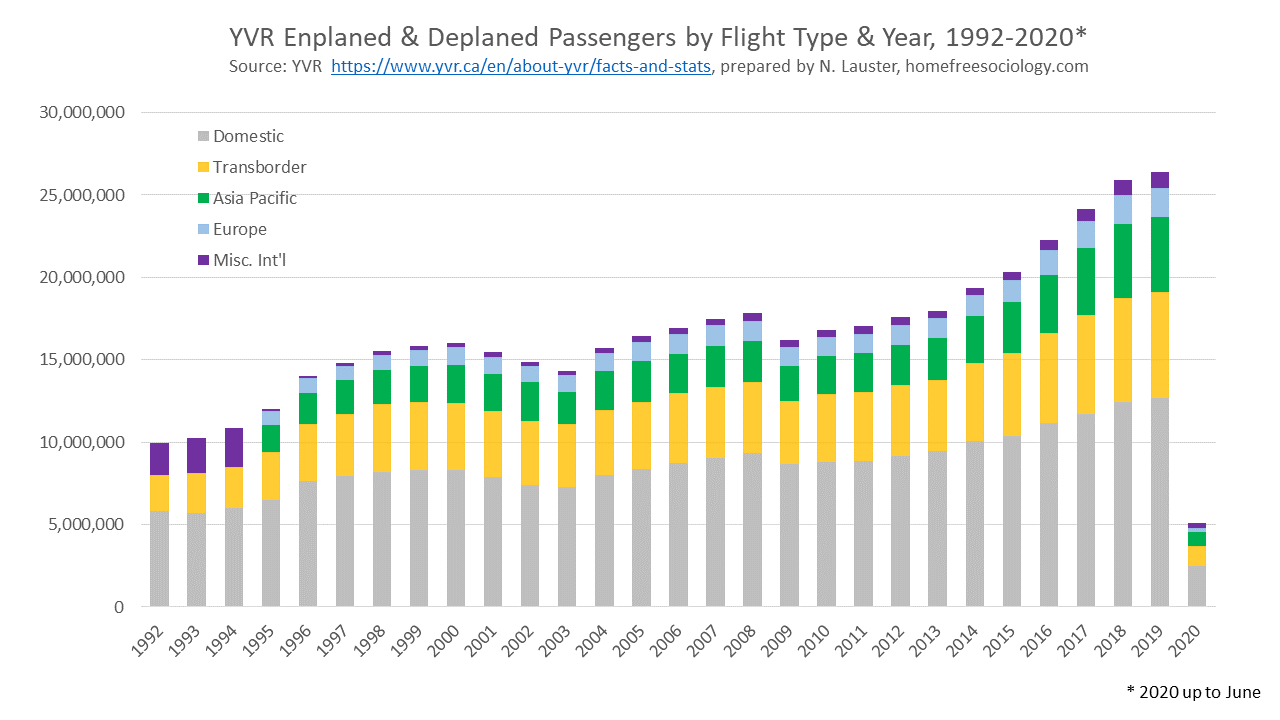
The data cover all “enplaned and deplaned” passengers, so everyone coming through YVR for air travel. They break down the passengers by domestic, transborder, and other international travel. From 1995 onward, they also helpfully break out Asia-Pacific and European passengers from other miscellaneous international. My working assumption is that passenger categories mostly mirror YVR’s organization of flight destination information, so that Domestic covers all flights within Canada, Transborder covers flights to the USA, Asia-Pacific covers flights to Mainland China, Hong Kong, Taiwan, India, the Philippines, Japan, South Korea, New Zealand, and Australia, and Europe covers flights to the EU plus the UK. Misc. Intl. covers everyone else, but probably mostly picks up flights to Mexico and the Caribbean / Central America. Of note, there’s enough ambiguity in labeling that it’s possible flights to Mexico fit in the Transborder category instead, but I’ll assume we’re just talking about the immediate border there.
The big patterns are dramatic growth in passengers between 1992 and 2019. There are waves to the growth, which really seems to kick off in earnest with the expansion of the international terminal in 1996 before retracting a bit by 2003, then expanding in near linear fashion till the recession of 2009. From there, once again we’re back into a dramatic rise until… well… 2020. Where we don’t yet have full data, but needless to say, we expect we’ll see a drop. Once all the data’s in, we’ll probably end up somewhere back in 1992 territory. We’ll have a look at monthly data in a moment, but first let’s also point out two other patterns.
First, despite the name-check of the 2010 Olympics in airport marketing materials, we see no real evidence that 2010 was anything special for passenger traffic. It fits right about where we’d expect it to be on the ten-year rise between 2009 and 2019.
Second, the growth in passenger air travel through YVR has been widespread. It’s not driven by any one category of destination. But the rise of globalization is apparent. Domestic air travel between 1992 and 2019 more than doubled. But transborder travel nearly tripled and other international passengers nearly quadrupled over the same time period. Other international passenger travel is only broken down by Europe, Asian Pacific and other categories from 1995 on. Here we can see that the rise in Asian Pacific destinations leads international growth, but the growth remains widespread. Of note: seats for Hong Kong appear to be only the second most common destination outside of Canada, just behind seats for Los Angeles. Despite Hong Kong’s extensive ties to Vancouver, it’s hard to make out for certain any particular upswing in flights to the city surrounding its handover to China in 1998.
Back to the present! Let’s zoom in on 2019 to 2020:
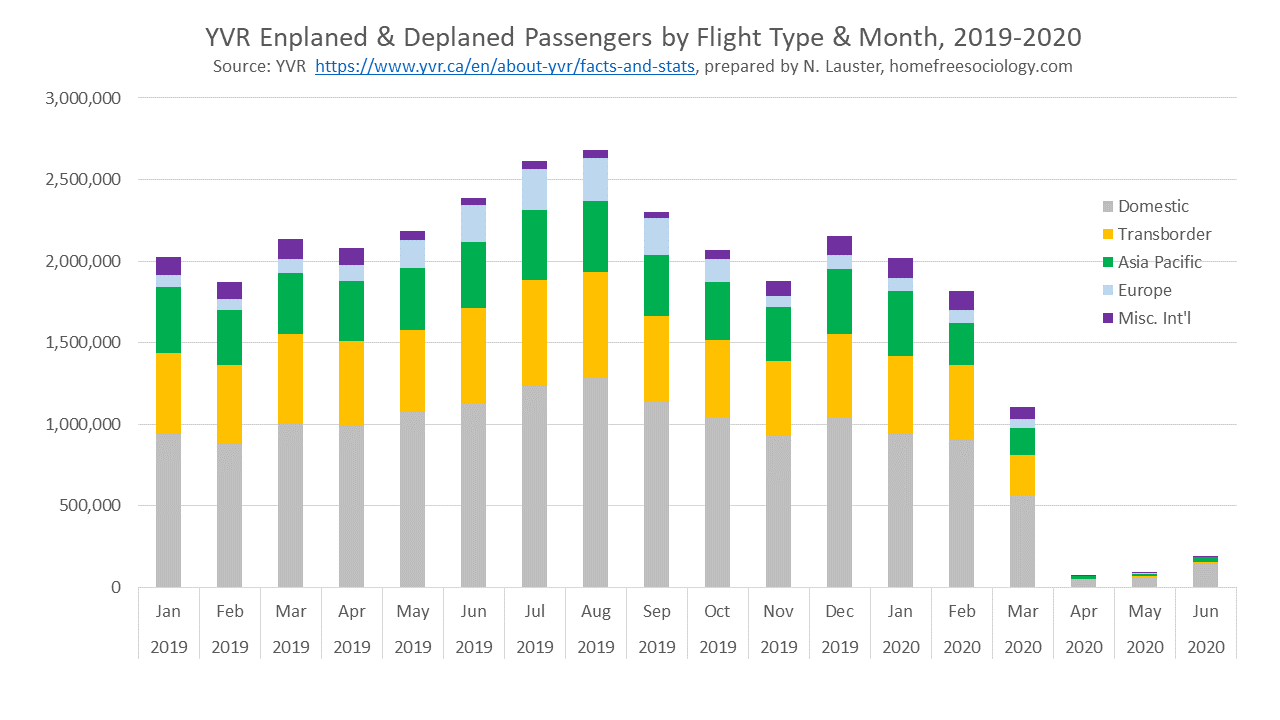
There’s our pandemic effects! Normally February begins the climb back to summer travel highs. Instead, March saw a big drop with quarantine restrictions put in place, and the drop only got bigger in April. Since then there’s been a very modest recovery into May and June, which likely continued into July (data forthcoming). After a couple of months of quiet, I can certainly hear the jets back in the sky again. But they’re still not carrying very many passengers.
Here’s 2020 again, looking at percentage of 2019 monthly passenger data by category:
| Jan | Feb | Mar | Apr | May | Jun | |
| Domestic | 99% | 102% | 56% | 4% | 6% | 13% |
| Trans-border | 97% | 96% | 44% | 1% | 1% | 2% |
| Asia Pacific | 99% | 76% | 45% | 5% | 4% | 7% |
| Europe | 108% | 108% | 62% | 2% | 1% | 1% |
| Misc. Int’l | 113% | 118% | 62% | 1% | 2% | 5% |
We can see that the biggest recovery, so far, is in the Domestic category. Not surprising, given that the provinces have lifted most of their quarantines against travel within the country. Canada continues to impose a travel restrictions for other international travel. But the next biggest recovery is for flights between Vancouver and Asia Pacific, where COVID recoveries so far tend to look the strongest. Misc. Int’l flights, continue, but travel to the US and Europe remains almost non-existent. At least as of June (Europe began lifting travel restrictions in July). Of note, of course, we’re still experiencingair travel related exposures (h/t Jens).
Every decent human being is looking forward to the end of the pandemic. But do we want air travel to come roaring back to where it was? There are lots of things to think about, like the emissions associated with air travel. But there’s also little doubt that here in Terminal City, air travel is now how an enormous proportion of our visitors arrive and how many Vancouverites get around. So no matter what, it’s worth keeping an eye on the airport.

One thought on “Let’s Visit the Airport!”