
Updating my mini–series on flights and exposures through YVR airport in Vancouver. No particular reason…
Here’s passengers on flights in and out in and out of Vancouver. Unfortunately the series I get from YVR still ends in November, so we don’t have the full update on how many holiday trips we should be enraged about for those of us avoiding non-essential travel. But we can see that since the arrival of COVID, passenger travel dropped dramatically, then slowly rose in what looks like some combination of a response to lessening restrictions / fears and seasonal patterns.
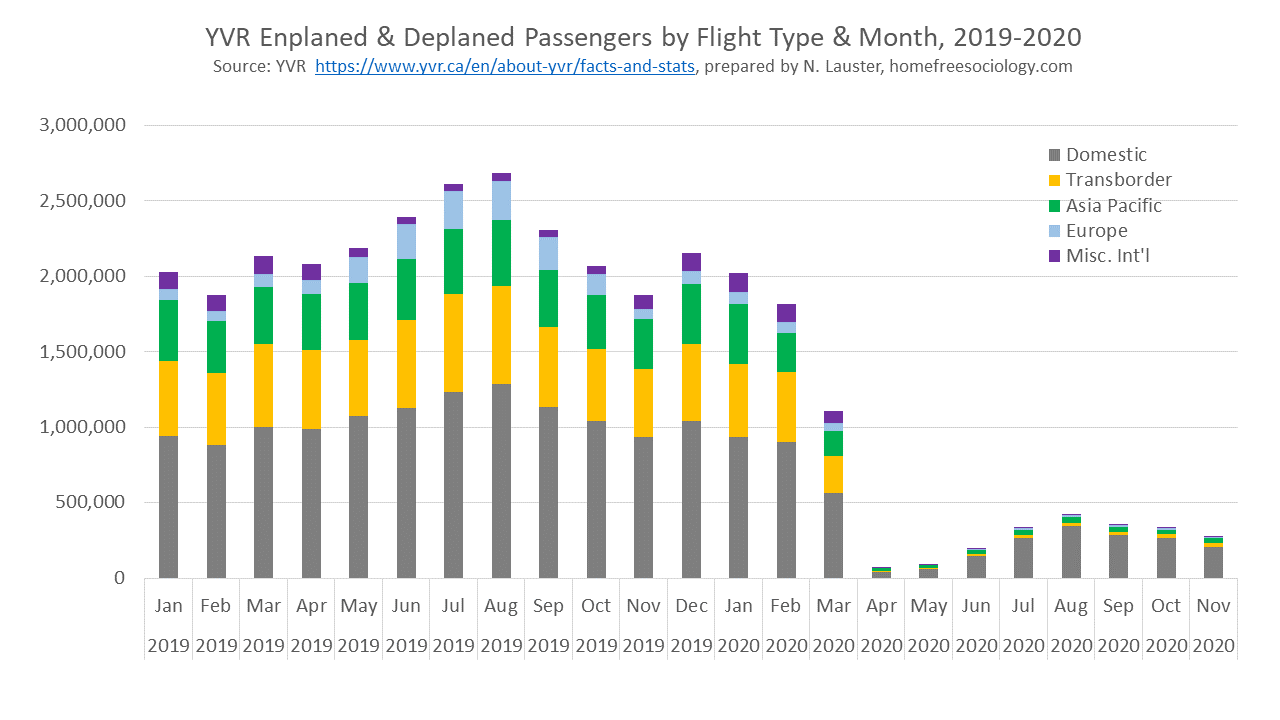
Speaking to the persistence of seasonal patterns, we can see that August 2019 was the pre-COVID peak for travel, just as August 2020 represents a post-COVID peak for travel. Since then, travel has eased off, which may also reflect the second wave of COVID. The combination of seasonal patterns and renewed COVID concerns might be seen a little more clearly looking at year-over-year passenger patterns in 2020 explicitly compared to 2019. For Domestic passengers, in particular, it looks like travel recovered up to about one-quarter of pre-pandemic levels by August, and pretty much stayed at that level through October, but we may see some evidence of a fall-off in response to the second wave of COVID in November. That said, I have to imagine that once December figures come out, we’ll see a jump in travel, just like in 2019, pointing to the continuing persistence of seasonal patterns.
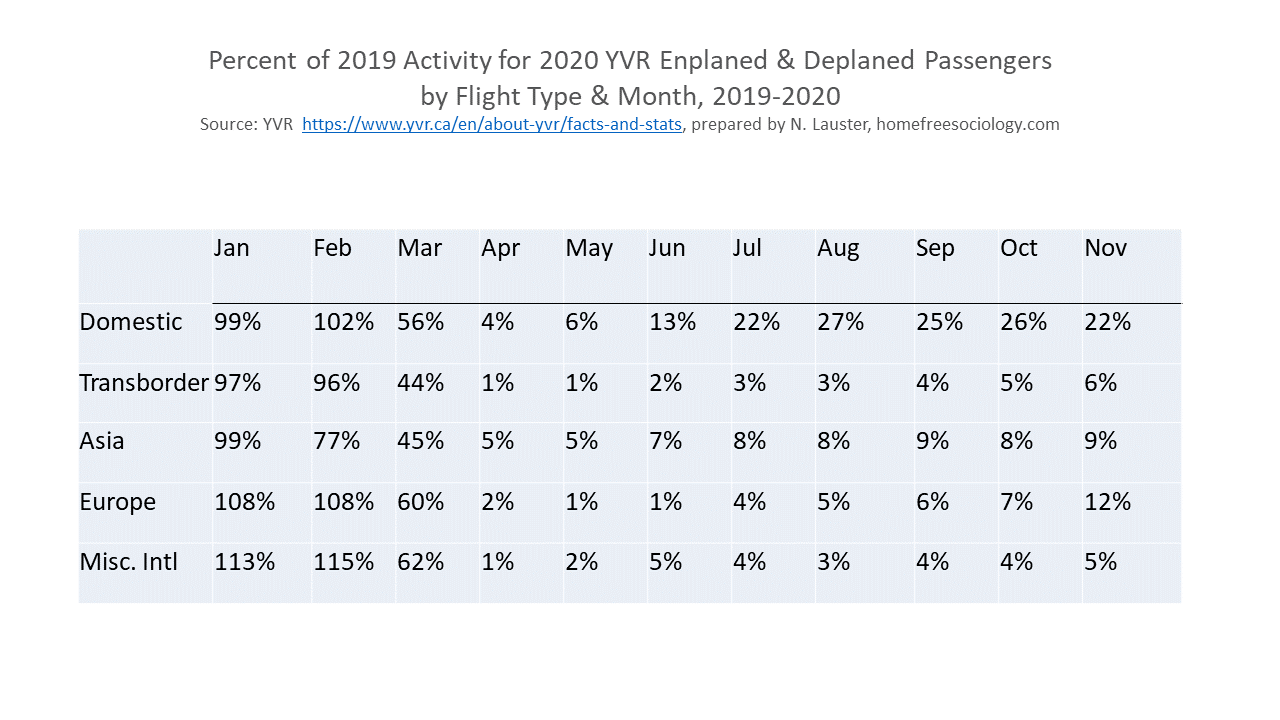
International travel patterns are different, and more than a little troubling, insofar as they don’t seem to be at all responsive to the second wave of COVID. Though the progress has been much slower than for Domestic travel, International travel just keeps rising back toward historic norms, led, in November, by a sharp jump in travel between YVR and Europe. Yikes.
But how much is all of this jetting around really contributing to the spread of COVID? Unfortunately, we don’t know. Our surveillance system, data consolidation, and transparency game is still pretty weak here in BC. But we can get a very conservative sense of the changing scale of the contribution by just looking at the BC CDC Flight Exposure data (full pdf). There we see a remarkably steady upward rise in flight exposures, despite the leveling off in the overall number of passengers carried. Yikes, yikes!
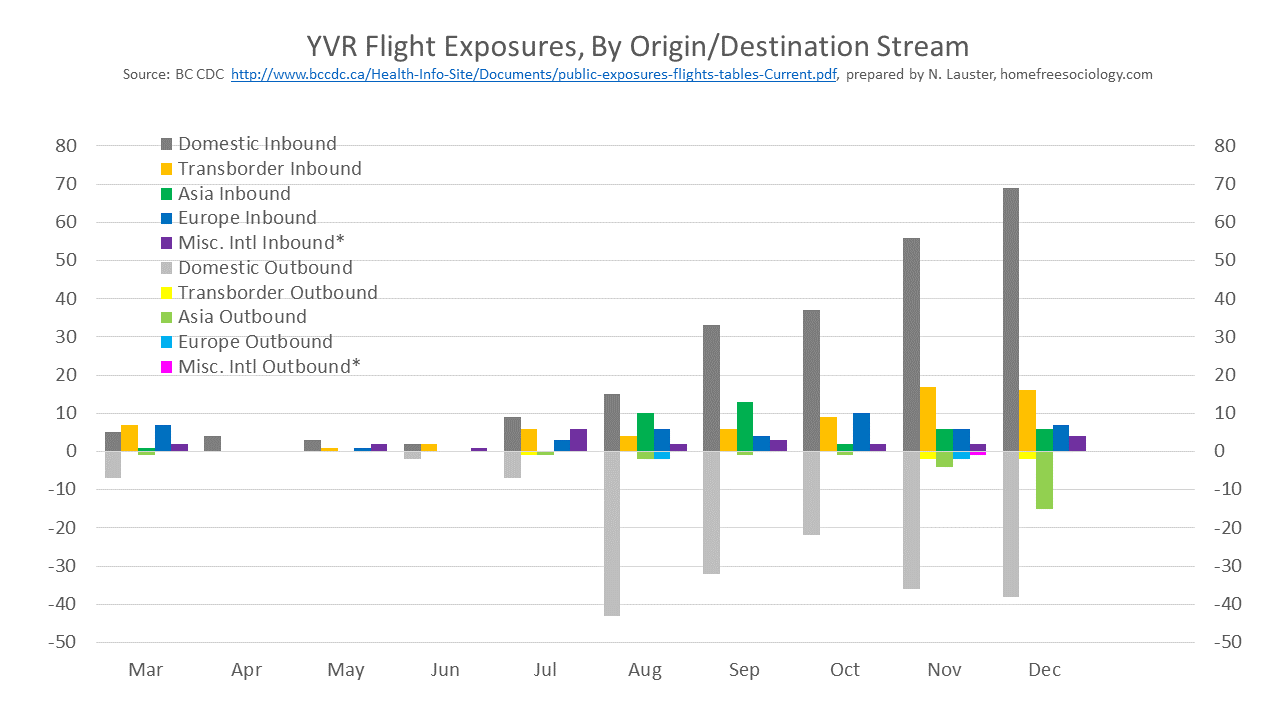
Once again, posted exposures represent a very conservative estimate of how air travel is contributing to spread of COVID. Obviously, given the combination of asymptomatic cases and our lax testing regime, the BC CDC still isn’t catching all cases. We also don’t get the actual number of confirmed COVID cases per flight, just whether or not there’s been an exposure, and corresponding rows assessed as being at risk. Sometimes there are multiple seat sections, suggesting multiple, and potentially unrelated COVID cases aboard some flights. But the big takeaway is that even before holiday travel, airlines were already jetting around more COVID cases than at any other time in the pandemic.
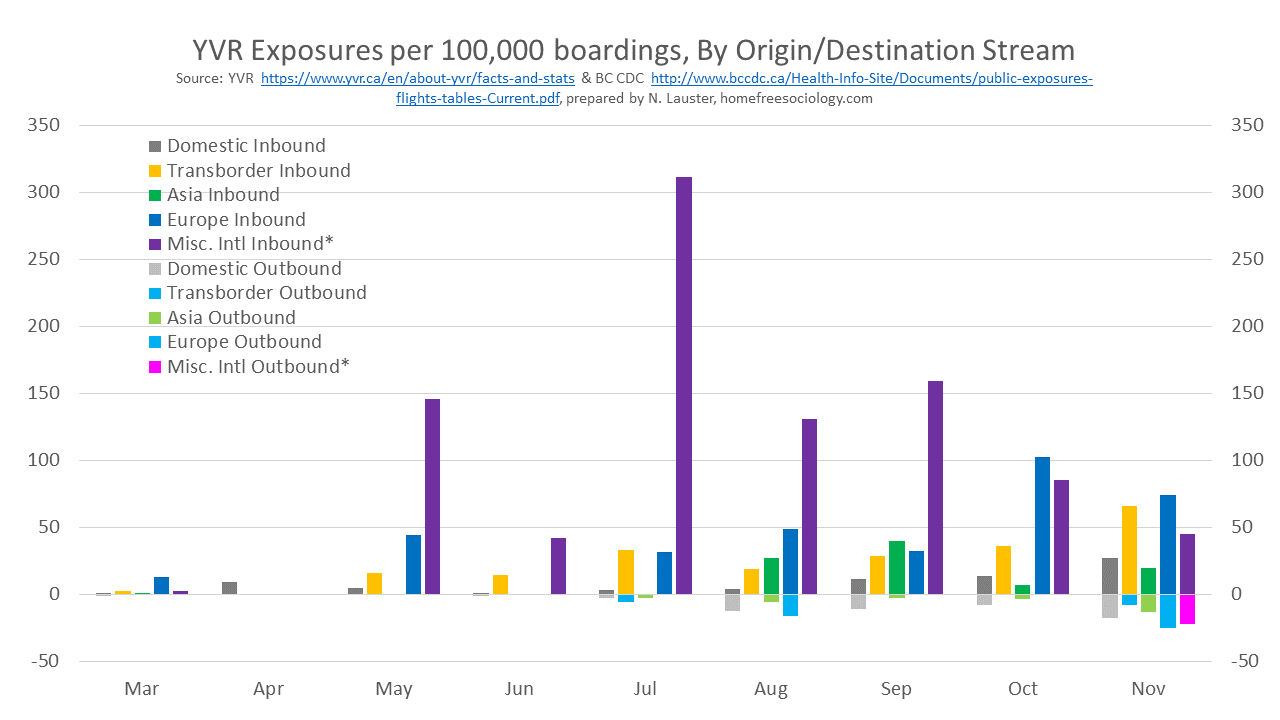
I’m not sure it’s as useful, but for consistency’s sake, I’ll also post the exposures per 100,000 passengers, which I played around with in my last post. Last time I didn’t include the Miscellaneous International flights, because there weren’t very many, but they included a lot of exposures, and also because I wasn’t entirely clear on the reporting of flights to Mexico, which is where nearly all the exposures occurred. This time I’ll add those flights back in assigned to my best guess of how to combine the data, in part because Mexico seems to be where a lot of non-essential vacationing is occurring. Unfortunately, once again, we only go up to November data. The data highlight just how risky travel to common vacation destinations in Mexico has been, especially back in July, though by November the US and Europe had moved into riskier positions. That said, the chart really obscures the steady rise in risk of exposure for domestic travelers within Canada, still representing most of our travel.
Overall, though data remains poor, we appeared to be flying around an increasing number of COVID cases through 2020, significantly complicating efforts to contain the virus. Particularly worrisome, despite Public Health orders to avoid non-essential travel, lots of people – including politicians and other public figures – took to the skies on recent vacations. For now, folks, it’s probably time to learn to NOT fly. Maybe stay home and watch a video instead?
************* UPDATE January 27, 2021
Still no updated YVR passenger data for December! But lots of discussion about travel restrictions. So I’m posting a comparison of BC CDC flight exposures to overall exposures by month below, running up to January 22 (latest flight exposure notification data). The scales are set to 1 flight exposure = 500 cases reported, though of course I make no claim for direct causality there! The figure merely enables a comparative analysis of trends.
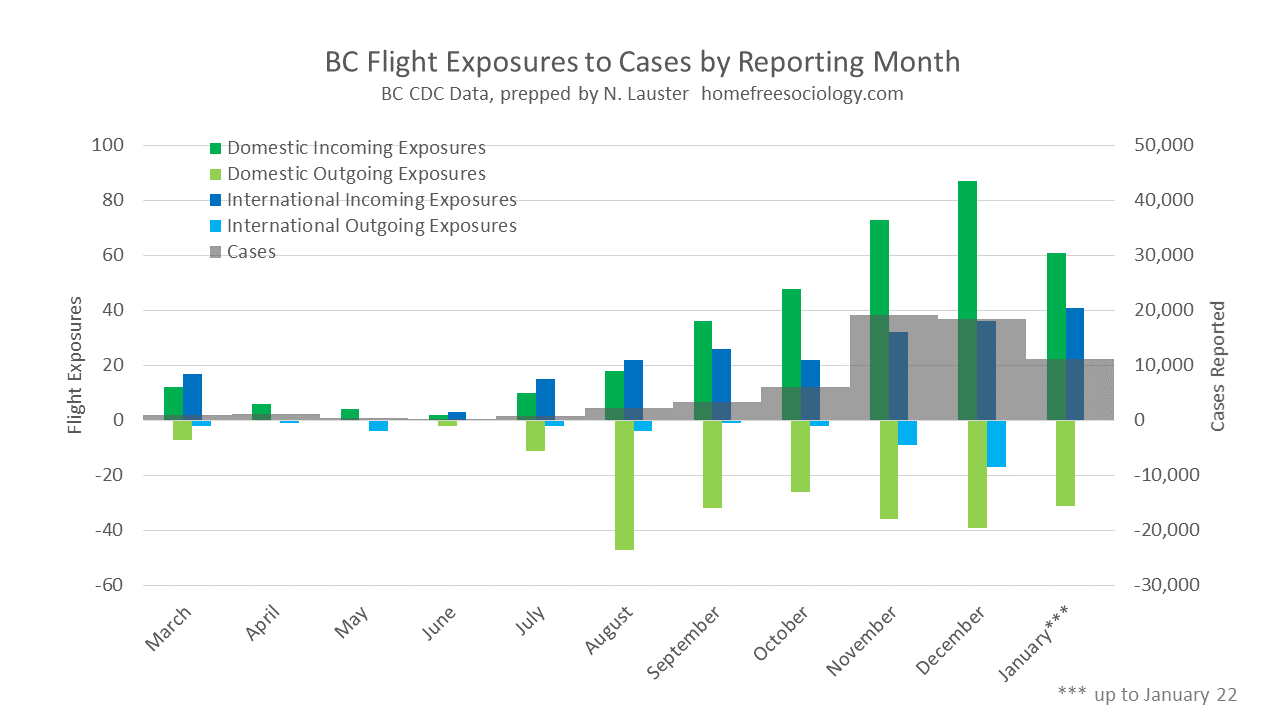
Feel free to grab the spreadsheet behind the figure containing downloaded BC CDC data from Jan 27 here:
