
(Joint with Jens von Bergmann and cross-posted at MountainMath)
TLDR
We estimate the land value lost by lot subdivision restrictions in the RS (single-family) zoned lands of Vancouver. These restrictions, also known as the zoning tax, subsidize hoarding of land for the wealthy at the cost of those who wouldn’t mind sharing. We conservatively estimate the overall cost of preventing splitting of lots at $43 billion, or an average of 37% of existing lot land value. Alternative formulations enabling deeper subdivisions raise our zoning tax estimates to $146 billion. We provide examples of what subdivision could look like, tally up non-conforming lots by zone, and discuss some of the implications.
The zoning tax is real, and it is enormous. The exact amount of the zoning tax is hard to pin down because we are so far away from the equilibrium of where people would stop subdividing land or air parcels if they were allowed to do so.
Lots of Potential
How much land do you have to buy in order to buy a house?
Theoretically this could vary a great deal, running from tiny lots (hosting tiny houses) up to large estates. Historically the latter (often farms) were surveyed; subdivided, and sold off into the smaller lots around most urban areas, setting in place the landscape we see today. Prior to zoning, increments of the 66 foot-long chains of surveyors tended to set lot sizes (one chain by ten chains makes an acre), but these could be further subdivided and sold off by land owners (half a chain by two chains remains a pretty normal lot size in Vancouver). Zoning regulations, and specifically subdivision regulations, imposed firm limits on how small lots were allowed to go, generally setting minimum parcel sizes and frontages. This prevented land from being further subdivided, or split up into smaller lots. It also kept out poorer folks from more exclusive neighbourhoods (in many cases as advertised).
In effect zoning forces some people to buy more land than they might otherwise want, making their housing more expensive, but also making the neighbourhood more exclusive. At the same time, and because you can’t really do much with it, zoning depresses the price of land ($ per square foot) on large indivisible lots relative to smaller lots. In other words, we make it difficult for two less rich households to compete with one very rich household for the same plot of land. Accordingly we subsidize the lifestyles and exclusiveness of landed wealth and we pay for it by reducing opportunities for everyone less wealthy.
Just how much is this subsidy costing us?
Most estimates of the size of the subsidy come from the field of Economics, where it’s understood slightly differently: as a tax. Following Glaeser & Gyourko (2002), it’s often referred to as a zoning tax. Economists (correctly) tend to see this tax as lowering general welfare in cities. But it’s also a tax placed upon potential transactions between prospective buyers who don’t need all the land on offer and current land owners, who would be able to sell their land for more if it were subdividable. A new NBER working paper by Joseph Gyourko and Jacob Krimmel tries to quantify the zoning tax, that is the loss in affordability due to restrictive zoning, in single-family zoned areas across multiple US metros. Below we attempt to quantify the same figure, which we can also understand as a subsidy for the lifestyles of the very rich, for Vancouver.
Why is this called a zoning tax? The basic idea is that as land gets more expensive people tend to use land more intensively. This can happen in several ways, via subdivision of land, subdivision of air parcels (stratification), and sharing of existing land. Zoning restricts all of these. Restrictions on minimum lot size, minimum lot frontage, as well as minimum setbacks renders subdivision of land at some point unfeasible. Restrictions on height, FSR, number of units and stratas restricts subdivision of air parcels or stratification. Definitions of family and restrictions of number of unrelated people per household in zoning bylaws restricts sharing of land and the homes on them.
It’s possible, of course, that these restrictions don’t matter much. If they only operate to replicate what people want and can afford to buy anyway (maybe everyone’s a wealthy gardener!), then they may produce little in the way of a tax or subsidy. Put differently, if these restrictions just curb some rare outliers there is not much aggregate economic and social loss associated with such regulation. But when the regulations become hard constraints limiting the trade-offs most people might be happy to make they can incur enormous economic (and social) losses. The zoning tax (a.k.a. landed wealth subsidy) offers one estimate of the selective losses and gains on offer.
Binding constraints
How can we tell if the zoning restrictions in Vancouver are hard constraints limiting what people would do otherwise? There are a number of ways. The size of new houses in Vancouver RS (“single family”) zoning gives one view into this. Here is a graph of the GFA (gross floor area, the total floor space used for living) and the FSR (the ratio of GFA to lot size) for City of Vancouver single family homes by year built.
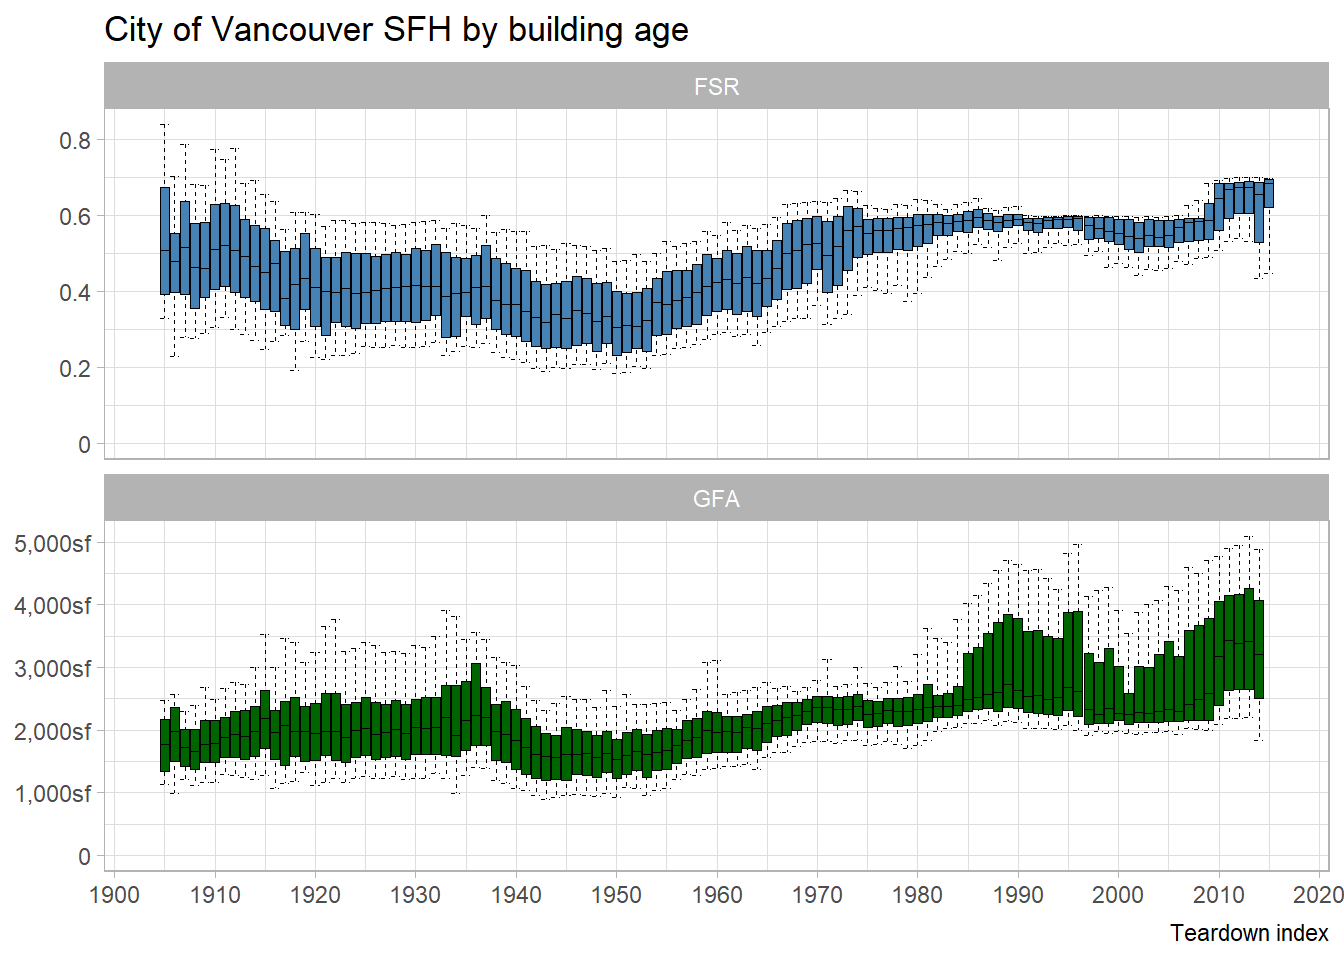
This list is somewhat biased in that it does not show the distributions of GFA and FSR for all homes built in a give year, but only for those that are still standing. This biases the floor area of older homes upwards, as smaller homes are more likely to have been torn down and replaced. GFA measures the size of the house, FSR is what is restricted by zoning regulation. Initially the FSR ceiling was set at 0.6 FSR, but this was fairly recently extended to 0.75 as visible in the data. There were also numerous changes of what does or does not count toward FSR.
Initially the GFA followed a fairly narrow band, we built homes to fit families and needs were similar. This led to a broad span in FSR as lot size varied. We notice how starting in the 1960 the size of homes increased, and by the mid 1970s the range of FSR narrowed considerably, approaching the legal limit. What changed is that the land economics incentivized people to maximize floor space, the FSR range narrowed and the GFA range widened, depending on lot size. The FSR constraints, and with it land sharing constraints, became binding and the zoning became dysfunctional.
Zoning tax
In this post we want to explore the zoning tax as different evidence of a hard constraint, in this case the constraint on sharing land by sub-dividing. Gyourko and Krimmel look at the extensive and intensive margin values of land, which is to say they compare the average land value per square foot of large and small lots near one another. They argue that these two should be the same in an unregulated market. In other words, if the intensive margin is higher than the extensive margin, a landowner could subdivide and sell off some land, or buyers could team up and split the land. But zoning and subdivision bylaws prevent these moves.
There are of course other things aside from zoning that may prevent subdivision. If land is already parcelled and built out like Vancouver one can’t always just sell off a few extra square feet so that someone else can build a house on it. But pretty much any Vancouver lot could easily be subdivided into two or more parcels and built on individually. A quick look at Tokyo shows how zero setback single family homes can be built on very small parcels and result in a varied, refreshingly quirky, and dense urban form. Essentially, this is the “zoning tax” we are after. The difference in land value that would result from allowing lots in Vancouver to subdivide into two (or more) parcels.
How to measure the zoning tax?
To determine the zoning tax we have to estimate land values of parcels of different sizes. And use that to estimate the extensive and intensive margins. We can use this to estimate the zoning tax. We can then take the result and validate it by checking in on some non-conforming lots that pre-date or have otherwise been enabled to elide zoning laws.
To facilitate estimating land values we will take a shortcut by piggy-backing off of BC Assessment land value estimates. That’s quite problematic as we may well just pick up artifacts in the BC Assessment algorithm, so it requires some validation to make sure that we don’t produce nonsense. But if the zoning tax is large, then we should be able to easily detect it using any half-way decent land value estimation mechanism, including the one employed by BC Assessment.
To start off let’s take a look at the subject of our study: RS lots in the City of Vancouver. To clean things up a little we removed parcels that are parks, schools or other non-single family land use. We colour the parcels by their minimum lot size mandated by zoning, lots can’t be subdivided if one of the resulting parts falls below this limit.

Apart from minimum lot area, minimum frontage is another way we limit subdivisions, and often this constraint is stronger than the minimum area. In practice it does not matter that much though; most parcels can’t be subdivided because that would violate both of these zoning constraints.
Next we need to estimate the extensive and intensive margins of land. To do this we take a group of roughly comparable lots with different lot sizes and compare their land values. For our pool of “roughly comparable” lots we will take a string of adjacent lots along one side of a block and remove corner lots (proxied as lots with only one neighbour). To “compare” land values in relation to lot size we regress log land value on log area, so effectively we estimate LV=c⋅Aβ, where LV is the land value, A is the lot area, c is a constant depending on the group of parcels, and β
is the scaling exponent that describes the relationship. The choice of using log land value and log area is informed by general considerations of how people value things, we will have to check in the data how well it fits these model assumptions.

We see (randomly coloured) groups of “comparable” lots, with corner lots (in dark grey) removed. Removing corner lots not only removes issues around small general price differences between corner vs interior lots, it also deals with issues when the corner lot is on a busy arterial and the price difference can be substantial.
This grouping is not perfect, but it is easy to do and does a good enough job for making our comparisons.
Next we take a look at how land values and areas relate in some of our comparison groups. We will select groups that have at least 8 parcels after throwing out corner lots, and ask there to be a variation in lot size of at least a factor of 1.25 within the group so that estimates are more robust and not just picking up noise generated by parcels of almost equal size, leaving us with the following 1,534 clusters across the city.

To understand how the land values relate to lot areas within these groups we take a random sample of 32 such groups and fit our model to each group.

The fits aren’t perfect, but generally pretty good. Some groups have their lot areas cluster at the extreme values, others have them distributed throughout. The slopes of these lines, the exponent β
in our model, are generally quite similar, which is encouraging. This indicates that our model seems to make sense and fits the data reasonably well. The big caveat here is that this may well just be recovering assumptions baked into the BC Assessment model that estimates the land values in the first place, we will have to validate this against actual transaction prices further down in this post.
We fit a random intercept model that estimates a fixed slope and we allow to intercept to vary across comparable groups, acknowledging that land values differ broadly across different regions of the city, as well as between arterial and residential lots, or lots abutting parks. This gives us a slope (or exponent in our original model) of 0.544 with confidence interval [0.5393,0.5479].

The part of the plot that we are most interested in is toward the lower left. The median Vancouver RS lot size is 402m^2, what’s the opportunity cost of preventing this lot from getting subdivided? That’s easy to check. This is asking what value we lose by preventing a lot from getting split into two. It’s most easily expressed as a share of current land value.
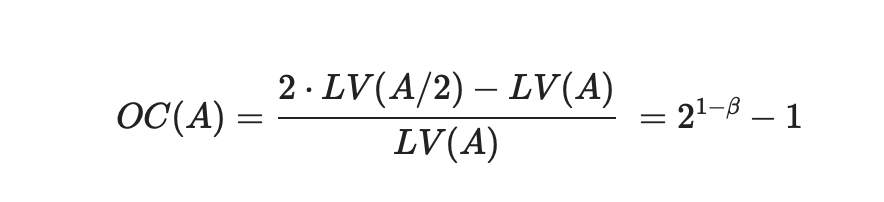
which comes out at 37%. In other words, the zoning tax that’s preventing RS lots from getting subdivided in half stands at 37% of current land value. Aggregated over all residential RS lots in the City of Vancouver the zoning tax comes out at $46bn.

However, some parcels are already below the current minimum area requirements, so maybe we should exclude those from the zoning tax calculation and assume they are already sufficiently subdivided.
Excluding those currently non-conforming lots, but keeping the conditionally conforming, the zoning tax estimate gets reduced to $43bn.
What would subdivision look like?
In Vancouver we have several examples of homes on lots well below the minimum lot size. Examples that show what exactly subdividing a typical Vancouver lot would look like, and what the effects would be.
To start off, let’s look at a group of properties in the north-east of the city close to the PNE on the south side of Dundas Street between Slocan and Kaslo.

The coloured properties are the “comparables” in our cluster, two of the properties are 24 foot wide, half the 48 foot width of all the others. The lots are zoned RS-1(A), so while the 48 foot wide lots are wider than the minimum frontage of 30 foot required by the zoning bylaw, they can’t be subdivided into two 24 foot lots. At 2,928 square feet the narrow lots are also just shy of the 3,000 square foot minimum area limit.
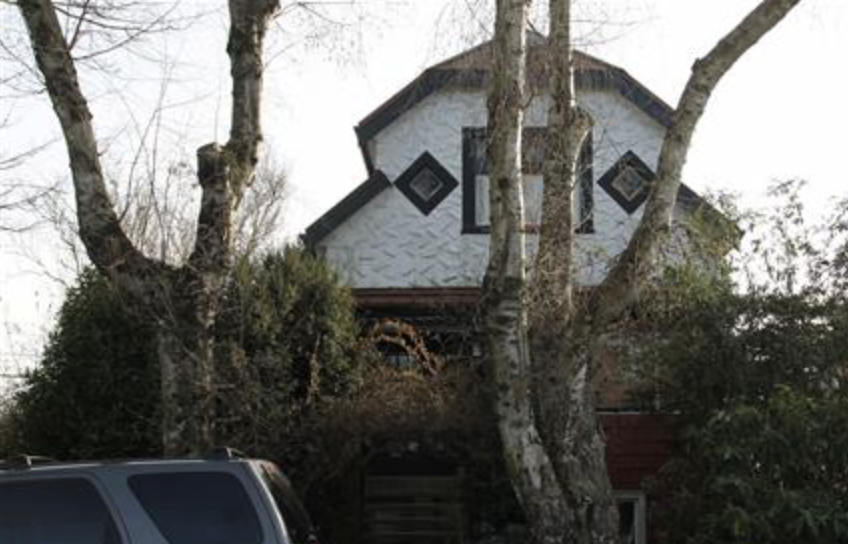
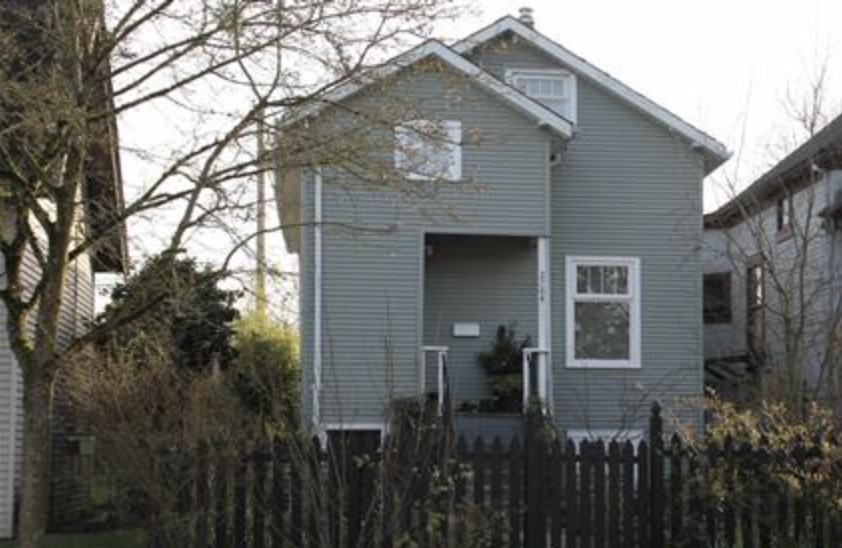
The two properties in red sold recently, the larger one in October 2019 for $1.55M, the smaller one in September 2020 for $1.28M. The assessed land values pegged at July 2020 are $1.45M and $1.01M, respectively, with both having building values estimated around $150k. Eyeballing streetview photos this seems reasonable, although an exact attribution is difficult to make without an in-depth assessment. Which highlights a major shortcoming of our methods, but this should not prevent us from getting the ballpark estimate right.
If we take the land value estimates at face value, the larger lot valued at $1.45M could turn into two lots valued at $1.01M if we allowed it to be subdivided, totalling $2.02M. This amounts to a 39% increase in land value. This is consistent with our overall estimate of a zoning tax share of 37% of existing value for preventing lots from being subdivided.
Another interesting example is (former) 3582 McGill Street which got rezoned from RS-1 category C to RS-1 caregory A in 2012, reducing it’s minimum frontage requirements from 50 to 30 feet and minimum lot size from 5,000 to 3,000 square feet. The original property had a frontage of 66 feet and an area of 7973 square feet, each of which provided a binding constraint preventing subdivision before the rezoning, but both allow for subdivision after rezoning to category A.
The process of reclassifying from one subdivision schedule to another involves staff time for outreach to neighbours, tallying of their positions (for and against), and detailing of relevant policies and precedents. Then it comes before City Council, who make their final decision with a recommendation report from planning staff. Since no neighbours were opposed (only 3 of 25 nearby neighbours asked to comment responded at all), the McGill reclassification was successful. This allowed the original property to get subdivided into two separate ones of roughly equal size, 3586 and 3592 McGill Street. We can watch this redevelopment in the building values for the site with PID 015-717-577 getting split into properties 028-985-630 and 028-985-648.

We notice how the assessed values of each subdivision is initially lower than the original combined land value, but the sum of the assessed values of the subdivided lots is larger than the original one. This is what we would expect, if there wasn’t a value gain by splitting the lots, the developer would not have split them. Here we should remember that we are not actually observing land values directly, but using BC Assessment estimates.
Non-conforming lots
Just how many lots in Vancouver are already non-conforming? That’s a tricky question, especially when it comes to frontage, as the city dataset on that is messy and it’s somewhat ambiguous how to count frontage for corner lots. To make it even trickier, Vancouver has two kinds of conforming. There is outright conforming with subdivision classification in zoning. There there is conditional conforming, dependent upon the approval of the director of planning (or appointed officer) on a case-by-case basis. As it turns out, four combinations of zoning district and subdivision category have area and frontage limits that can be lowered somewhat, conditional on approval from the planning department.
Overall we estimate there are 4,062 lots, or 6% of all lots that don’t conform to either area (816) or frontage (2,695) or both (551) requirements, even granting each lot conditional approval of lowered limits if applicable.
Additionally, there are 1,405 properties that don’t conform with the outright requirements but satisfy the conditional ones. We can break this down by zoning and subdivision category.

Things are particularly awkward in RS-7, RS-1A and RS-2, where the outright minimum frontage requirements are 40 foot and the minimum area requirement is 4,800 square feet, but the director of planning may conditionally lower them down to 30 foot frontage and 3,000 square feet. The result is that the majority of properties in each of these zones only complies with the conditional requirements, begging the question why the City of Vancouver insists on this kind of case-by-case zoning in these areas.
Non-conforming lots can be found all over the City of Vancouver, but conditionally-conforming lots cluster in the four zoning and subdivision areas that have conditional subdivision zoning.

Repeated subdivisions
So far we have looked at allowing each lot to subdivide once, but we could go further and ask what would happen if we allowed our standard 33 foot by 122 foot lot to be split into four 16 by 60 foot lots, halving the frontage and upgrading the alleyways to allow independent homes. This would require us to rethink how we deal with some aspects of how we organize services like power cables, sewer lines, size of our fire trucks and garbage pickup. But these are hardly insurmountable challenges and many parts of the world have figured out how to deal with them. To deal with edge cases in this scenario we will set the minimum frontage at 15′ and the minimum depth at 55′, or a minimum lot size of 825 square feet.
Comparing our current zoning to one that allows for this “quadruple subdivision” on standard lots yields a zoning tax of $146bn, substantially more than our initial estimate. Despite this massive overall lift in land values, individual lots are estimated to be priced between $519k and $1.26M at the 5th and 95th percentile.

This kind of subdivision has the potential, if fully realized, to have a sizable number of lots around $500k, while currently the entry price for a buildable lot in the City of Vancouver sits around $1M.

Broad and Narrow Rezoning
Our zoning tax estimates are based on comparing the land value of relatively scarce small lots (generally not allowed) with larger lots (generally mandated). If restrictions on subdivision were lifted, these two prices would move toward one another (per square foot) as small lots became more common and larger lots more scarce, eventually erasing the differential. As such, estimates of the zoning tax would eventually move toward zero if constraints on subdivision were lifted all across the City. On the other hand, if constraints were selectively lifted in one place, then another (as occurs with spot zoning), we’d expect to see price differentials remain.
Put slightly differently, the zoning tax estimates are based on the current situation and are based on the premise of making small changes. Yet lifting restrictions on subdivisions across the city is everything but a small change. It has the potential to dramatically alter the availability of small lots, which in turn could lower prices for small lots and change the zoning tax calculus. The effect on the prices of larger lots is more complex, but this would lower the overall zoning tax estimate. At the same time it would increase affordability making the lifting of restrictions a win-win situation, with a trade-off between the total zoning tax unlocked and affordability.
In practice, subdivision would be a gradual process even if allowed all across the city. Depending on the value of the structure on a given lot, subdivision will not be economically feasible as it generally requires demolition (or equally expensive, relocation) of the existing structure. And while Vancouver has a lot of single family structures that are at the end of their economic life span, turnover is usually conditional on a property transaction. In summary, one would expect the transition to smaller lots to be gradual, even if the ability to subdivide is likely to accelerate trends in sales and redevelopment.
Subdivision versus Stratification
Subdivision of parcels is not the only way to unlock the zoning tax. Subdivision of air parcels, a.k.a. stratification (condos), is an alternative to subdivision of land that is similarly suited to unlock the zoning tax. We did not explicitly model air parcel subdivision mostly to keep things simple, but one should expect similar effects. On top of this, stratification makes it easier to subdivide even further, when lot sizes become so small that fee-simple structures become less feasible. One could even go further and consider assemblies in order to achieve buildings with more efficient (and accessible) layouts.
In practice we might want to allow all of these, subdivision of land as well as subdivision of air space of single lots as well as assemblies. Tokyo shows how larger buildings can nicely co-exist with zero-setback single detached homes and result in a delightfully varied streetscape.
At the same time, we likely want to change our rules on setbacks and FSR. The examples of 16 foot wide lots that we have show that current rules can still result in viable homes on half-sized regular lots, but at the latest when we subdivide further to also allow front/back subdivisions on top of that we need to increase FSR and make dramatic changes to front and back yard in order to achieve functional homes. The same is true if we allow stratified 4-plexes on regular lots with all family-sized units. If this happens, land values may increase further, rendering our zoning tax figure of $146bn an under-estimate.
Upshot
The exact amount of the zoning tax is hard to pin down because we are so far away from the equilibrium of where people would stop subdividing land or air parcels if they were allowed to do so. But it is clear that the zoning tax is real, and it is enormous. At the lot level the zoning tax materializes as a subsidy for hoarding of land paid for by lost opportunities for those willing to share land via smaller lots or stratification. Collectively the zoning tax quantifies (a portion of) the problems with City of Vancouver land use policies, pushing up housing prices and forcing people into long commutes.
As usual, the code for this post is available on GitHub for anyone to reproduce or adapt for their own purposes.

One thought on “Lots of Opportunity: Estimating the Zoning Tax in Vancouver”