
Sometimes we talk about cities as if they’re settlements, where people become fixed to place. But in fact, if you track movements of people, cities look more like rivers. People churn through the urban landscape. Net migration numbers are really useful in some contexts, but also obscure the full extent of this churning. Fortunately, BC Stats has numbers that attempt to break down actual flows of people through regions. We can break out Metro Vancouver (a.k.a. Greater Vancouver) and see just how many people we think might be flowing through. Here’s a little graphic I made to highlight this churn, while I continue playing around with the best way to present it.

The numbers and categories for inflows and outflows are straight from the BC Stats regional district migration file for Greater Vancouver (which itself is derived from a more detailed version of Stats Can table 17-10-0140-01 on components of population change). Population, birth, and death figures similar come from BC Stats and StatCan files. I’ve rounded them off and expressed them in millions here both for ease of reading and in recognition of some of the underlying uncertainty in accounting for population shifts.
BC Stats figures divide up international flows into immigration, emigration, returning emigrants, net temporary emigrants, and net non-permanent residents. The many categories reflect both legal statuses and movements of people, which is part of why there are so many and starts to get at some of the complexities of international migration regimes. Then we get interprovincial in and out migration (to Metro Van from other provinces) and intraprovincial in and out migration (to Metro Van from elsewhere in BC). I find it super-cool to see all the flows laid out.
The basic takeaway for me is that over the course of thirteen years, from 2006 to 2019, we see enormous churn through Metro Vancouver. From a base population of 2.2 million, an additional 1.1 million arrivals came to the region. A smaller 0.7 million left. Wow! That’s a lot of turnover! The total 1.8 million moves into and out of the region over the thirteen year period nearly approaches the starting size of Metro Vancouver as a whole, and represents a much bigger number than the net migration of 0.4 million. Adding in 0.3 million births and subtracting 0.2 million deaths, and there’s your growth of roughly half a million people in Metro Vancouver through 2019.
What’s even more striking is that the moves into and out of the region are dwarfed by the moves within the region. That’s because, as I’ve previously discussed, local moves are a lot more common than regional ones.

Heck, most moves are within municipal boundaries, and well within metropolitan ones (see previous post for more discussion of this figure).
So the churn we see in metropolitan flows is only a small part of residential churn overall. People move! When we think of cities, we need to recognize this movement as fundamental to how they work. Our “settlements” really aren’t very settled at all.
UPDATE June 10th
For comparison’s sake, let’s update the figure above by adding an estimate of internal moves. These are moves from one location to another within the metro area of Vancouver, and as such they don’t add or subtract from the metro population as a whole. Instead they just highlight the centrality of mobility to urban life.
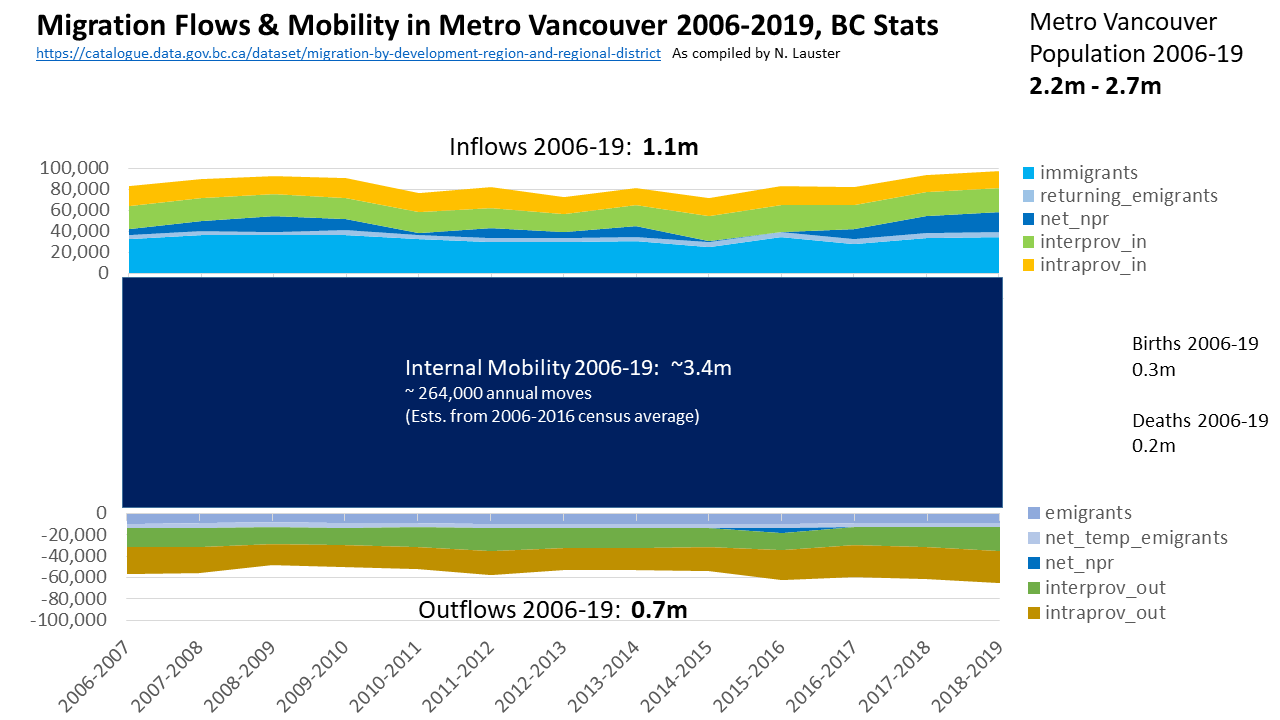
We don’t have a straightforward estimate of these moves from StatCan data. So here I draw upon Census microdata from CHASS. I hold the internal moves constant by averaging the estimates of how many people recorded a move within the Vancouver CMA across three census years (2006, 2011, and 2016). The estimates vary a bit between years, dipping from 260,590 moves in 2006 to 251,635 in 2011, before rising again to 278,632 in 2016, but I don’t have data for every year and I like the graphic impact of treating it as a constant for comparison with in- and out- flows.
Takeaway: when you add in local moves, the city looks even more like a river. In fact, the total number of moves between 2006 and 2019 adds up to roughly 5.2 million. The population in motion more than doubles the population of the “settlement” at the start (2.2 million) and nearly doubles it at the end (2.7 million) of the period in question. You say settlement, I say river.

3 thoughts on “Metro Flows”