Context for COVID-19 Mortality so far

co-authored with Jens von Bergmann & cross-posted over at MountainMath

Unfortunately, more and more people are dying due to COVID-19. We won’t know the full toll from COVID-19 for quite some time. But we can at least start to get a sense of its impact. One useful way of assessing the impact, of course, is just to plot deaths attributed to COVID-19. This highlights the real loss of human lives associated with outbreaks. But as any demographer can tell you, deaths are a normal part of life. Within a given population, we can reliably expect a certain number of deaths to occur over any given time period. So another way of visualizing COVID-19 deaths is also useful: How many deaths attribute to COVID-19 are occurring as compared to the deaths we would normally expect to occur? Continue reading

BC Renters by Household Type & Need

Yesterday BC unrolled a quick support package for tenants and landlords affected by COVID-19 related job and income losses. In addition to an effective moratorium on evictions (yay!) and a rent freeze for the duration of the crisis, the province offered $500 going directly to landlords to offset rents for those with lost income. The measure appears to be aimed at preserving landlord incomes and landlord-tenant relationships even as the eviction moratorium temporarily boosts the bargaining power of tenants. Lots of details remain to be determined, including, apparently, whether the benefit applies per tenant or per unit. Continue reading

Overnight Visitors and Crude Travel Vectors

co-authored with Jens von Bergmann & cross-posted over at MountainMath

The spread of Coronavirus is reminding us of just how often people travel around, especially as various locations become quarantined and international travel corridors get shut down. So let’s take a look at some basic data on travel patterns here of relevance to us here in Vancouver. Then we’ll put them back in the context of Coronavirus.

TLDR: travel data is really interesting, don’t be frightened of travelers, and there’s still a lot we don’t know about coronavirus. Continue reading

Wealth vs. Income

co-authored with Jens von Bergmann & cross-posted over at MountainMath

Wealth and income are different things. Wealth is measured in terms of assets minus debts at any given point in time. It can accumulate or deplete over a lifetime and across generations. By contrast, income represents some variation of how much money one makes over a given time period (usually a year). Most people get this on some level. But since both income and wealth deal with people and their money, the terms are also often used interchangeably. So it was that the CBC yesterday reported that “B.C. budget 2020 promises new tax on wealthy to help ensure future surpluses” despite the actual new tax being a tax on high-income individuals. Continue reading

Keep On Moving

co-authored with Jens von Bergmann & cross-posted over at MountainMath.

More results from the new Canadian Housing Survey dropped earlier this week! And they provide new insights into why Canadians move.

Last time we only got provincial results. Now we can break down reasons for the last move by metro area and current tenure, but this time around we looking at the last move no matter when it happened, as opposed to only considering moves in the past five years as in the previous data release. So the stats aren’t directly comparable to the numbers from the previous release. But as we’ll show, the trends are pretty similar. Continue reading

Who Lives in New Housing?

We see lots of new housing going up in high demand places like Metro Vancouver. But are people moving in to that new housing? Well… yes.

We know it can take a while for new housing to fill up (try watching the lights start to come on in a new tower at night). But we also know housing doesn’t tend to stay empty for long. How do we know this? Well, we can check into empty dwellings via census comparisons, we can draw upon electricity use data, we can look to new empty homes tax data, or we can look to even newer speculation and vacancy tax data. The story is pretty consistent. Very few dwellings remain empty, and even fewer (generally around one percent) without a decent explanation providing an exemption from our vacancy taxes.

So who lives in our new dwellings?

Generally the census provides our best information on residents. Unfortunately, we don’t yet have public-use micro census data from 2016 that includes the year in which buildings were constructed. But we DO have this data from the National Household Survey of 2011 (replacing the long-form census that year). So for 2011 we can separate out buildings constructed in the last five years (from 2006-2011). We can also break this down by major types of new housing built. Unfortunately this means setting aside most purpose-built rental apartments. When it comes to low-rise and high-rise apartment buildings, all we’ve got reliable data on are condos. But we can also look at the many single-family detached buildings constructed during this time period, as well as suited houses and rowhouses (both condo and non-condo).*

First let’s ask: Where did the people moving into newly constructed dwellings live before they were built?

NewHousing1

Nifty. Most of the people moving into new housing between 2006 and 2011 already lived in Metro Vancouver before their move, either in the same municipality or a different municipality within the region (colored green here). So new housing is mostly serving locals first and foremost. No surprise given that most moves are local moves. A much smaller proportion of people moved from outside of Metro Vancouver, some from elsewhere in BC, some from another province, and some from outside of Canada (in blues and purple). Yay for Gateway Vancouver!**

So what would’ve happened if this new housing hadn’t been built? Where would these people have lived instead? Maybe they would have lived in the old housing that the new housing replaced, especially in the case of single-detached houses, where new often simply replaces old, just at a higher price and quality. But often new housing is built more densely, enabling more people to share the same parcel of land, as with condominium apartments and rowhouses. Without this new housing, would the people who moved in have left Metro Vancouver entirely? That’s unlikely. Instead, they would have competed with everyone else trying to move into older housing. And because those moving into newer housing tend to have higher incomes than those moving into older housing, families further down the income ladder likely would’ve been pushed out. We can demonstrate differences in market position by comparing adjusted after-tax family income decile distributions. That’s a long way of saying, how do “economic” families rank in incomes compared to other families (here including non-family households), in particular, how do those moving into new housing compare to those moving into older housing?


NewHousing2a

As suspected, those moving into newer dwellings tend to be of higher income ranks than those moving into older dwellings, just as those moving into condos tend to be of higher income ranks than those moving into non-condo apartments and rowhouses. Without new dwellings, these movers don’t go away. Instead they join the competition for older housing stock, where they tend to push out those further down the income ladder who might be attempting to move at the same time. In some cases, they may directly displace families who didn’t plan on becoming movers, as when buyers claim tenanted condos and secondary suites for their own use.***

Finally, let’s visualize who might be living in new housing a bit more by giving them some ages.

NewHousing3

Are there children involved? You bet there are. Add any of the kinds of dwelling tracked here, and you’ll also be providing homes for kids (in green). That said, condo apartments, both low-rise and high-rise, tend to house more young adults (in blue) and retirees (in yellow). All kinds of households need places to live, including the lower-income households likely displaced when we stop adding new housing. So when you see someone make a claim like:

There is no point to housing construction in Metro Vancouver. It’s almost all unaffordable & it’s being sold overseas where the market price gets set…

Remember that the data we have suggests this is wrong on basically every count. The details of what new housing replaces matter, as does whether the new housing includes condos, purpose-built rental, or non-market social housing. But when we build housing in a place like Vancouver, it gets lived in. In general construction of new and denser forms of housing does double duty, giving real people real places to live and protecting lower-income folks from getting displaced.


*- I dropped new building types where I had less than 10,000 estimated dwellers for data quality issues.

**- Some people show up as non-movers, meaning they probably moved into their new dwelling in the window in 2006, just after it was built, but before triggering a move recorded in the last five years from the date of the census. Or they just misreported, which also happens!

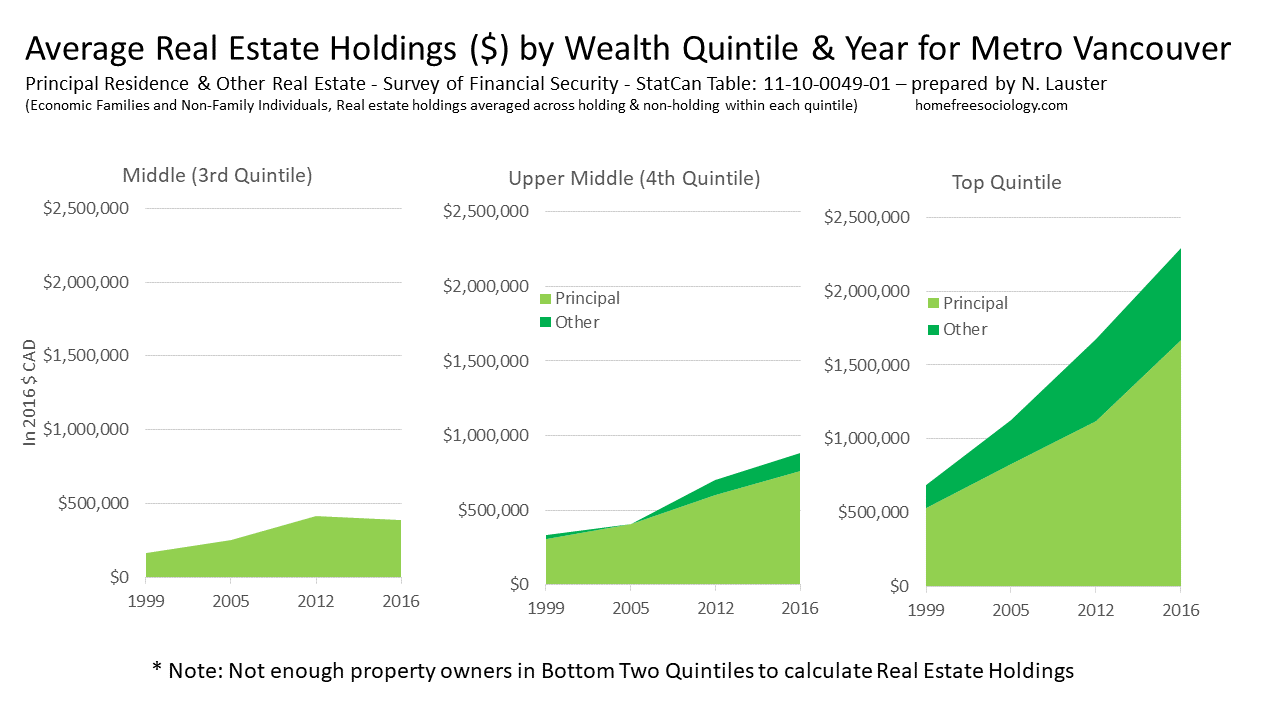
***- Always important to remember both that income and wealth are related, but different measures of market position, and that there is a lot of wealth collected here in Vancouver!

Property Tax Snacks

co-authored with Jens von Bergmann & cross-posted over at MountainMath.


Residential Property Taxes have been rising in Vancouver. As always, we’re seeing a lot of sturm and drang about the rise. But we think it’s ultimately a good thing. Why? Here’s three perspectives. From a fiscal perspective, property taxes pool our resources to enable our government to pursue projects and provide for the common good. They’re a big component of how we take care of each other and set priorities. From a social equity perspective, property taxes are directed at wealth, which is highly unequal in its distribution. Property taxes are also – at least around here – mostly a tax on land value, the rise in which is socially produced and largely unearned by any landowner. We should definitely be looking to redirect the massive gains in real estate wealth in this province toward the common good (Henry George for the win!) Finally, from a financial perspective, higher property taxes increase the carrying cost of treating housing like any other investment. They also work to stabilize the market to the extent they counterbalance the weight of shifts in interest rates. In this sense, property taxes and prices are endogenous.

Also worth noting: Vancouver’s property taxes are very, very low. Measured as the “mill rate” – or the rate of taxes owing per $1,000 in property value – the City of Vancouver’s rate is far below most other municipalities in BC (and further afield), especially outside the Lower Mainland.

prop-tax-1

Within municipalities, property taxes hit real estate wealth, but they’re basically “flat taxes”, set at the same proportion to property values regardless of underlying disparities. What’s more, looking across municipalities, there’s a perverse regressivity to property taxes. The wealthy people (e.g. living in Vancouver or West Vancouver) pay lower tax rates on their properties than those generally less well-off (e.g. living in Nanaimo, Port Alberni, or Prince Rupert). Measures like the School Tax, progressively applied to properties over $3 million, only partially counteracts this underlying regressivity at the Provincial scale. Still, we should be looking at more ways to bend property taxes in a progressive direction, and perhaps even use them to provide relief for income taxes. In short, we can definitely make property taxes a better tool for promoting a more fair BC.

The comparison between places like Vancouver and places like Prince Rupert also helps demonstrate the endogeneity of property taxes and prices. Someone owning a $1M property in both municipalities pays different tax rates. The present value of that tax break the property in Vancouver gets above the property in Prince Rupert, assuming the spread stays constant, is $229k. That serves to inflate property values in Vancouver. Which in turn serves to depress the mill rate in Vancouver. Rinse and repeat.

Let’s briefly touch on property taxes in terms of fairness between the City’s renters and property owners. The city has been working on making itself more fair to renters, who make up the majority of its population but find their options for remaining in the city increasingly constrained. Here we want to provide a simple comparison of property owners to renters in terms of rising costs they face. What’s risen faster, rents or taxes? We also don’t want to forget about rising asset prices too! After all, most property owners have reaped enormous gains in wealth that haven’t been available to renters. Here we’ll set aside other benefits available only to owners (including homeowner grants reducing property taxes, the complete absence of capital gains taxation on sales of principal residence, and even the lack of taxation on the imputed rents home owners pay to themselves) and just look at the rise in property taxes paid and gains in property values relative to median rents over the last few years. What’s that look like?

vancouver_price_tax

Here we’ve drawn upon a representative sample of detached properties and apartment condos and used their actual property taxes paid for the property tax data, and used repeat-sales HPI for single family and apartment condo within the boundaries of the City of Vancouver. The rise in property taxes paid by owners of detached properties slightly exceeds, but otherwise more or less matches the rise in median rents over recent years. The property taxes paid by apartment condo owners has had a more complicated journey, ultimately remaining below the rise in median rents (and remember, many of those condos are being rented out!) Overall, property taxes and rents have pretty much kept pace with one another. Property values, on the other hand, are through the roof! Up until very recently, we saw especially strong rise in the value of detached houses. Rapid price appreciation in the detached market (2010-2016) pushed property tax growth higher for detached houses than for condos, who are only recently catching up. The expansion in municipal budgets has driven recent property tax growth, but it remains in line with the increase in rents being paid by representative residents of the City.

Given our low vacancy rates, there is little doubt that rents would’ve risen much quicker without provincial rent control. But regardless, rents have still kept pace with rising property taxes. We still have lots of room to raise our property taxes on all of the grounds mentioned above. We could also use more progressivity in our property tax rates, working to counteract their regressive tendencies. Unlike for renters and rising rents, the research indicates that property tax increases seldom result in displacement of home owners. That said, if property owners feel their budgets squeezed too tight, the province also provides a wealth of opportunities for deferring payments. That’s yet another benefit that’s just not available to renters. But if the province wants to start supporting tenants who need a break to catch up on their rent payments, it might help put a big dent in the sky-high proportion of BC’s residents who feel forced to move.


As usual, the code for this post is available on GitHub for anyone to reproduce or adapt for their own purposes.

Fun with Real Estate Wealth

Let’s take a moment to talk about real estate wealth! It might be a handy cure to perennial bellyaching about property taxes.

I’m going to pull from the public tables of Statistics Canada’s Survey of Financial Security, a great source of data on wealth in Canada. The data, asking Canadians for detailed information about their collected assets and debts, run from 1999 to 2016 (with the newest data being collected now!) And guess what? They’ve got real estate data in there! So cool. We’ve used this data before to help question the popular narrative in Vancouver that “foreign investment” in Vancouver real estate should be our primary concern (we’ve got a whole lot more domestic investors… why give them a pass?)

Here let’s just look at data on real estate wealth by overall wealth quintile (From StatCan Table 11-10-0049-01) . That means we’ll divide economic families (and those outside of such families) into five groups ordered by their total net wealth. What’s the average real estate holdings in each total wealth quintile, both in terms of their principal residence and any other real estate they might own? First let’s look at Canada as a whole, then specifically at Metro Vancouver.

Real-Estate-Wealth-Canada-Qs

Real-Estate-Wealth-YVR-Qs

Here I’m taking average real estate holdings for each quintile by multiplying the proportion of those who own the asset by the average asset value of those with the asset. You’ll notice I’ve dropped the lowest two quintiles, either because there’s not enough property holders in these quintiles to provide reliable estimates (for Metro Vancouver), or the estimates are consistently below $10k (lowest Quintile) or $100k (2nd Quintile) in all years (for Canada as a whole).

What do we see? In Vancouver, no surprise, we see very heavy real estate wealth. The upper middle (4th Quintile) here looks a lot like the top quintile in the rest of Canada. The top quintile here is loaded with wealth both from their principal residence and from other real estate holdings beyond. Effectively the property tax here is a flat tax on wealth. Hooray! We’re doing a wealth tax! And while it’s mostly flat, we actually do get a bit of progressivity in this tax, both through the provincial School Tax kicking in over $3 million and the Home Owners Grant providing relief toward the lower end.

Raising property taxes on our extraordinary unearned and unequal real estate wealth: what’s not to like?