Visualizing Succession

After my talk at the Vancouver Historical Society, I’ve been playing around with some of the old fire insurance maps for Vancouver. As it turns out, fire insurance maps are super-awesome resources for historical research. Here I want to explore ways of using them to visualize succession as an urban process.

Succession, meaning the gradual outward expansion of an urban core, was thought by many observers of the early 20th Century to be the key process driving neighbourhood change. For sociologists like Ernest Burgess and Roderick McKenzie, succession was a process of “invasion” from the centre outward through a series of concentrically organized ecological habitats. The central business district (Habitat I) was always attempting to move into the surrounding industrial and commercial areas (Habitat II), which in turn were always invading the areas of dense working class housing beyond (Habitat III), which were always trying to muscle in on the middle class and wealthy residential suburbs on the outskirts of the city (Habitat IV).*

“Succession” was a science-y and neutral sounding concept (having been drawn directly from plant ecology), while “invasion” was quite threatening, especially to the middle class and wealthy suburban neighbourhoods hoping to hold the urban core at bay (very much including its working class & minorities). With the invention, legalization and rapid spread of single-family detached zoning, the middle class managed to mostly surround and contain the urban core, as I describe in my recent talk and book. As a direct implication of halting the process of urban succession, constrained urban cores mostly grow up instead of out, and now we mostly talk about gentrification instead of succession as a key process affecting our cities.

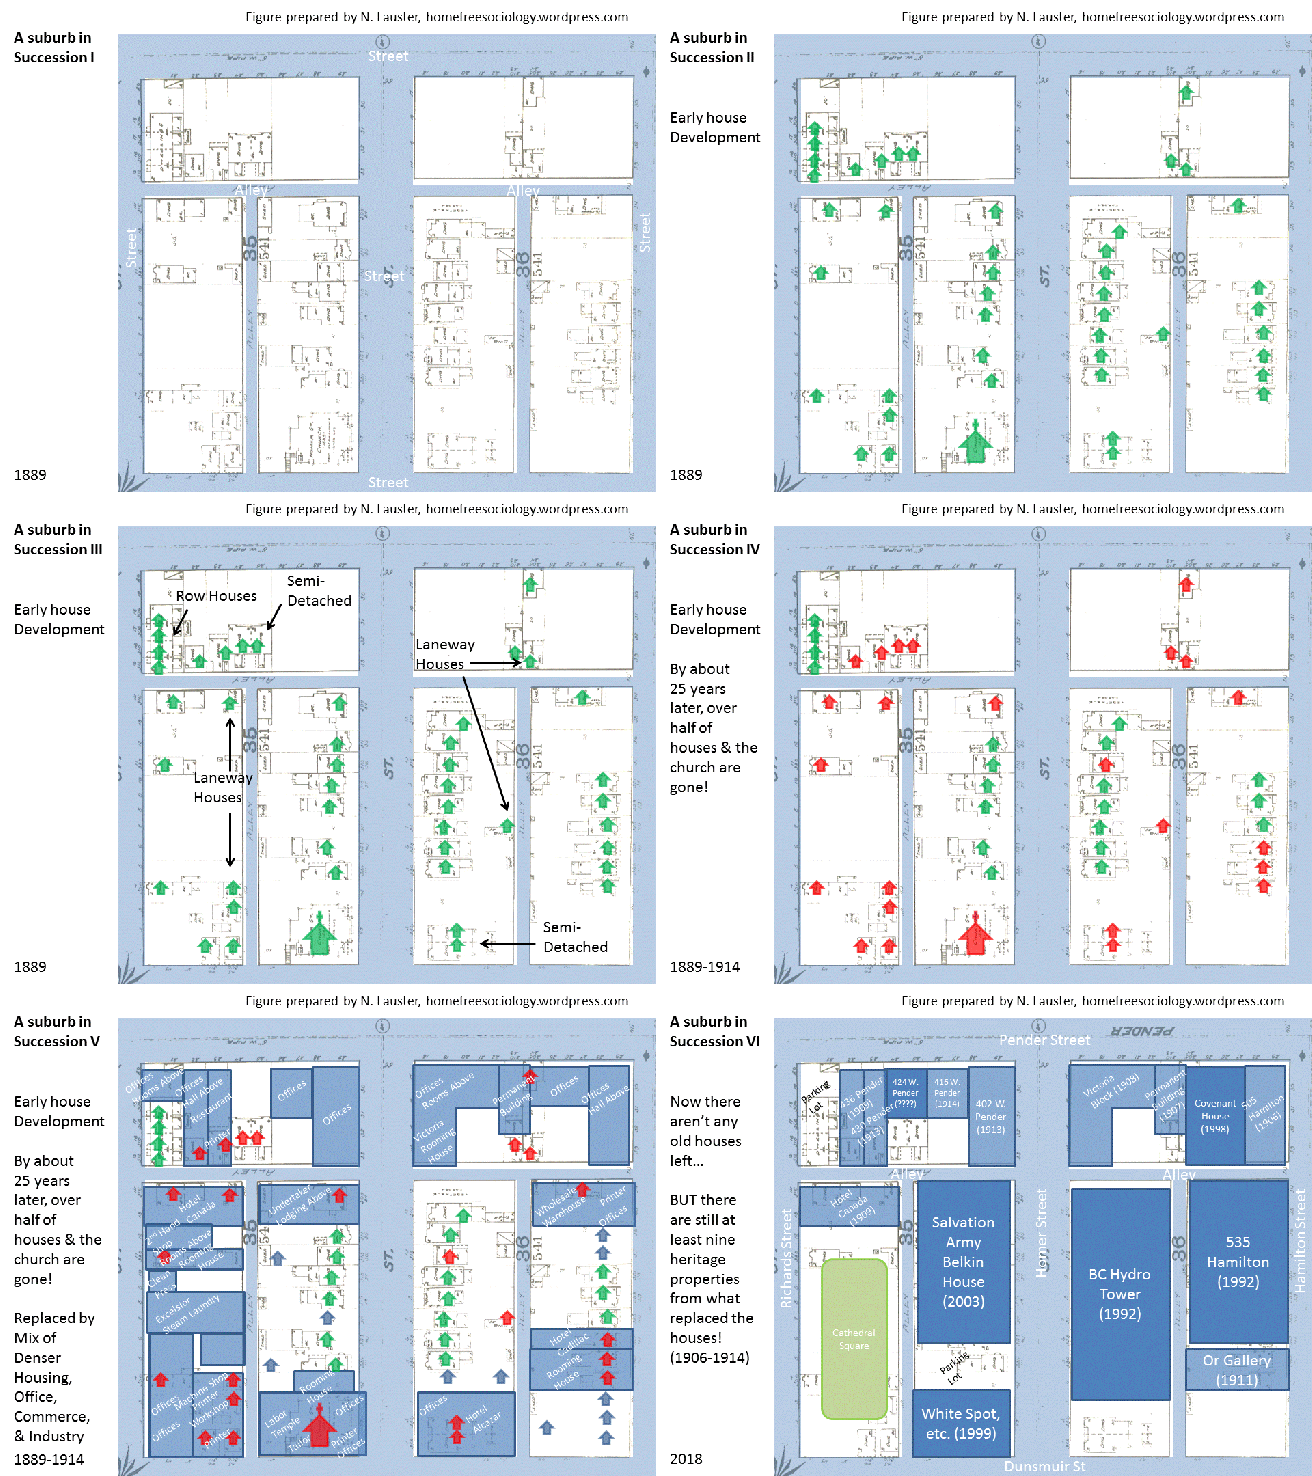
But let’s go back to succession. Can we see it in action? Let’s start with an early residential development consisting of two blocks (subdivided by alleyways into six) on the outskirts of a rapidly growing city in the late 19th century.
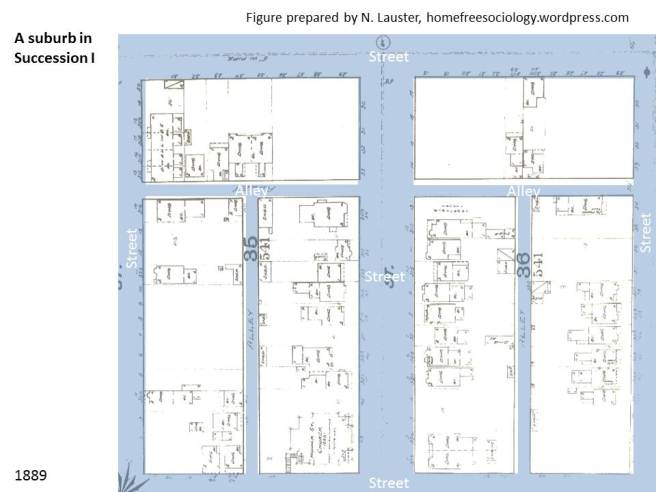
ASuburbSuccessionI

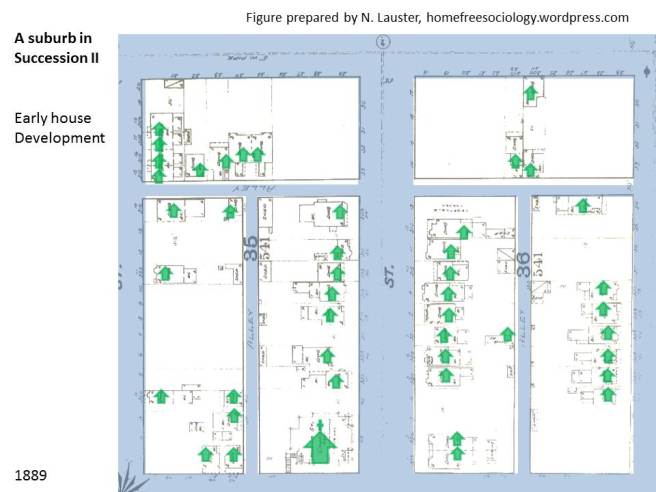
The base layer here is an old fire insurance map from the Vancouver archives, though I’ve faded it out a bit to draw over top of it. Let’s highlight all of the houses.
ASuburbSuccessionII


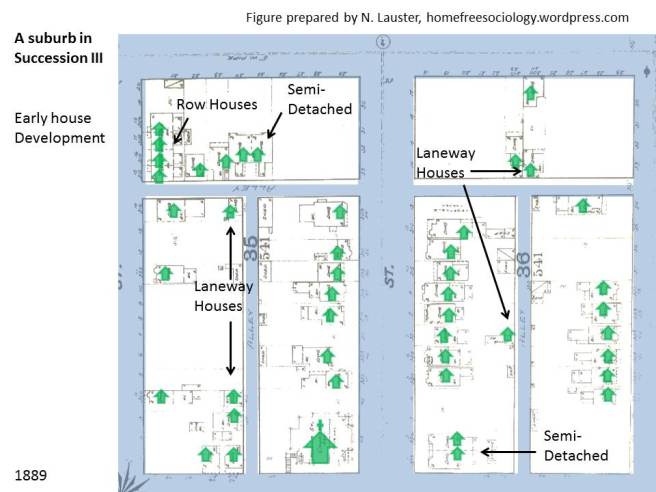
We can see this is pretty much just a residential neighbourhood at this point, with the only non-residential use a church (lower-left). Most of the other buildings are sheds. But wait a minute, are these all single-family detached houses?
ASuburbSuccessionIII


Trick question! Those weren’t invented yet! So nobody was recording whether or not single families lived in these houses, nor how they might have been subdivided. That said, it’s clear that four houses in the upper-left block were all connected to each other, making them recognizable as rowhouses. Meanwhile, there were at least two houses connected side-by-side on other lots, making them semi-detached houses (by modern Canadian census categories). Also notable: at least four lots had both houses fronting onto major streets and houses fronting onto alleyways – with the latter now identified as “laneway houses” in Vancouver. Lots of “missing middle” housing!

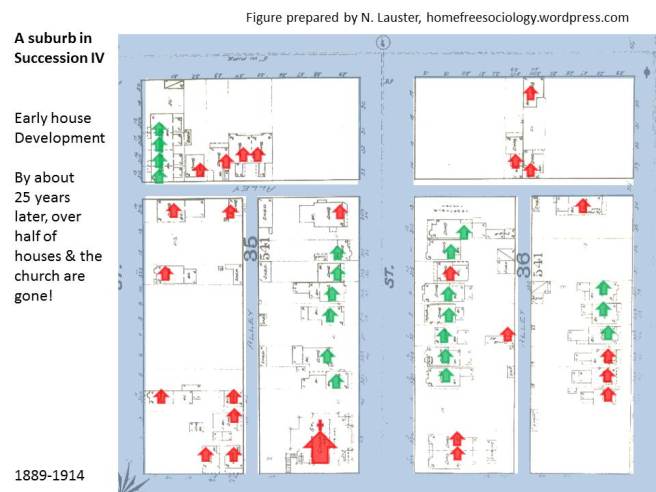
Importantly, these residential blocks were located on the outskirts of a growing urban core in 1889. What will become of them? Let’s jump ahead 25 years and see…
ASuburbSuccessionIV


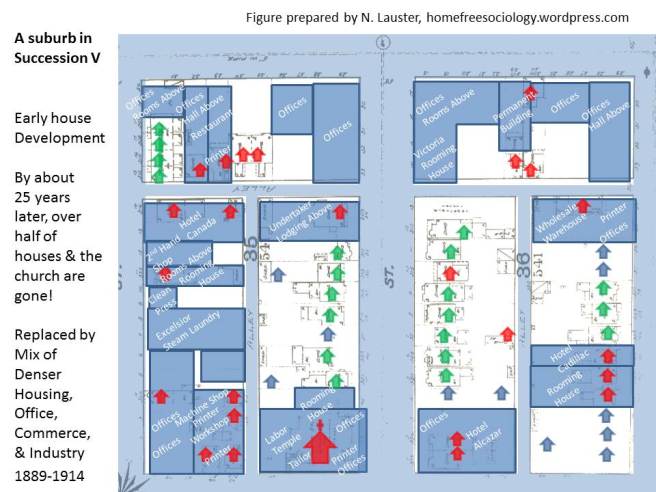
I’ve highlighted in red all of the buildings that disappear over the course of 25 years. Oh no! There goes our church! Over half of the houses are also gone. Devastation in Habitat IV! But at least the townhouses remain. Let’s fill in the neighbourhood…
ASuburbSuccessionV


Some of those old houses remain, and new ones have been added too, meaning that we don’t see a complete replacement of seemingly middle-class residential uses (Habitat IV). That said, for the most part torn-down houses have been replaced by much larger buildings that take up their lots and add abundant industrial, commercial, and office uses to the neighbourhood. At least three hotels (Alcazar, Cadillac, and Canada) join numerous rooming houses, with the latter being an especially important source of housing for the working class and poor (Habitat III). Industrial uses (machine shop, workshop, numerous printers, warehouse) also crowd the block, along with commercial uses and services (second-hand shop, steam laundry, tailor, restaurant). There’s even an undertaker with lodging above! Lots of what Burgess termed a zone in transition (Habitat II). And offices… so many offices. We can make a strong claim for central business district uses (Habitat I). In effect, the entire urban core has moved into a former middle-class residential district over the course of 25 years, give or take, without completely destroying it. On a first pass, pre-zoning urban succession looks more like urban mixing than invasion and replacement. But maybe we just didn’t give it enough time.

What does this marvelous neighbourhood look like now, some 100+ years later?**
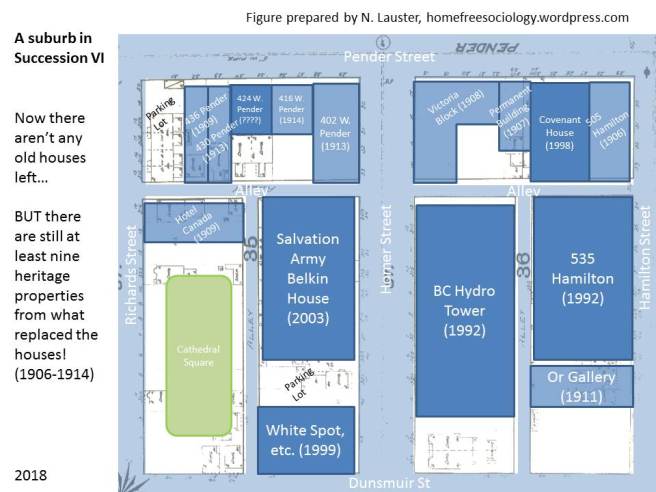
ASuburbSuccessionVI


It looks like the two blocks bounded by Pender, Hamilton, Dunsmuir & Richards, right smack in downtown Vancouver. The 19-story BC Hydro Centre Tower dominates these blocks. But remarkably, at least nine of the old buildings that replaced the original houses in the neighbourhood during the 1906-1914 era remain intact! Alas, the townhouses in the upper-left have been replaced by a parking lot. Overall, the neighbourhood still has a mix of low-income housing, commercial and service space, and office space, though probably not a lot in the way of middle class housing (have to seek out some condos nearby for that).

I grabbed the dates on all the buildings I could find from VanMap‘s Assessment data. Old Fire Insurance Maps can be found in the Vancouver Archives.

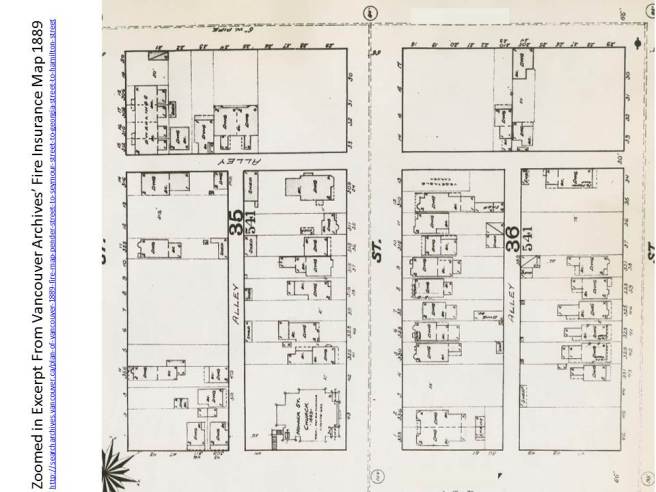
Here’s the Fire Insurance Map from 1889, with zoomed in panel below:
Excerpt-1889

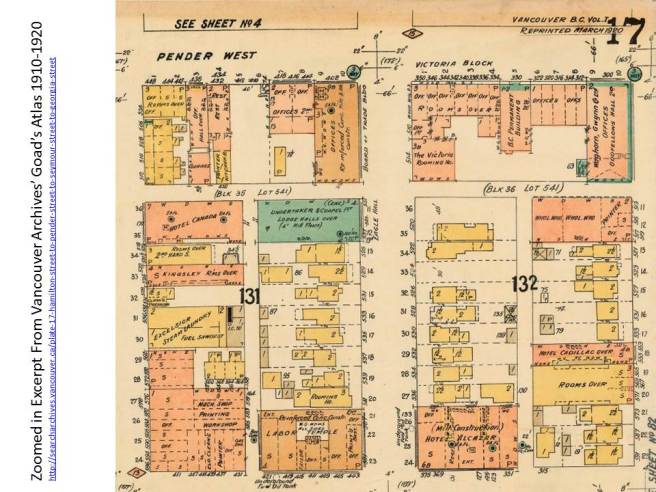
Here’s the Goad’s Atlas Map from 1910-1920, with zoomed in panel below:
Excerpt-1910-1920

This is a first-pass, of sorts, at drawing upon Vancouver’s old fire insurance maps to get at patterns of urban succession in the days before zoning. I’d welcome suggestions, collaborations, and better visualizations! (This was pretty much all done with powerpoint on the fly). In the meantime, here’s my cheap-o little animated gif of the slides above. Enjoy!
 

ASuburbAnimated


*- The Chicago School of Sociology modeled this process on Chicago itself – though McKenzie, it should be noted, also detoured to Seattle in describing “The Ecological Approach” to the study of The City (1925), in a volume for which Park & Burgess are usually given first billing.

**- The maps date from 1889 and somewhere between 1910 and 1920, which is why I say “give or take” in assessing the length of time that’s passed! Though the Goad’s Atlas dates itself as 1910, it was reproduced (with consolidated updates) in 1920, and includes buildings up to at least 1914, which is why I can narrow it down to around 25 years after 1889.


Talking cool old maps

Here’s my talk from February 2018 for the Vancouver Historical Society, now preserved for posterity! I was really delighted to receive the invitation, and the crowd was fun. I’d really encourage others to check out their series of talks.

I concentrated on the earlier sections of my book, and found an awesome old fire insurance map of land use for downtown Vancouver in 1889, available at the Vancouver Archives. I used it as an illustration of how land uses mixed in Vancouver’s early years, much to the concern of reformers and the evolving middle class. Now, of course, it’s the block of Chinatown bounded by Main St (then Westminster) between Keefer and Pender (then Dupont). I’m hopeful I can track down more of these maps soon. Tips welcome!

OldVancouverFireMap-1889


The Great Wait: Changes in Timing in BC’s Birth Rates

While putting together slides for my life course class I returned to BC Stats data on age-specific birth rates. It’s really nice data, broken down by local health area. I’ve played with data on the Total Fertility Rate before. This time I wanted to highlight a far simpler transformation in birth rates that I’ll call the Great Wait!

What is the Great Wait? Basically, it’s the transformation in age-specific patterns of childbearing, whereby most women are having children later and later in the life course. When I was playing around with the BC Stats data I accidentally produced a chart illustrating the Great Wait, and I just thought it was too beautiful not to share.

TheGreatWait-BirthRates

Notice the gradual shift from peak childbearing in ages 25-29 (in 1989) to peak childbearing in ages 30-34 (in from 2003 onward). By 2005, more 35-39 year olds were having children than 20-24 year olds (so called “geriatric pregnancies” – which is like seriously a total FAIL in medical terminology). By 2010, the birth rates for 40-44 year olds began exceeding those of 15-19 year olds. We have fewer and fewer teen moms, and more and more new parents in their forties.

There are many interesting causes and implications of this shift. On average women are taking longer to develop their education and careers before having children than ever before, facilitated by improved contraception and assisted reproduction technology. It may also be that women just don’t feel as ready to settle down into motherhood as they used to – either because the alternatives remain too interesting or because they don’t feel prepared for the job of being a parent yet (I’ve explored this latter explanation with respect to the role of acquiring housing as a stage prop for the role of parenthood here in my academic work).

With respect to the implications, some of the childbearing delayed will inevitably be childbearing denied, as later-life pregnancies are biologically less certain for women, and some new risks are entailed. But on the whole, having children later means parents tend to be more committed and more prepared, with more resources at their disposal to help care for their children. Not a bad thing. On a technical note: the ongoing shifts in the timing of when women have children somewhat artificially inflate the magnitude of recent fertility declines. This is to suggest that 1.4 children (our estimate of the number of children women in BC have on average based on TFR measurement) is likely somewhat lower than the number of children the average of any given cohort of women will ultimately end up with. It’s kind of a demographer fixation.

If the Problem is Speculation, then Why Focus on Foreigners?

Ok, I’ll admit it. I’m an immigrant to Canada. And from the US, which has recently seen a surge in anti-immigrant and anti-foreigner rhetoric and mobilization. We saw the same, of course, in the UK leading up to Brexit, and there are outbreaks in many other places around the world as well. Anti-foreigner rhetoric is having its populist moment. And I don’t like it.

So I’m especially sensitive to anti-foreigner rhetoric. Combine that with my research interests in housing and immigration and my love for my adopted city of Vancouver, and well, you can probably see where this is going: I think we should stop our destructive focus on blaming “foreigners” for our housing problems.

This doesn’t mean we should stop paying attention to the impact of immigration policy and global flows of capital (and there are many good reasons to oppose wealth-based immigration policies like the investor program still operating out of Quebec!)* But it does mean we should stop using “foreigners” as our go-to explanation for sky-high housing prices.

Why? First, it’s dangerous. It should be patently obvious at this point that anti-foreigner rhetoric is the handmaiden to fascism. If I need to explain why that’s bad news, go visit some other blog. Second, it’s sloppy. The concept of “foreignness” is not well-defined in rhetoric, readily lends itself to racism, xenophobia and related “other”-blaming, and remains inconsistent with rhetoric when applied to policy. Let’s take Andrew Weaver’s recent foray into advocacy for a ban on foreign ownership as an example. He defends the ban this way: “We are delighted for people to come and work and live and own property in B.C. but it’s not okay for people to park capital here with no intention of living here.” I’m on-board with carefully tracking flows of capital, but does “foreignness” now apply to folks from Alberta and Ontario? And how do we square “foreignness” with the complexity of immigration? (I worked here on a visa for three years prior to becoming a permanent resident and then citizen, fully intending to live here all the while). Analyst Andy Yan offers a different, but related take for his focus on foreign-buying data: ““It comes down to a question of fairness. As people struggle with keeping their existing home or even having a home in Metro Vancouver, is it fair to treat them in the same way as someone who has a secondary or tertiary home here?” This is an entirely legitimate question, but it has little to do with foreignness, and everything to do with speculation and investment. To put the matter differently, if we’re trying to counter the possible negative effects of speculation and counteract wealth inequality, then I’m in, but if all we’re doing is coming up with policy responses to favor Canadian speculators over foreign speculators, then count me out.

And just what is the balance between “foreign” speculation and Canadian speculation? This is a tricky question to answer, in no small part because we DON’T track global capital very well. Like, at all… I’m all on-board at doing better with this – let a thousand Panama Papers blossom and the CRA take notice! But for now, instead of tracking capital, we track bodies and assign them to residence and rights of citizenship in complicated fashion. We have legislation in BC distinguishing “Foreigners” on the basis of PR and Citizenship status, regardless of their actual place of residence (our “foreign-buyer tax“). And now we have Andrew Weaver extolling the virtues of New Zealand’s proposed “foreign-buyer ban“, which is a little more complicated, but linked to assigned residency (e.g., temporary residents on visas can buy a home, but have to sell it when they leave). The latter issue of residency is what was kinda-sorta measured by Statistics Canada in its recent release of data on non-resident (“foreign”) property ownership (CHSP). This is the data Andy Yan’s been playing around with. But to date most write-ups of this data that I’ve seen, including that from Statistics Canada, have simply focused on the comparison between non-resident (outside Canada) and resident (in Canada) property owners. When we use this as a proxy for talking about speculation, the implicit assumption seems to be that everyone outside of Canada is a speculator/investor/vacation home owner, and everyone living in Canada owns only the property they live in. We lose sight of domestic speculation and investment. How do we fix this?

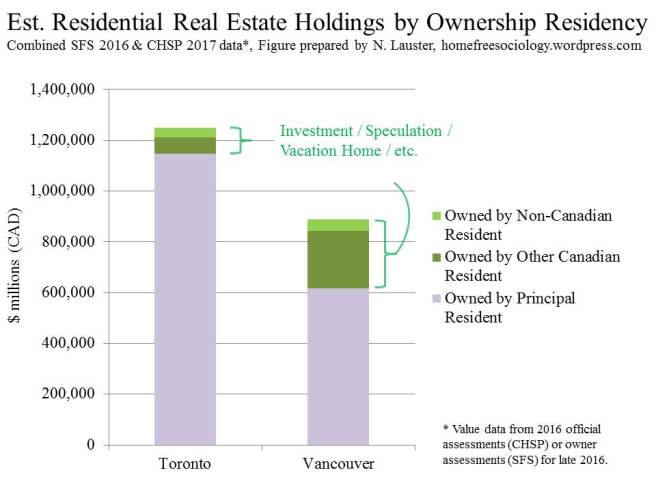
One answer is we combine this information with Statistics Canada’s Survey of Financial Security (SFS). This handy little survey differentiates between principal residence and other real estate for participants, including those in metropolitan Vancouver and Toronto. Here I’m going to combine these datasets together in a very simple and replicable fashion to divide up the value of residential real estate into principal residence, other Canadian residence, and cross-border (Non-Canadian) residence. Effectively I’m just taking the total value of resident real estate holdings from CHSP and subtracting the Principal Residence real estate holdings value estimated from SFS to get the Other Canadian Residence category. This enables us to compare domestic speculators/investors/vacation home owners with foreign speculators/investors/vacation home owners. So what does total property value look like broken down into Principal Residence, Other Canadian Residence (a.k.a. “domestic investors”), and Non-Canadian Residence (a.k.a. “foreign investors”)?

Something like this:

Res-RE-Holdings-Residency

Principal resident owners are separated out in purple, leaving only the properties held by investors / speculators / vacation home owners and the like in green. These are further distinguished between owners residing someplace else in Canada and owners residing someplace else across the border. In Toronto, these two groups are closely matched, though domestic investors look just a little more prominent than international investors and both are dwarfed by principal resident owners. In Vancouver, overall investment in the real estate market by non-owner occupiers is much, much larger, and domestic investors account for the lion’s share of the investment. Many of these investors, no doubt, live in Vancouver (where the SFS data estimate around 1 in 5 families own a second property besides their principal residence). Others live in Toronto, Calgary, and elsewhere across the country.  But with respect to Vancouver’s place in Canada the following seems clear: If speculation is the problem, then its largely home-grown.

There are some decent arguments out there for favoring the buyers in purple over the buyers in green. We’ve got lots of policy options for reducing the value of BC properties as investment vehicles – many having to do with tax policy. There are even better arguments, I think, for focusing on providing lots of affordable rental and non-market housing options for people so that ownership isn’t the only decent game in town. But what arguments do we see for favoring the folks in dark green over the folks in light green? If the important thing is to prop up the middle class in their entry into home ownership, why pit middle-class home ownership against foreigners instead of against the far broader class of investors and speculators as a whole? It’s for BC’s Green Party to answer that one, I guess…


*- I’m proud to have elicited the approval of at least one prominent academic I admire by ending my recent co-authored piece on Chinese-Canadian immigration with the line: “Investigations into the work of home-making suggest how Canada’s immigration policies contribute to rather than ameliorate global inequality, revealing an invitation that reads: give us your energetically leisured, your wealthy, your elites yearning to breathe freely.” Yes. We can do better, including taking in lots more refugees instead of fast-tracking “investor-class” immigrants!

NOTE: Inspired by the transparency of Jens von Bermann’s gitHub kits, but not knowing how to do that, please see my following spreadsheet if you’re interested in the data extracts I worked with and how I produced the above! Feel free to check my work and by all means let me know if I missed something!

ValueRE-SFS-CHSP-2016

The Things I Teach

I’m archiving my syllabi for current and recent undergraduate courses here on the blog, both for (ungated) student use and for public consumption. My courses all combine interactive lectures with student-led reading group discussions and some form of sustained research or building project.

Built Environments (2018) UBC SOCI 364: Syllabus-BuiltEnv2018

Sociology of the Life Course (2018) UBC SOCI 324:  Syllabus-LifeCourse-2018

Urban Sociology (2017) UBC SOCI 425-A:  UrbanSoc-Syllabus-2017

In the recent past, I’ve also taught graduate level courses (especially in Urban Sociology) and our undergraduate course in Research Methods. For other teaching scholars out there, please send me any suggestions for improvement! I’m especially interested in keeping my readings updated and interesting.

What Do Canadians Do All Day?

While preparing to teach my sociology of life course class, which is kind of like a sociology of time, I recently stumbled across the data tables (45-10-0014-01) from the Canadian Time Use Survey for 2015. This allows me to answer a very important question: what do Canadians do all day?

Of course different Canadians do different things.* But we can break them into a couple of broad groups to get some sense of the average number of hours they spend doing various things. It’s important to keep in mind that here that the averaging extends across both different people and different days (e.g. of the week, month, and year). Many people don’t record carrying out some of the activities described below at all, but they get averaged in with those who do. Others’ activities (e.g. paid work) may cycle so that active and inactive periods (like weekdays and weekends) average out (so a 40-hour work week averages to 5.7 hours a day).

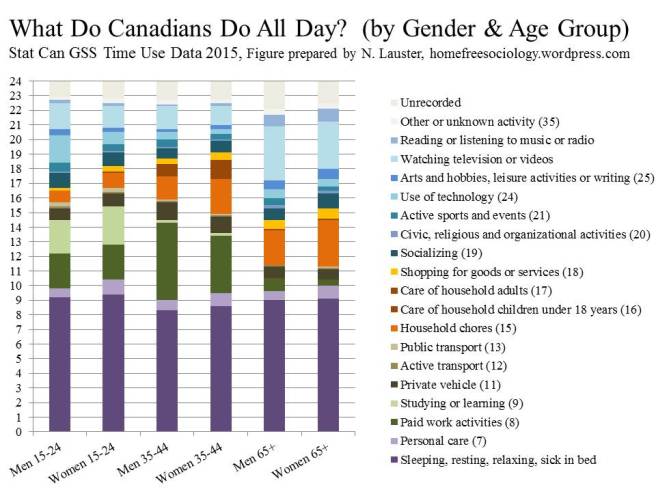
Since I’ve got this life course theme and we’ve got data on age groups, let’s look at that. How does time use change between young adults, more middle-aged folks, and elders? We can split this out by gender too. I’ve color-coded activities so that sleep and personal care are in purple shades, work and study in green, travel in gray, unpaid homemaking work in orange, and leisured activities in blue. There are usually between one and two hours unaccounted for by this schema, coded in shades of off-white at the top.

TimeUse-2015


Not surprisingly, young adults (age 15-24) spend more time studying than any other group. They’re the ones most likely still in school! But this time is balanced against working. Young men have strikingly more leisure time than young women, and they appear to spend a lot of it using “technology.” I suspect that means they’re playing video games for, like, an average of two hours a day, but there may be other interpretations (see footnote 24 in the original).

Folks closer to middle age spend a lot more time working, both for pay and at homemaking tasks (esp. childcare!) They also appear to spend the most time in personal vehicles. And they get less leisure time and less sleep than at other ages. But once again, men appear to get more leisure time than women.

How about those in retirement ages? Both men and women get a lot more leisure time (which they appear to spend largely watching TV). But do women catch up? Nope. Men still get the most leisure time, and the difference largely seems to come down to how much time is spent devoted to household chores instead. It’s certainly possible that some of those chores might also qualify as hobbies (e.g. cooking), and other things, like “personal care,” also help account for differences in time left over for leisure between men and women. But household chores and carework definitely remain gendered.

So, if you’re a Canadian man looking for a New Year’s resolution, here’s an easy one: take on more housework! (Note: this absolutely includes the author). The other big message for me is: I am not getting enough sleep! I mean seriously, I’m doing better than when my kids were really little, but 8 hours is still entirely aspirational.


*-An important caveat. As is so often the case, the General Social Survey doesn’t cover or claim to represent all Canadians.

The 2015 GSS collected data from persons aged 15 years and over living in private households in Canada, excluding residents of the Yukon, Northwest Territories and Nunavut and full time residents of institutions.


A Little Army of Artisanal Landlords

A relatively recent Sightline Institute post by Margaret Morales explores a key difference between development patterns in Seattle and Vancouver. While Seattle tends to construct lots of purpose-built rental apartments, Vancouver tends to construct condominiums. Why? The post walks us through various explanations, many of which have to do with tax codes. Rental construction in Canada is burdened by bad tax policy, including, for instance, the application of GST to rental construction (many housing advocates were hoping the recent Canada National Housing Strategy would roll back these taxes, but no luck!) On the other side of the border, many Seattleites would actually like to see more condos! Morales provides guidance for what’s holding condo development there back – much of it having to do with insurance policy.

On the whole, Morales provides a nice little dive into cross-border policy differences*. Moreover, Sightline is a handy little organization to have around. I’ve been a fan ever since I first came across their old papers (here and here) comparing Vancouver and Seattle in terms of sprawl. I still teach with these sometimes!

But I wanted to provide a little more insight into Vancouver’s rental situation. Morales is absolutely right about Vancouver’s dearth of purpose-built rental construction (though more is in the pipeline!) Nevertheless, Metro Vancouver appears to have almost EXACTLY the same proportion of households renting as Metro Seattle: just a little over 36%. How does that happen? Enter Vancouver’s little army of “artisanal landlords.”**

RentalStock

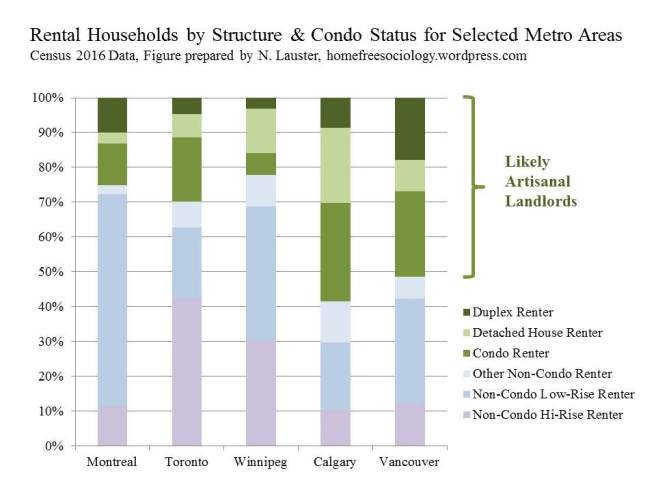
What do I mean by “artisanal landlords”? Effectively I’m talking about people who own and rent out one or more properties beyond their principle residence, but probably don’t consider themselves professional landlords (I’m sure there’s a reasonable cut-off concerning how many units you might own before crossing over… maybe five?). These artisanal landlords are important for multiple reasons. First, to get back to that Sightline piece, while Vancouver’s mostly been building condos, about one in three condos ends up occupied by renters.*** Effectively, this means about a third of our condo stock is actually treated like rental stock, only controlled by artisanal landlords. Legally, these rentals are subject to both the residential tenancy act and local strata (condominium) by-laws (which in some cases do not allow rentals at all). This sometimes makes for confusing jurisdiction, especially since tenants are often forced to communicate with strata councils through their landlords, and vice-versa. As for the artisanal landlords themselves, they may have limited knowledge of their actual obligations, and if they contract management of their properties out, that adds another level of bureaucracy to an already tenuous relationship.

In addition to condo rentals, another huge chunk of Vancouver’s rental stock is made up of secondary suites. Many (though not all) of these secondary suites are carved up from buildings that were once, ostensibly, single-family detached houses. So we get the familiar basement apartments Vancouverites know and *ahem* love, often tucked away beneath their landlords above. Sometimes the above suites are rented out too, and even further subdivided. Pretty much all duplexes are owned by artisanal landlords, many of them on-site. Triplexes and other internally subdivided houses that might be owned by artisanal landlords are trickier to find (grouped in with the non-condo other and low-rise categories above).

Then, of course, there are the rented detached houses, which in most cases are likely also owned by artisanal landlords. Combining the three likely artisanal (or smallholding) landlord types, we see they make up the majority of rental situations in Vancouver (as well as in Calgary). Other rentals, especially low-rises (which may contain as few as three units) and townhouses, may also be run by smallholding landlords, but are more likely to have professional landlords.

The difference between artisanal and professional landlords matters for how well different rental units are run, how often discrimination occurs (see my past scholarly work on this here), how many protections renters receive, how stable tenancies are likely to be, and how well rental units can be tracked (the CMHC has only recently tried to get a handle on what they call the “secondary” rental market, and Metro Vancouver can only estimate a range for just how many secondary suites exist in the area, echoing my difficulty in pinning them down beyond “likely”).

So if we have some idea about how many rental units are likely controlled by artisanal landlords, can we estimate how many artisanal landlords there are? This is actually surprisingly tricky! It’s not a question asked in the Census. But there IS a question asked about ownership of real estate aside from one’s principle residence in Stats Canada’s Survey of Financial Security (tables here). There are caveats to using this measure as a proxy for how many artisanal landlords we’ve got in Metro Vancouver (lots of people own vacation properties elsewhere and non-residential real estate is also presumably included), but it gives us something to work with.

The data suggests that over 20% of Vancouver’s families own real estate aside from their principle residence.**** That’s approximately 216,000 families in all, potentially making for quite a few artisanal landlords (the number has more than doubled between 1999 and 2016). We also know the median value of these holdings, which is CAD$400,000 – about the price of many Vancouver condo units (this value doubles for Vancouverites in the wealthiest quintile). Of course, this probably doesn’t even include those artisanal landlords with basement suites below them, since it’s likely they’re considering their secondary suites as contained within their principle residences.

So even though Vancouver hasn’t built nearly as many purpose-built rental buildings as Seattle, we’ve still built lots of units that get rented out. Moreover, artisanal landlords are worth keeping an eye on, both because of what they imply for renters and rental markets, and because they’re likely a potent force in local politics. Considered as a class, they have plenty of plausible reasons to both oppose new purpose-built rentals (competition for tenants) and to cast blame on foreigners (competition for properties). It’s a group worth watching more closely.


*- minor note: I managed to rip only a teeny bit of my hair out over the mixing of terms for tenure arrangements (rental, condominium ownership, etc.) with terms for structure arrangements (apartment, rowhouse, etc.). But I suppose when I write a book describing how often people fail to make these distinctions – often justifiably – I really can’t complain.

**- I stole the “artisanal landlord” descriptor from Jens Von Bergmann, who may very well have stolen it from somewhere else.

***- notably, this does not include condos not occupied by usual residents, where we do not have data from the census.

****-Of note, the only other major metro area exceeding 20% of families reporting owning RE besides their principle residence is Calgary!

A Limerick (and a reply to a response to a critique of a study)

John Rose posted a response to my critique of his study this morning. Almost immediately after I was alerted to the posting (via Kerry Gold), we met up to chat at Sweet Obsession cafe. In appreciation of this turn of events, I offer this limerick:

John Rose is a very nice guy

Despite our dispute o’er supply

We just met for tea

And we mostly agree

Where not, please see my reply

He really is a nice guy. And in order to insure our back-and-forth doesn’t become too tiresome, I’ll offer just a quick reply.

  1. Though I replicated John’s Census results from 2001-2016 for Vancouver, I apparently did not replicate his results for other metro areas. I admit, I didn’t catch this, since I was focused on Vancouver (and since I ran the replication of his 1.19 ratio of new dwellings to new households very quickly, before he’d provided his full report). I don’t know why his results and my own differ for metro areas beyond Vancouver, but it’s worth looking into! The data should be from the same source (Statistics Canada), but sometimes they report things differently in different documents, and it’s also entirely possible that errors were introduced in transcribing data (in which case, they were probably mine! My response was hastily assembled). Though it does not change the results for Vancouver, it’d be good to nail down overall dwelling count and occupancy changes.
  2. As John notes, the Census does not offer guidance with respect to how their procedural changes affect underlying dwelling count data between 2001 and 2006. But in noting their newly inclusive criteria for expanding the count of secondary suites, they clearly point out how single-family dwellings changed to duplexes in their structure data. This implies that each of those dwellings formerly counted as one unit (but containing a secondary suite) would henceforth be counted as two or more. As we know, Vancouver has a LOT of secondary suites, and this shift in classification both could and should have boosted the count of dwelling units significantly, even without any new dwellings being built or added. Worth noting as well that new secondary suites are the LEAST likely to show up in permitting data (though the Metro Van databook for 2017 at least tries to capture them). It would be great to get more from the Census on the characteristics of “dwellings unoccupied by usual residents.” On a related note: I’d love it if someone could point me toward or carry out an intensive study of how the Census counts dwellings in Canada!
  3. John acknowledges the awesomeness of the construction permitting data, but does not (yet) engage with how much better it fits new household formation than census counts of dwellings, indicating a shortage rather than a surplus of supply. I’ll look forward to seeing his comparison between construction and census data if he’s able to pull one together! (Both of us have time constraints involving stacks of grading and lots of other work on our plates).

Otherwise, as I said, John Rose is both a nice guy and clearly well-intentioned. He mentioned during our conversation that his study was motivated over concerns about new construction in the Agricultural Land Reserve (ALR) in Richmond. On this point, we clearly agree. The ALR is worth saving, and we don’t need to expand our housing supply any further out into Vancouver’s agricultural and wild lands, which is part of why I focus on densifying single-family residential neighbourhoods as the best path toward making Vancouver a more affordable, more inclusive, more lively, and more sustainable city.


[Postscript, Dec 15th: for more see Jens’ careful response with a detailed dive into the data over at MountainMath, and see the smart historical commentary on the Census in Vancouver in the comments below by the folks at Changing City (added bonus: see their lovely pictures of changing streetscapes around town!)

Overbuilding vs. Undercounting

As mentioned in my previous post, the sensational claim that Vancouver has built 1.19 dwelling units for every new household added since 2001 has been making the rounds, leading many people to suggest Vancouver has over-built for the past fifteen years. We don’t need any more supply, they suggest! First, make better use of what we’ve got!

Here I want to offer an alternative theory: We haven’t been overbuilding at all. But we have been undercounting.

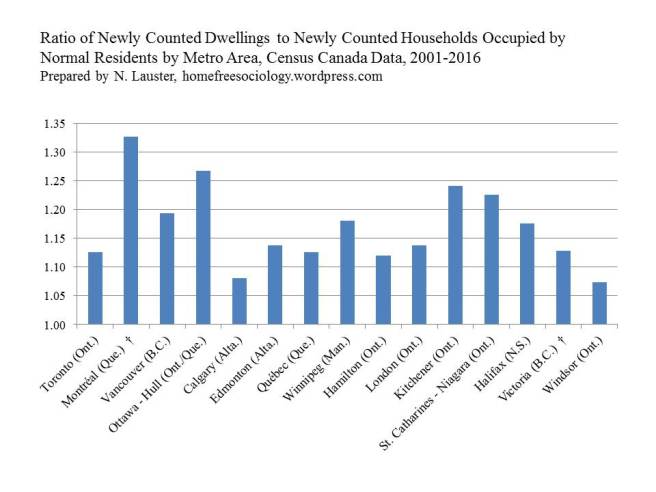
First let me reproduce the numbers behind the claim. Here’s what happens when we compare counts of dwellings in 2001 and 2016 to counts of households across the same years. (*correction: as pointed out in a later blog post, my #s are off here compared to Rose’s #s, likely a result of different sourcing and errors introduced in hasty tracking down/transcription – see also addendum below. These errors don’t change the substance of the broader critique introduced later in the post. See Jens for better replication!*)

RatioNewDwellingsNewHHs-2001-2016

Sure enough, Vancouver clocks in at a ratio of 1.19 Newly Counted Dwellings to Newly Counted Households between 2001 and 2016. BUT two things bear observing. 1) Vancouver isn’t especially unusual in this regard, and 2) I used the words “Newly Counted” rather than “Newly Built” for a reason.

It’s hard to count dwellings. I used to work cleaning up census data for public release as a post-doc with the Minnesota Population Center (beloved home of IPUMS census microdata files freely available to everyone). As a result, I have some idea how messy census data can be. Counting people is difficult at the scales at which censuses operate. Counting and classifying dwellings is only the first part of that endeavor. But every census year, the folks at Statistics Canada work toward getting better and better at their jobs. Everyone there deserves a raise!

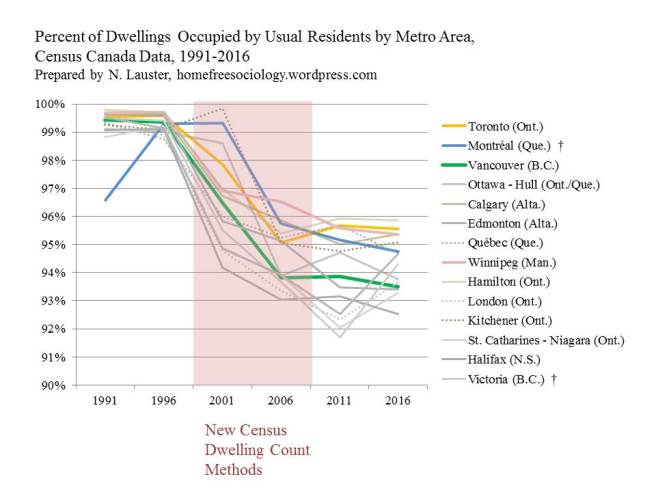
Unfortunately, sometimes when people at the Census get better at counting, it screws up our ability to perform decent historical comparisons using the data. (A similar problem, of course, plagues homeless counts). In 2001 and again in 2006, the people working on the Canadian Census tried out some new techniques for counting dwellings. They footnoted these techniques, and raised flags about data comparability (for more follow-up on the links above), but I don’t think anyone has adequately accounted for their effects on our estimates of occupancy rates. So let’s do a little comparison. Here’s the proportion of dwellings occupied by usual residents from 1991-2016.

PercentDwellingsOccupied1991-2016

Notice how EVERY single one of our top fifteen metropolises shifts down together in occupancy between 1996 and 2006? By 2011, nowhere in the country had an occupancy rate anywhere near the (frankly unrealistic) highs of 1996. That’s a big old red flag that the methods Statistics Canada incorporated into the census for counting dwellings across these years underwent some pretty important changes, challenging comparability across different Censuses.

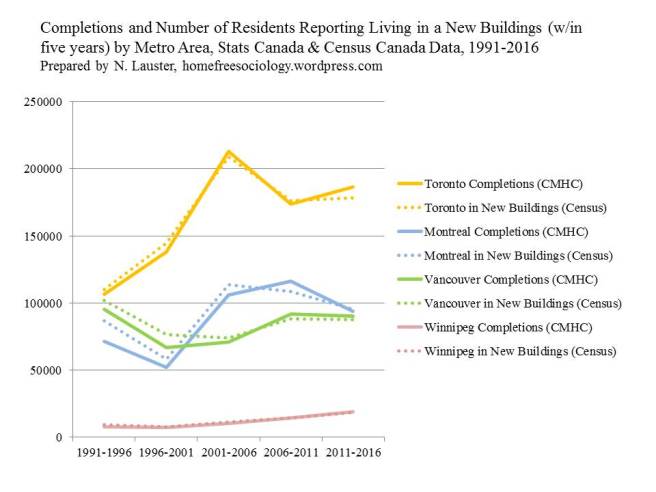
So, if friends shouldn’t let friends run historical comparisons of Dwelling Occupancy (by usual residents) using the 2001 and 2006 census years, then what data SHOULD we use to assess new supply? Fortunately, we have CMHC construction data! This is provided to Statistics Canada via surveys of municipal permits. Not all metro areas have this data made public, but metro Toronto, Montreal, Vancouver, and Winnipeg do! Let’s test construction against some census data, shall we?

First, let’s look at completions data (referring to new dwelling units added to the market) for five year periods. How well does this compare with the number of people who report living in a new dwelling unit in the Census at the end of the period? I matched up the timelines for census data (which always uses the past five years leading up to the Census, which happens in May) and completions data (reported on a monthly basis). Are we building a lot of homes that no one reports living in?

Completions2NewHousing1991-2016

Wow! Quite the opposite, it would seem. In early census years, more people report living in new homes than we have permitting data for.* Nevertheless, overall there’s a very close match between permitting data for new homes completed and census data on who reports living in a new home! This makes me feel better about both data sources. I read this to suggest that the permitting data is probably our best source for how much new housing we’re adding in a given metro area. For sure, it may miss internal subdivision of units and other sneaky additions that can be made to our housing stock, but it probably captures most new supply. Moreover – and this is important – very few new homes would appear to be empty – or even occupied by anything but their usual permanent residents. What do you know? When you build new homes for people, they report moving into them!

Ok, ok, so people like new homes. But what about the old homes destroyed to make the new homes? Good question. We haven’t really matched up new households between census years to new building stock yet. With both completions and demolitions data we should be able to track how many net dwellings we’re adding. I’m having a hard time getting all of the demolitions data I’d like, but drawing from the Metro Vancouver housing data books from 2010 and 2017, I can pull together enough demolitions data to get us back to 1999, and then impute the rest of the way back to 1996. Let’s compare new households counted across census years to net dwellings constructed during the same time periods** in Metro Vancouver. Just for kicks, we’ll throw in the additional number of dwellings counted during the same period.

NetConstructiontoNewHHs1996-2016

Wow! New households occupied by usual (or normal) residents very closely tracks net construction (completions – demolitions). In recent years, the relationship is almost one to one. In earlier years, we actually added more new households than we did net permitted housing units. Why? Well, we probably found and/or counted some new households living in basement suites and other internal subdivisions not captured by the permitting data. After all, the census would appear to be getting better and better at finding these things! Yay!

Key points for the day:

  1. Census workers should be paid more.
  2. Friends don’t let friends use intercensal comparisons of dwelling counts to establish trends during years when dwelling count procedures change.
  3. People move into new housing when we build it!
  4. There is very little “slack” in the relationship between household formation and supply of housing in Vancouver – so adding new supply is definitely something we should be looking to do.


* could be a weighting issue, an inaccurate reporting issue, or an incomplete permitting data issue.

**- this time I’m being a little more conservative in matching, using net data on previous years and just ignoring the period from Jan-May of the census year in gathering completion data.

[Thanks to Richard Wittstock for sharing his spreadsheet on permitting data, which helped me track down sources for the above!]

[Addendum, Dec. 4th, footnoting sources: After some frustration trying to find dwelling and occupied by usual resident household data for 1996 and 1991, I used hard copies of Census reports for 1991 and 1996 from UBC Library to find dwelling count data, then compared to household counts from Census reports in on-line community profiles to find households occupied by usual residents. This looks notably different from results produced by Andy Yan in the Vancouver Sun earlier this year. His results – for Vancouver only – look much more realistic! The underlying issues with comparing dwelling counts across 2001 and 2006 census years remain (though the trend may vary – in Andy’s data there’s actually a marked drop in non-occupied units in 2001, which I find fascinating), but I’m following up to try and track down better stats on these years. Other sourcing and data matching should be apparent from the descriptions above, but it’s worth noting that the proportion of residents identifying themselves as living in housing built in the five years leading up to each census comes mostly from census profiles, drawn from census long-form information, weighted to reflect households. I also drew this data from on-line analyses using UBC’s subscription to the CHASS interface with public-use census micro-data for some earlier years. Then I compared these figures to Metro Area-specific construction data for the five years leading up to the Census, including the months of January-April in the Census Year itself. Censuses, of course, are usually carried out in May. I was more conservative in estimating net dwellings constructed, counting only completed units up to the year ahead of the census year rather then extending into May, which allowed me to link up yearly demolitions data from Metro Handbook(s) – linked above. This means there may be slightly more net units added over a given time period – four months worth – than are tracked here. At the same time, I’m not entirely certain how and when newly constructed units get added to Census counts of dwellings and households in the process of preparing the Census! I’d really love to get a better handle on how Census counts of dwellings work… and possibly fail to work… in a practical and time-lined sense. I’m a big fan of their illustrations for how to classify units! Aren’t they vaguely adorable?]

Notes on the “Myth” of housing supply

Much has been made of a recent study purporting to demonstrate that adding to supply has done little to nothing to bring greater affordability to Canada’s most unaffordable cities. Though I’m loathe to keep it in the limelight, I feel some responsibility to respond to the study, both because I was quoted in its initial media roll-out (despite not having had a chance to see the study), and because once the study was finally written and released it cited me – kind of – through an old press release for my book (To the author: thanks for citing me, though I might also recommend actually reading my book!).

Unfortunately, I need to start by noting that the study itself is not high quality, either theoretically or methodologically. The terms supply and demand are not conceptualized in the way the economists who more or less invented them use them (i.e., as terms in the balancing equation that constitutes the market pricing mechanism), but rather in somewhat idiosyncratic fashion. In part as a result, I initially found it a little confusing to respond to the study. I certainly agree that widening inequality makes our general reliance upon market-distribution of housing problematic for insuring equitable outcomes. In other words, the whims of rich people for a second or third home carry way more weight in the market than the shelter needs of poor people. That is a real problem that would be entirely consistent as an interpretation of the study’s findings. But that’s not the same as arguing that supply doesn’t matter, and indeed would even suggest that adding lots of non-market housing (new supply!) would be a direct way of insuring the housing needs of poor people outside of the market.

It would seem to me that the only reason to suggest supply DOESN’T matter is to effectively take off the table many policy options that might help address our current housing affordability issues. It’s kind of like we’re all in a sinking boat. Most of us are saying, “we’ve got to bail out this water and plug that leak in order to stay afloat!” But someone in the boat is picking a fight, arguing, “No! Look, we’ve tried bailing out water. Look at all the water we’ve bailed out! But now we’ve still got water in the boat. We should stop bailing out and just focus on plugging the leak.” That’s an interesting strategy, but I’d rather stick with bailing out and plugging up at the same time. (I’ll leave the economists out there to keep providing other metaphors).

So yes, I’ll continue to argue for more supply – especially by enabling more housing options on all that single-family residential (RS-zoned) land in and around Vancouver currently reserved only for millionaires. But I’ll ALSO continue to suggest we should be doing things to make the housing market work better, including (but not limited to):

  • Taxing Vacant Homes (and vacant lots!) like Vancouver’s new Empty Homes Tax
  • Raising Property Taxes, esp. in progressive fashion
  • Rebalancing tax burdens from income to property, as with the clever BC Housing Affordability Fund proposal
  • Cap the currently unlimited tax exemption of capital gains from sale of primary residence

All of these things would make investment in housing as a commodity less profitable and help remove some incentives currently in place to sit on empty properties, without renting them out, in order to accrue the capital gains by doing nothing as the property appreciates (e.g. speculation). But if we’re truly concerned about housing affordability, let’s not tie one hand behind our backs. Let’s keep bailing out water and plugging the leaks in our housing market at the same time.

What about the methods of the study themselves? They need some work. For instance, the author uses different measures and different data sources to compare affordability across time, with the most recent data (taken from Demographia – not gonna link to them) also the least transparent. The author also only focuses on market purchase price (as opposed to rent and/or cooperative share price), effectively setting aside those for whom affordability is a more life and death matter. I’m not going to do a deep dive here, in part because with respect to purchasing affordability, even had the comparison been carried out more carefully, the same results would obtain. There’s no doubt Vancouver has gotten more expensive in recent years!

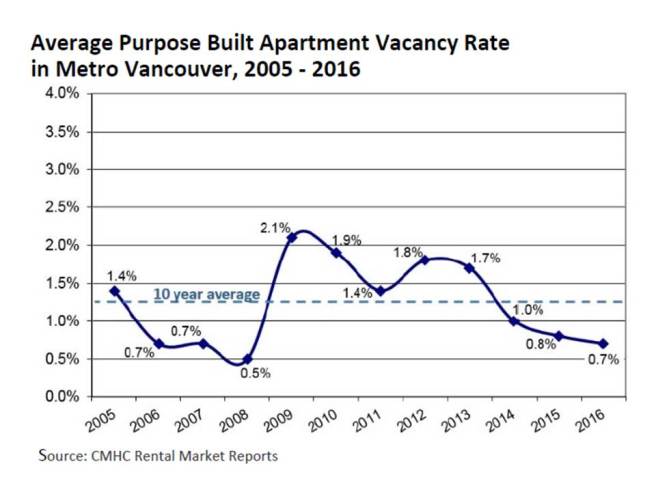
But what about that supply issue? Have we been overbuilding as much as the author suggests, adding an eye-popping 1.19 dwellings for every new household created since 2001? I replicated this result based on census data I gathered right after the first media report came out, and it deserves its own blog-post (up next! spoiler: I’m pretty sure we’re not overbuilding). Before I get there let me leave you with recent vacancy rates for rentals in Metro Vancouver. If we’ve got too much supply, it sure hasn’t hit the purpose-built rental market. Latest update just came out. Good news! We’re almost back up to 1%.

Vacancy-MetVanHouseBook