(Joint with Jens von Bergmann and cross-posted at MountainMath)
How are big Canadian Metros growing? Can we see different patterns? Here we want to provide a brief look back at the last 25 years, exploring change over time from 1996 to our most recent Census in 2021. This is also a test of R skills for one of us, who began this post as a learning exercise drawing upon Jens’ excellent CanCensus package and recent data updates.
Here we’re simply going to compare housing stock by dwelling type in 1996 and 2021 for Canada’s big three metro areas (Toronto, Montréal, Vancouver) and Calgary (effectively tied with Ottawa & Edmonton for fourth place). What this allows for is a peek at how the housing stock of these metro areas has changed as they’ve grown. There are caveats to this quick look, of course. The two most prominent being that the definitions of housing structure and the boundaries of metro areas may have changed. We have written before about the change to Census methods and the problems this creates for analysis of housing stock (in particular we picked up a lot more secondary suites as Duplexes after 2006).
The Toronto, Vancouver and Calgary CMA boundaries have stayed the same across those 25 years, but the boundaries of Metro Montréal have changed significantly (more about the CMA concept here). As we will be taking differences of dwelling counts between these years it’s important to harmonize these boundaries, and we choose the 2021 CMA boundaries for that by simply intersecting 1996 CSDs with the 2021 CMA boundaries and keeping those with large overlap. That leaves us with some very minor mismatch where CSD boundaries have changed over the years which should not skew our results in meaningful ways. Keeping this in mind, let’s take a peek!

We can see that all four of our metro areas grew quite a bit between 1996 and 2021, adding hundreds of thousands of households. But they varied in the different kinds of dwelling type or structure new households occupied. Let’s shift our stacked bar chart so that we get percent of households occupying each type.
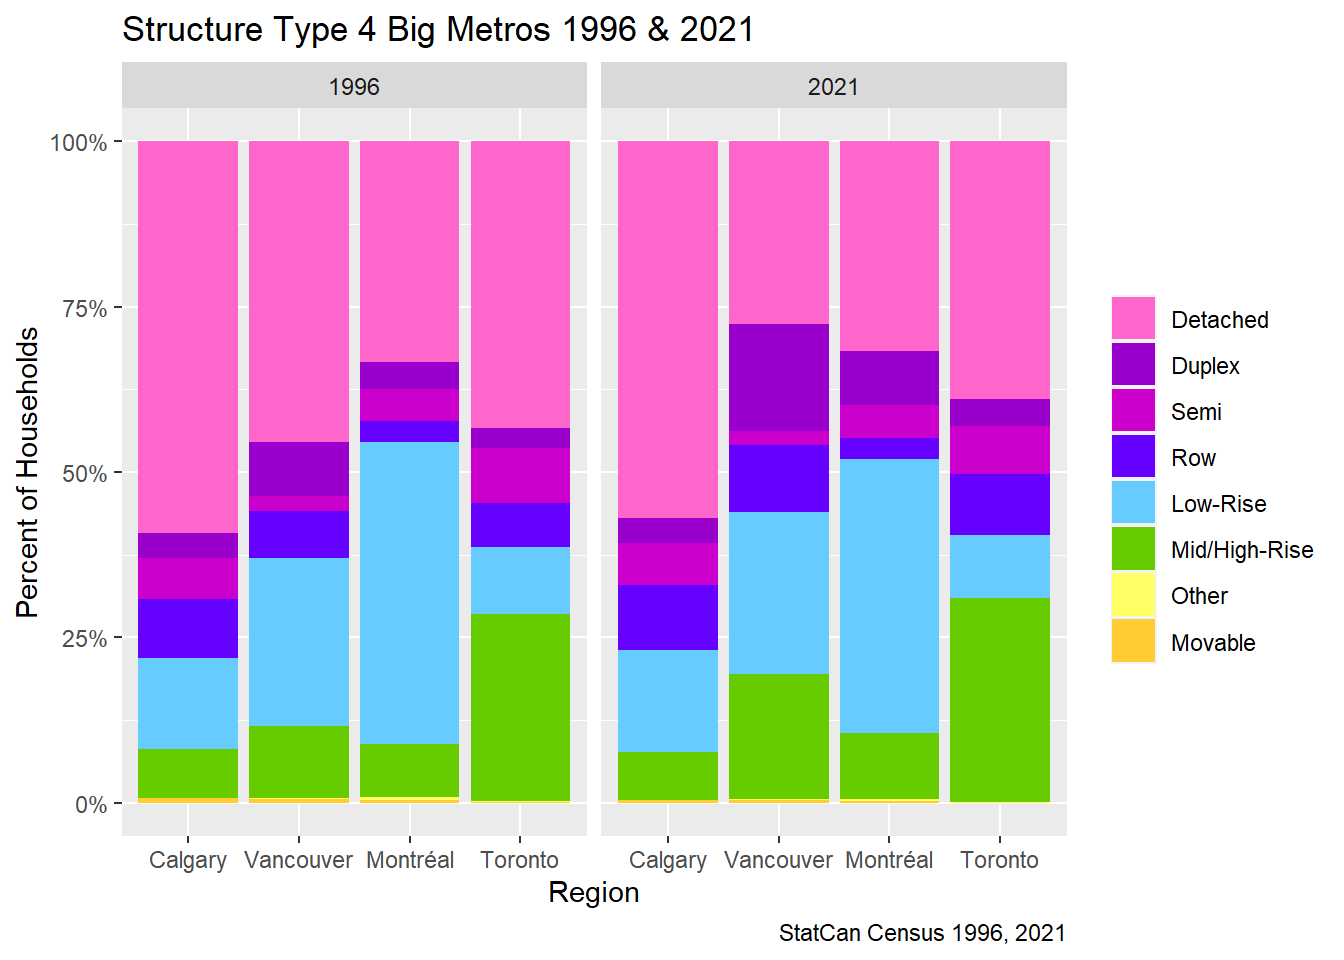
Here we can more clearly see the different compositions of each Metro area. In particular, we can see that Calgary consistently has the largest proportion of households living in single-family detached houses, while Montréal remains predominantly low-rise and Toronto dominates the high-rise category. Vancouver increasingly appears somewhere between Toronto & Montréal in terms of its balance between low-rise and high-rise.
Of particular interest, between 1996 and 2021 Vancouver surpassed both Toronto and Montréal to become the large North American metro area least dominated by single-family detached houses. But it did so in no small part by transforming (and having the Census reclassify) many of its single-family houses as duplexes, i.e. houses containing separate basement suites. As argued in Nathan’s book, this renovation of existing single-family housing stock remains the “sneakiest” way Vancouver has added to its density. But Vancouver has also continued to more visibly add low-rise and high-rise apartments.
Let’s look more directly at how new households have been added across each of our big metros across the last quarter century. Below we simply subtract occupied housing stock in 1996 from occupied housing stock in 2021, leaving us with net change in each category.

We can see that Calgary has mostly been adding more single-family detached houses to accommodate its new households, continuing to sprawl outward. While Montréal also added a lot more single-family detached houses, some of this addition simply reflected its expanded boundaries, and it also added a relatively balanced mix of duplexes, low-rises, and high-rises. Toronto also sprawled further outward with many single-family detached houses, but also added a lot more row houses and high-rises. Meanwhile, Vancouver actually lost single-family detached houses. Some of these were simply re-categorized as duplexes, either rebuilt or simply recognized as such by the Census after the widespread legalization (or at least general acceptance) of secondary suites across the region. But the decline in single-family detached houses in Vancouver also reflects a very strong set of barriers against further suburban sprawl in the region. In particular, the Agricultural Land Reserve has prevented the further transformation of farmland to new subdivisions. As a result, most new growth has been spread across more dense forms of urban infill. Generally speaking, a success in terms of sustainability!
Let’s track this a different way, by looking at the spread of built-up area within and surrounding each big CMA. This data comes from satellite imagery, coded and shared for public use. We’ve played around with it before. Below we match satellite imagery coding built-up area to 2021 CMA boundaries as determined by Statistics Canada, which is what we used for the comparative graphs above.

We can see larger sections of dark red, indicating recent built-up land, all around the outskirts of Toronto and Calgary. We can also see that the built up area of Toronto spills over its CMA boundaries along the shores of Lake Ontario into neighbouring Hamilton and Oshawa CMAs, while Calgary is near to spilling over its CMA boundary to the South toward Okotoks. The pattern of sprawling growth is more muted in Montréal, but we can see how outlying built-up areas might be integrating with the City, creating an expanded Metropolitan area. Vancouver demonstrates what looks like the least outward growth in built-up area, corresponding well with the dwelling type data from the Census. Those parts of the CMA boundaries still in gray are largely all protected by Vancouver’s various regulations, especially its Agricultural Land Reserve to the South and East, but also topography and parks or reserves to the North. The nearby CMA of Abbottsford is also visible outside of Vancouver CMA boundaries to the SE, and current commute patterns would force inclusion of Abbotsford-Mission into the Vancouver CMA if it wasn’t it’s own CMA already. Similar constraints prevent Toronto CMA expanding and swallowing or eating into neighbouring CMAs.
Technical restrictions of CMAs to “expand” into already established CMAs raise the question if we need an additional definition of “functional CMAs” that only look at current commute patterns and contemplate what CMA boundaries would look like if we took a clean approach that ignores precedents of historically established CMAs. We might come back to this in a future post.
As usual, the code for this post is available on GitHub.
Appendix
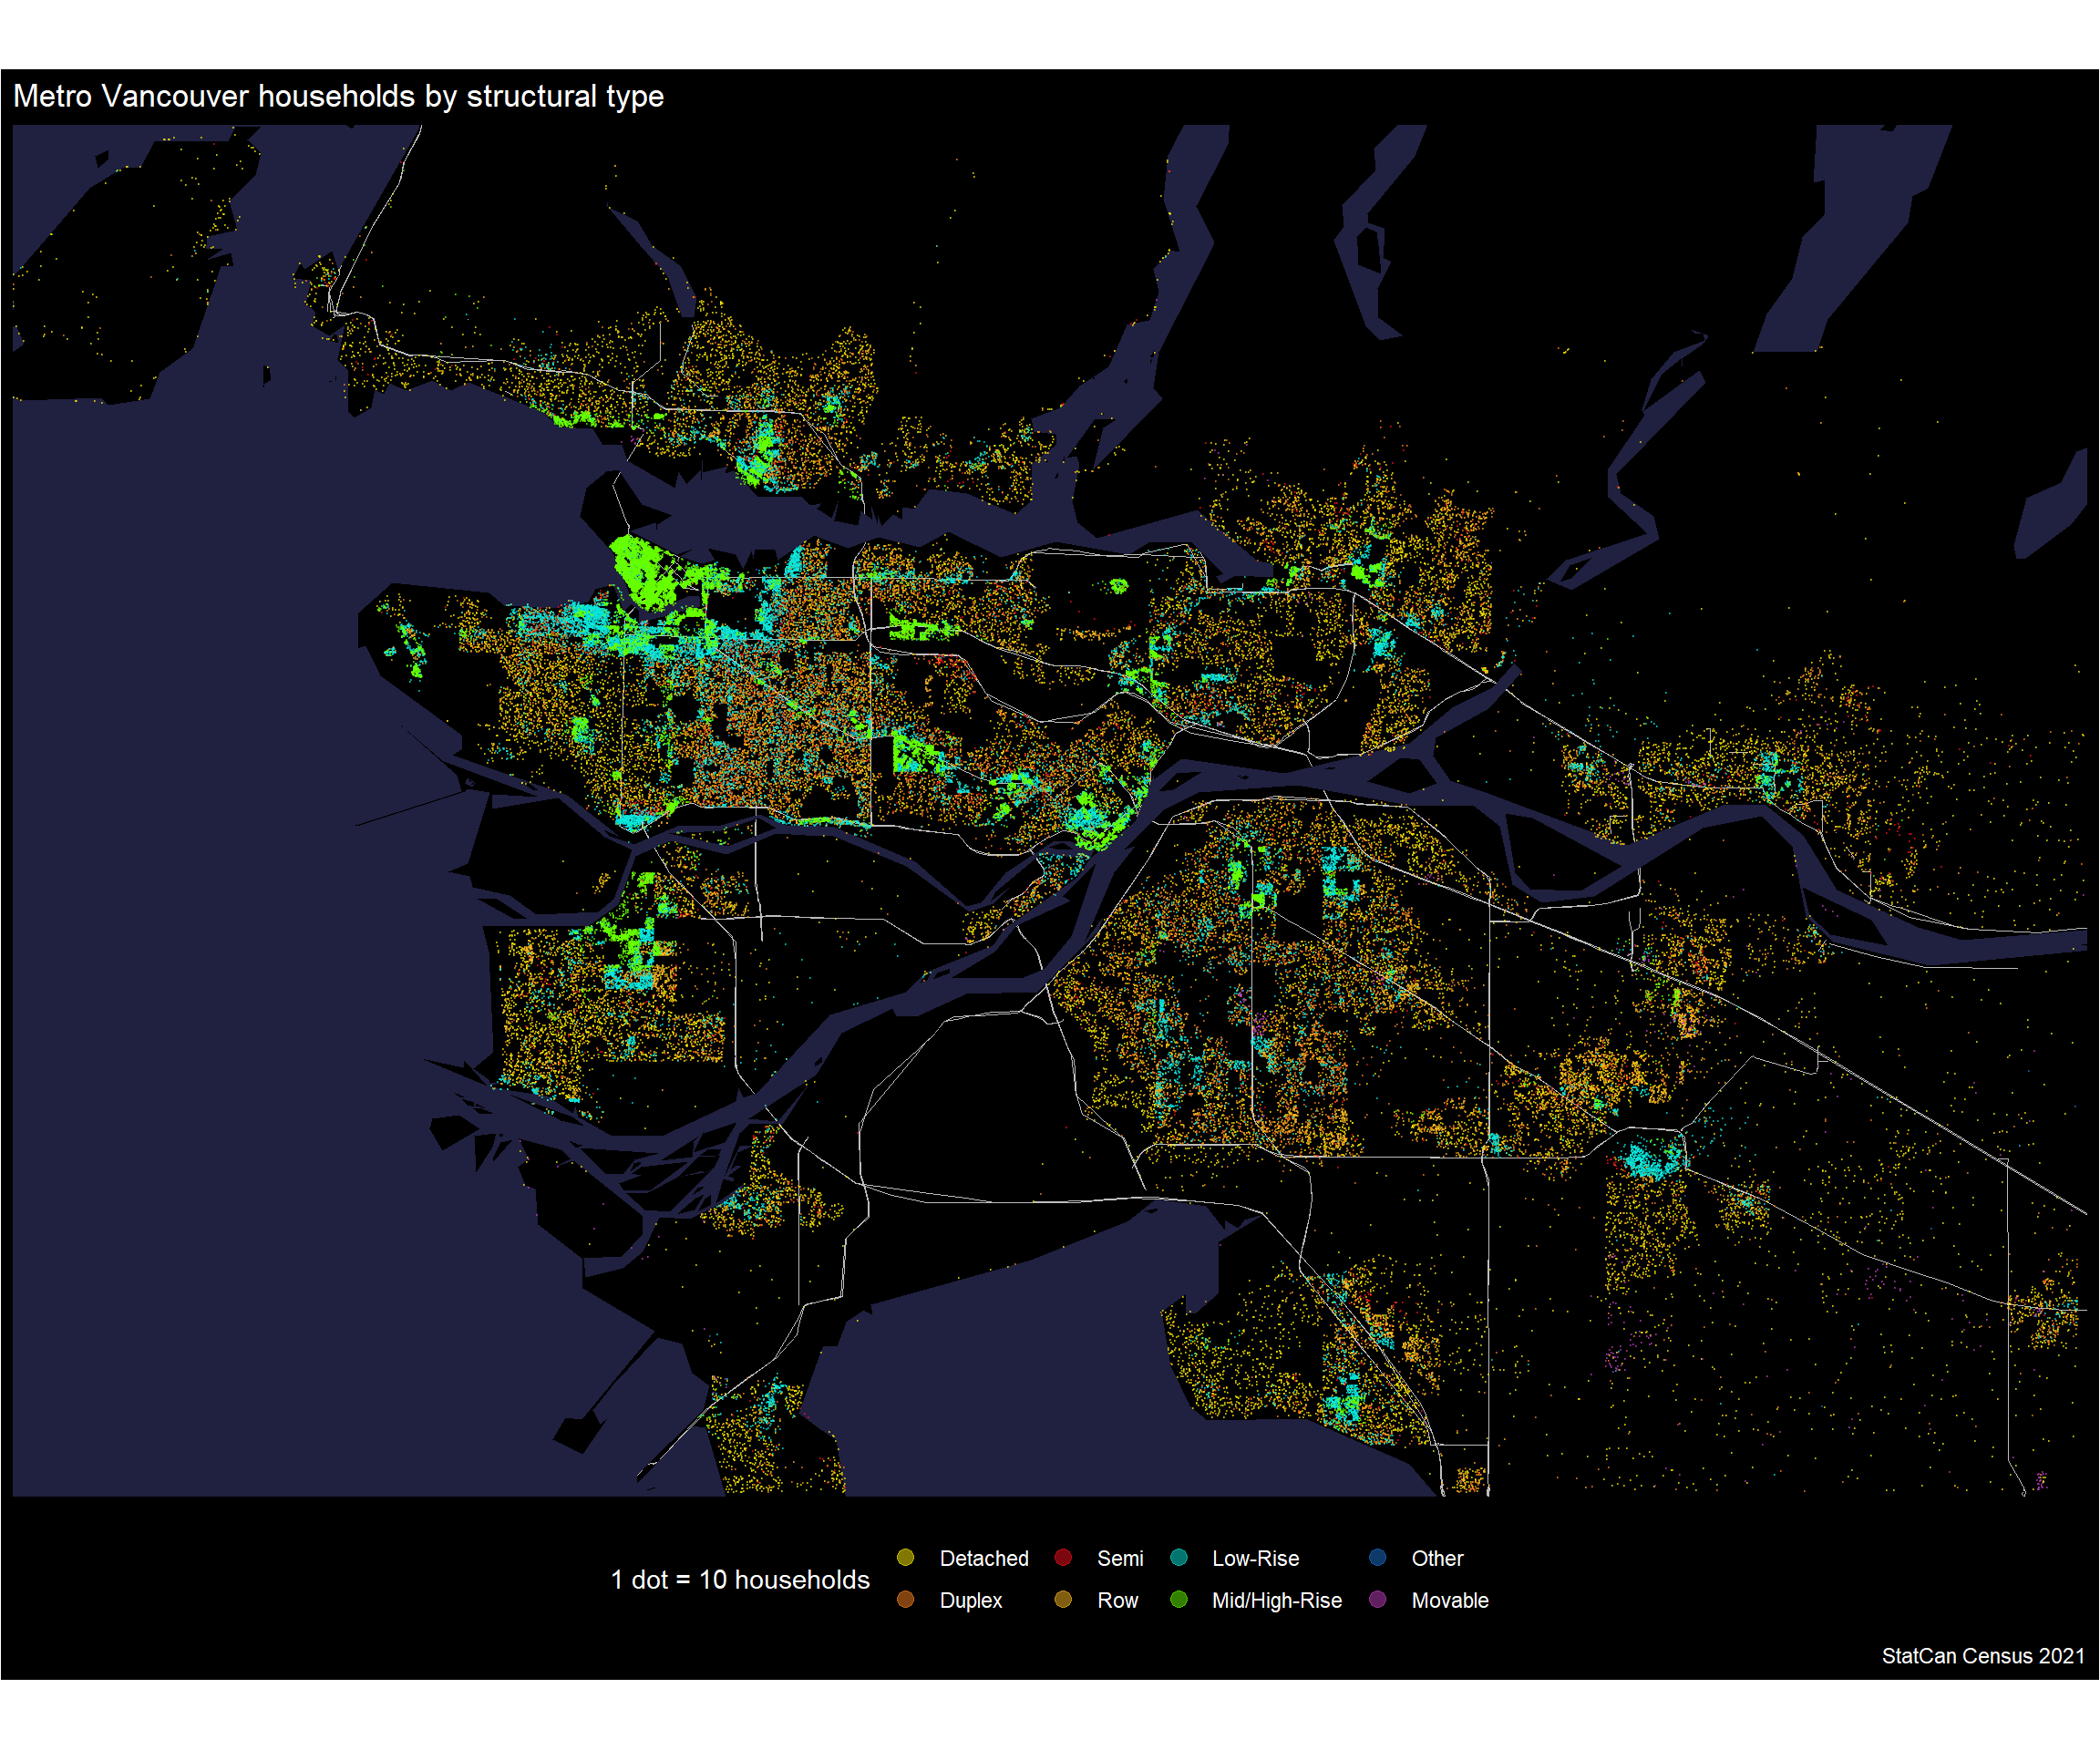
Finally, just because we can, we want to take a quick look at the geographic distribution of households by structural type of dwelling in Metro Vancouver using a dot density map. This is kinda cool, because apartment areas can be pulled out from lower-density detached house and related zoning. But we can also glimpse some townhouse neighbourhoods and even a mobile home park or two! Enjoy!