
What will happen when the Pandemic ends?
Will pre-Pandemic patterns, like people moving to Vancouver, go back to normal? Or will small towns, far-flung suburbs, and rural areas see a boost at the expense of cities, reflecting perhaps a new aversion to density and/or embrace of the rise in telecommuting acceptability? (we’ve seen such speculation in certain corners of City Hall).
Or indeed, might we see the opposite? Will people flock to cities like Vancouver as we return to mobility (including newly amped up immigration along with outreach to Hong Kong) and enjoyment of all the urban pleasures we’ve given up during the pandemic?
It’s all speculation at this point. But it’s got me curious about the past. What happened after the 1918-1919 influenza pandemic? And here I struggle with two things: 1) there was a LOT going on during and prior to the 1918-1919 flu pandemic, making it hard to isolate any response, and 2) the census data skips right around the two key years, with timing gaps too large for zooming in.
I can’t fully fix the overlapping events (WWI, and prior to that a big speculative economic crash), but I can kind of get around some of the data limitations of the Census by playing with some historical data sources I’ve been meaning to give more attention, in particular, the brilliant collection of BC City Directories archived by the VPL, including especially Henderson’s City and Greater Vancouver Directories and Wrigley’s BC Directories.
First, a couple of quick notes about the 1918-1919 Pandemic, brought to you by Margaret Andrews (1977) enlightening research in “Epidemic and Public Health: Influenza in Vancouver, 1918-1919” open access in BC Studies vol. 34. According to Andrews, the Pandemic hit Vancouver especially hard relative to other cities in Canada and the USA. It was also very different from today’s Pandemic in targeting mostly young and middle-aged adults.
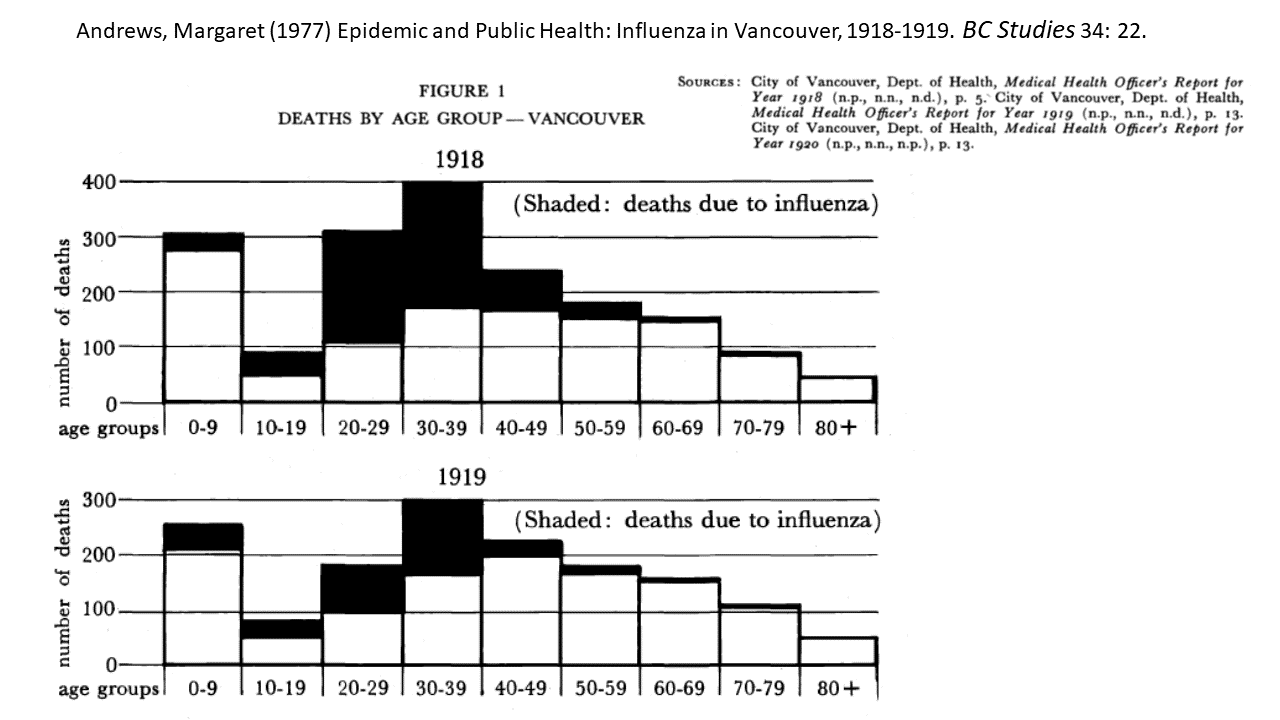
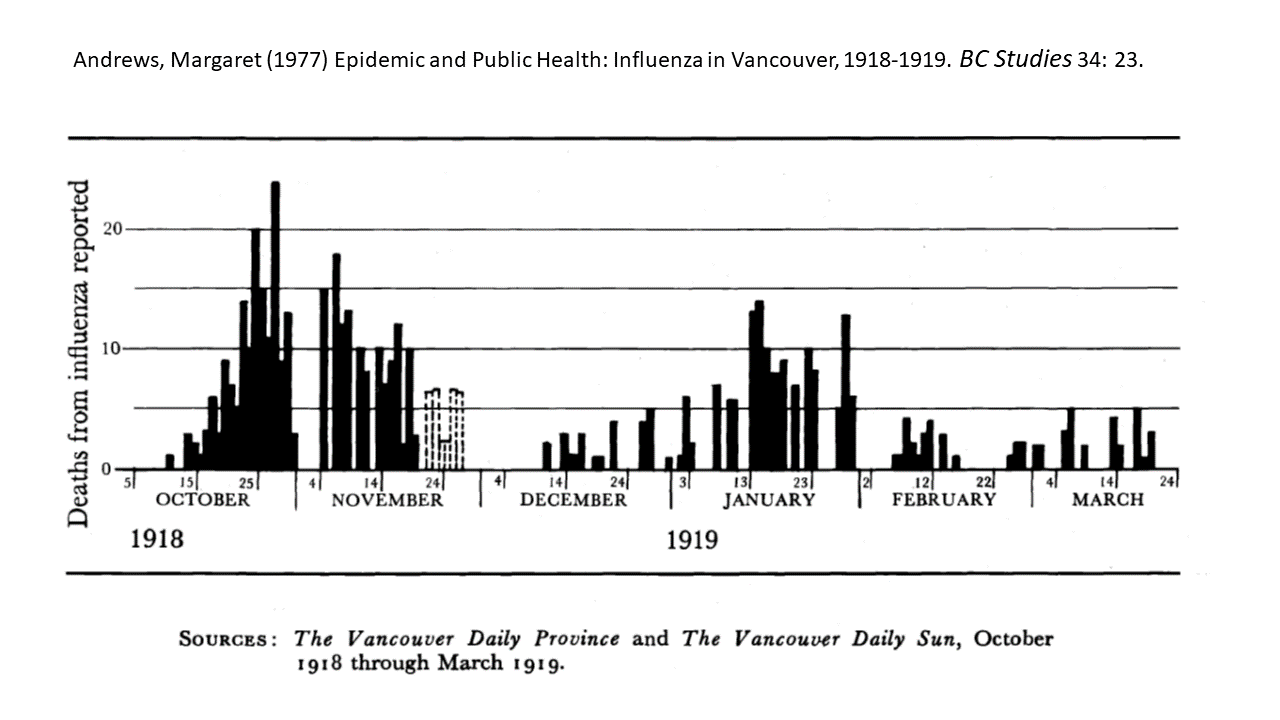
At the same time, it was similar to today’s Pandemic in arriving across multiple waves, though the first (in 1918) took the greatest toll.
So what can we add by looking at City Guides? Well, we can compare them to Census results to get a more fine-grained sense of how the City responded to and potentially bounced back from the Pandemic of 1918-1919. The guides include, especially, the Henderson’s City of Vancouver Directories and related Wrigley’s Guides (which swallowed up Henderson’s in 1924), all providing listings of businesses (and households) across Greater Vancouver. I estimate the number of listings for each year, folding businesses and households together. While this isn’t a perfect match for population, or even households, it provides a relatively consistent method for a fine-grained look at how Greater Vancouver businesses and households together experienced the concentrated events piling up between census years (more details below!)
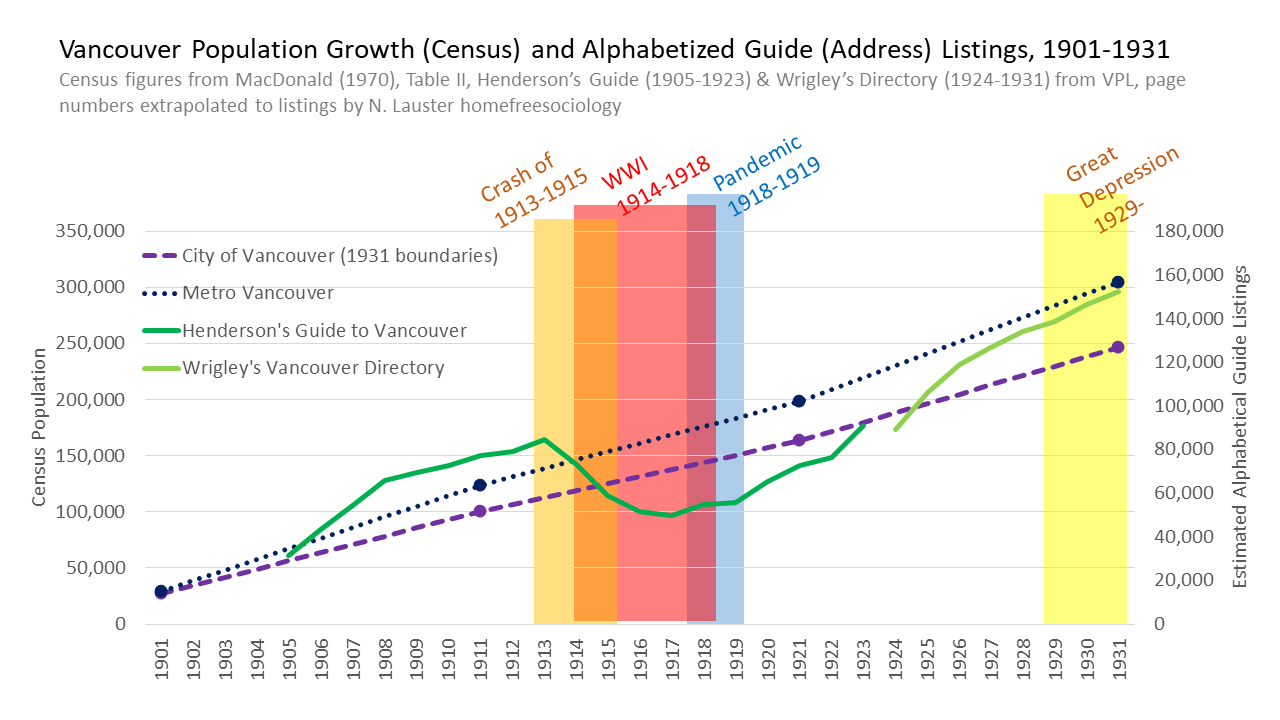
What’s our fine-grained examination of directory listings in combination with census data tell us? It appears we really do miss a lot with census data alone, especially between 1911 and 1921, where we saw a gigantic speculative bubble crash in 1913, followed by the Dominion’s entrance into WWI in 1914, and the Influenza Pandemic itself in 1918.
Where Census data from 1901, 1911, 1921, and 1931 make Vancouver’s growth look relatively steady and nearly linear, directory data demonstrate the enormous upset and losses of 1913-1915 in Vancouver, followed by a bottoming out and start at recovery during WWI (when many otherwise unemployed men went to fight in the war), finally interrupted by effective stasis during the Pandemic of 1918-1919. Then boom! Vancouver was off to the races again, climbing rapidly in listings from 1919-1923 and again (jumping different guides & methods) from 1924 seemingly only slowing a bit in 1926. From there, the trajectory of growth seemingly carried right through the beginnings of the Great Depression to 1931, when the next census was carried out.
Is past prelude? If so, Vancouver looks set to recover quite spectacularly from the Pandemic once it ends, as people flock back to the joys of the city. Maybe we’ll get our own Roaring 2020s!
But of course, for now we’re still here in the middle of the damn thing. So I’m still singing “Come On Vaccine.”
You know the tune…
APPENDIX
A couple quick methods notes for my beloved nerds. Historical census data was taken from Norbert MacDonald’s “Population Growth and Change in Seattle and Vancouver, 1880-1960” from Pacific Historical Review 39(3): 297-321 (unfortunately paywalled). MacDonald combines South Vancouver and Point Grey into the City of Vancouver boundaries for 1921, but I believe he considers the populations of these municipalities effectively too low to matter in earlier years. Henderson’s Directories were released on a yearly basis with a pretty standard, two column format, from 1905-1923, and seemingly covered all of Greater Vancouver during this time, with listings showing up in North Vancouver, New Westminster, and Burnaby, for instance (though North Vancouver was sometimes also reported separately). Ads were placed somewhat randomly within the text, rather than as full pages. In 1924, the Henderson directories were absorbed by Wrigley’s directories, using a new three column format (and smaller type) with interspersed full page ads. I attempted to estimate the listings for each year of these two different sources by gathering page numbers for alphabetized listings (of resident households and businesses) and multiplying by an estimate of the number of listings per page, excluding full page ads where possible. I estimated ~95 listings per page for Henderson’s and ~184 listings per page for Wrigley’s, based upon a quick count on what seemed representative pages (the second A listings), but this estimate could certainly use further checking.
