
After my talk at the Vancouver Historical Society, I’ve been playing around with some of the old fire insurance maps for Vancouver. As it turns out, fire insurance maps are super-awesome resources for historical research. Here I want to explore ways of using them to visualize succession as an urban process.
Succession, meaning the gradual outward expansion of an urban core, was thought by many observers of the early 20th Century to be the key process driving neighbourhood change. For sociologists like Ernest Burgess and Roderick McKenzie, succession was a process of “invasion” from the centre outward through a series of concentrically organized ecological habitats. The central business district (Habitat I) was always attempting to move into the surrounding industrial and commercial areas (Habitat II), which in turn were always invading the areas of dense working class housing beyond (Habitat III), which were always trying to muscle in on the middle class and wealthy residential suburbs on the outskirts of the city (Habitat IV).*
“Succession” was a science-y and neutral sounding concept (having been drawn directly from plant ecology), while “invasion” was quite threatening, especially to the middle class and wealthy suburban neighbourhoods hoping to hold the urban core at bay (very much including its working class & minorities). With the invention, legalization and rapid spread of single-family detached zoning, the middle class managed to mostly surround and contain the urban core, as I describe in my recent talk and book. As a direct implication of halting the process of urban succession, constrained urban cores mostly grow up instead of out, and now we mostly talk about gentrification instead of succession as a key process affecting our cities.
But let’s go back to succession. Can we see it in action? Let’s start with an early residential development consisting of two blocks (subdivided by alleyways into six) on the outskirts of a rapidly growing city in the late 19th century.
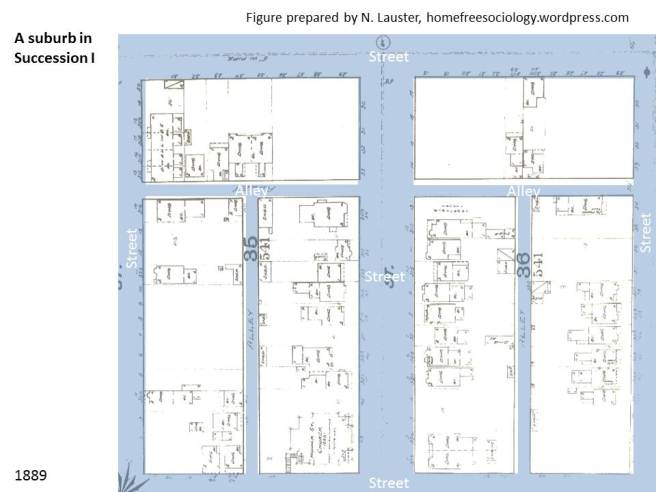
The base layer here is an old fire insurance map from the Vancouver archives, though I’ve faded it out a bit to draw over top of it. Let’s highlight all of the houses.
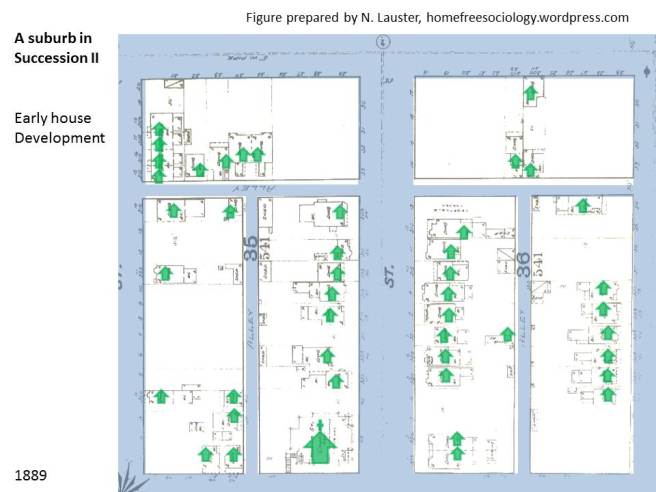
We can see this is pretty much just a residential neighbourhood at this point, with the only non-residential use a church (lower-left). Most of the other buildings are sheds. But wait a minute, are these all single-family detached houses?
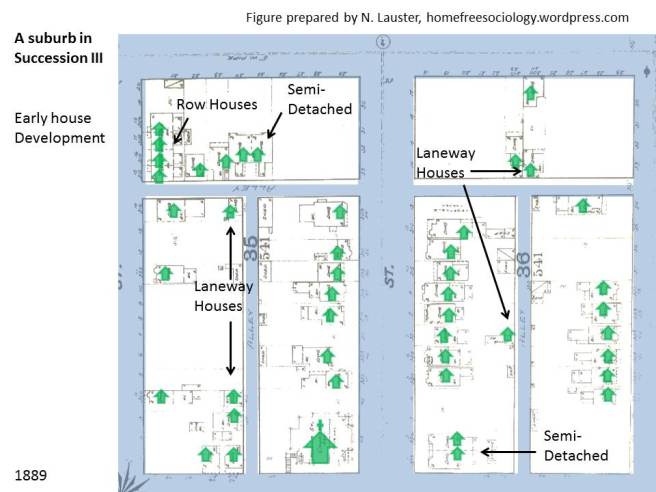
Trick question! Those weren’t invented yet! So nobody was recording whether or not single families lived in these houses, nor how they might have been subdivided. That said, it’s clear that four houses in the upper-left block were all connected to each other, making them recognizable as rowhouses. Meanwhile, there were at least two houses connected side-by-side on other lots, making them semi-detached houses (by modern Canadian census categories). Also notable: at least four lots had both houses fronting onto major streets and houses fronting onto alleyways – with the latter now identified as “laneway houses” in Vancouver. Lots of “missing middle” housing!
Importantly, these residential blocks were located on the outskirts of a growing urban core in 1889. What will become of them? Let’s jump ahead 25 years and see…
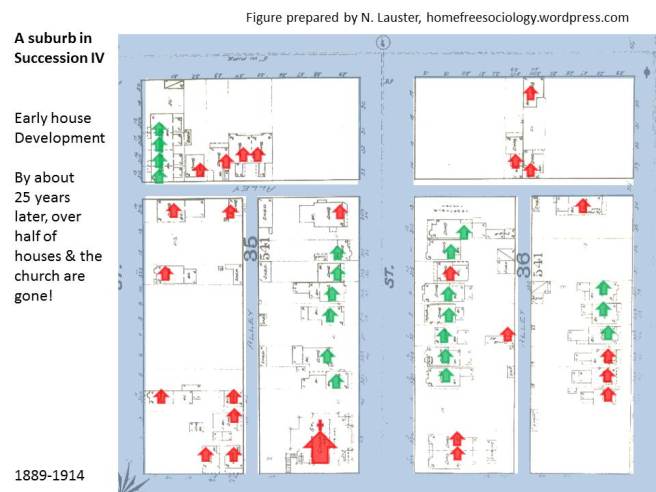
I’ve highlighted in red all of the buildings that disappear over the course of 25 years. Oh no! There goes our church! Over half of the houses are also gone. Devastation in Habitat IV! But at least the townhouses remain. Let’s fill in the neighbourhood…
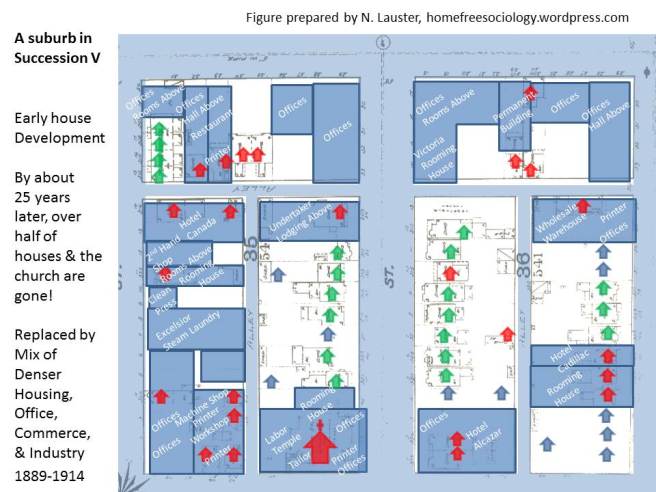
Some of those old houses remain, and new ones have been added too, meaning that we don’t see a complete replacement of seemingly middle-class residential uses (Habitat IV). That said, for the most part torn-down houses have been replaced by much larger buildings that take up their lots and add abundant industrial, commercial, and office uses to the neighbourhood. At least three hotels (Alcazar, Cadillac, and Canada) join numerous rooming houses, with the latter being an especially important source of housing for the working class and poor (Habitat III). Industrial uses (machine shop, workshop, numerous printers, warehouse) also crowd the block, along with commercial uses and services (second-hand shop, steam laundry, tailor, restaurant). There’s even an undertaker with lodging above! Lots of what Burgess termed a zone in transition (Habitat II). And offices… so many offices. We can make a strong claim for central business district uses (Habitat I). In effect, the entire urban core has moved into a former middle-class residential district over the course of 25 years, give or take, without completely destroying it. On a first pass, pre-zoning urban succession looks more like urban mixing than invasion and replacement. But maybe we just didn’t give it enough time.
What does this marvelous neighbourhood look like now, some 100+ years later?**
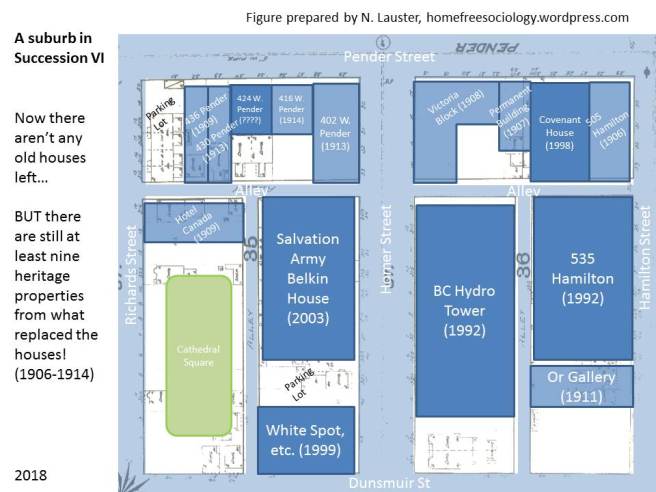
It looks like the two blocks bounded by Pender, Hamilton, Dunsmuir & Richards, right smack in downtown Vancouver. The 19-story BC Hydro Centre Tower dominates these blocks. But remarkably, at least nine of the old buildings that replaced the original houses in the neighbourhood during the 1906-1914 era remain intact! Alas, the townhouses in the upper-left have been replaced by a parking lot. Overall, the neighbourhood still has a mix of low-income housing, commercial and service space, and office space, though probably not a lot in the way of middle class housing (have to seek out some condos nearby for that).
I grabbed the dates on all the buildings I could find from VanMap‘s Assessment data. Old Fire Insurance Maps can be found in the Vancouver Archives.
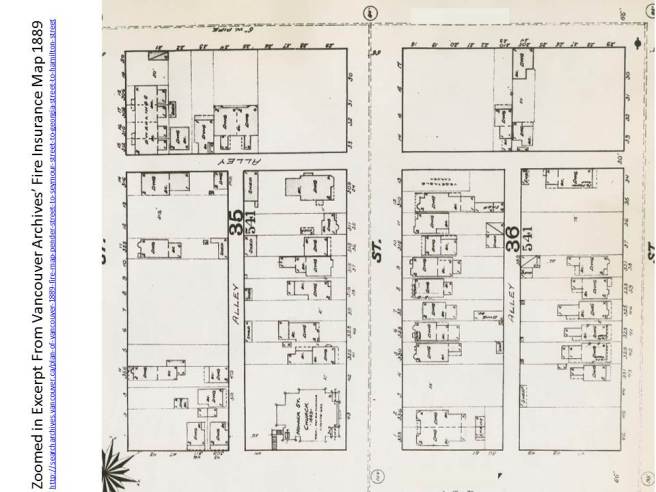
Here’s the Fire Insurance Map from 1889, with zoomed in panel below:
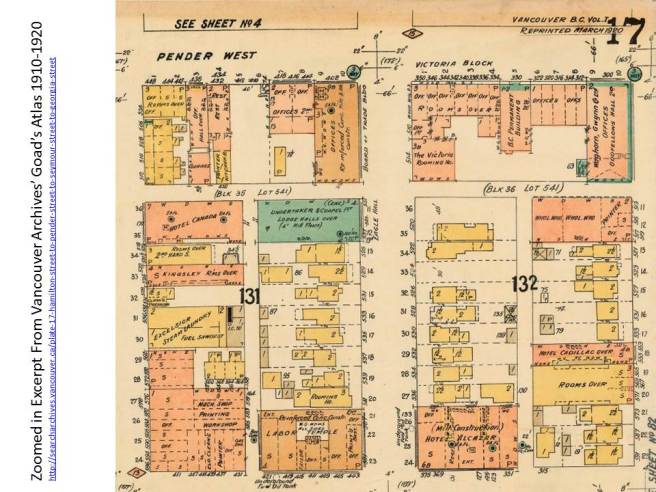
Here’s the Goad’s Atlas Map from 1910-1920, with zoomed in panel below:
This is a first-pass, of sorts, at drawing upon Vancouver’s old fire insurance maps to get at patterns of urban succession in the days before zoning. I’d welcome suggestions, collaborations, and better visualizations! (This was pretty much all done with powerpoint on the fly). In the meantime, here’s my cheap-o little animated gif of the slides above. Enjoy!
*- The Chicago School of Sociology modeled this process on Chicago itself – though McKenzie, it should be noted, also detoured to Seattle in describing “The Ecological Approach” to the study of The City (1925), in a volume for which Park & Burgess are usually given first billing.
**- The maps date from 1889 and somewhere between 1910 and 1920, which is why I say “give or take” in assessing the length of time that’s passed! Though the Goad’s Atlas dates itself as 1910, it was reproduced (with consolidated updates) in 1920, and includes buildings up to at least 1914, which is why I can narrow it down to around 25 years after 1889.

Wow, this is really interesting! Amazing how corporations are able to just take over residential areas like that.
LikeLike
Vancouver Public Library has digitized City Directories from way back. In PDF, TIFF and JPG form.
They are indexed by streets, and surnames.
http://bccd.vpl.ca/
Burnaby was listed in the Vancouver section, and in New Westminster in other years. Be creative.
One quickly realizes that depending on who answered the door(s) the answers would differ from year to year. (Try Chinatown for examples).
City Directories claimed that being listed was a civic duty, and would verify a person’s residence in the days before private phones and their phone books. Thus they could be used as a form of ID
LikeLiked by 1 person
VanMap has the Goad 1912 Fire Insurance map corrected geographically.
The Henderson Directory of 1912 lists Mrs. Lena Crofton at 526 Homer, etc. and the Church of England Chinese Mission at 666 Homere….
LikeLiked by 1 person