Progressive Property Taxation: Good Policy, Bad Sales Pitch

I’ve been away from blogging, in part due to various end-of-semester teaching and publishing tasks, and in part due to a minor obsession with US political developments. (And really, who isn’t at least somewhat obsessed by US political developments? But more on that in a moment.)

At any rate, I’ve been thinking a bit about taxes. Specifically property taxes. It’s striking to me that Vancouver has such really, really low property tax rates. This is most true in terms of actual property tax rates, with Vancouver’s at a low, low 0.35%, but it is still true even after accounting for Vancouver’s very high property values, resulting in low overall property tax payments. See relevant Canadian comparisons here and here. To look up (somewhat dated) US property tax data, see the Tax Foundation, or this report on average property taxes at the state level, where we learn that if Vancouver was a state, its tax rates would place it lower than every other state save for Hawaii. In case you’re wondering, the City provides a helpful description of how property taxes are calculated, and also a sense of where the money goes.And you can find comparative data for all BC municipalities here.

So Vancouver pays low taxes? So what? On an everyday basis, doesn’t that help make up for the extraordinarily high costs of real estate? Property taxes are a drop in the bucket compared to the local costs of buying a home, and if they were raised it would only make buying even more expensive and out of reach for locals. Unless…

  • Low property taxes were fueling high prices
  • Money raised from hikes in property taxes could be given back to local buyers and/or set aside to support more affordable housing options

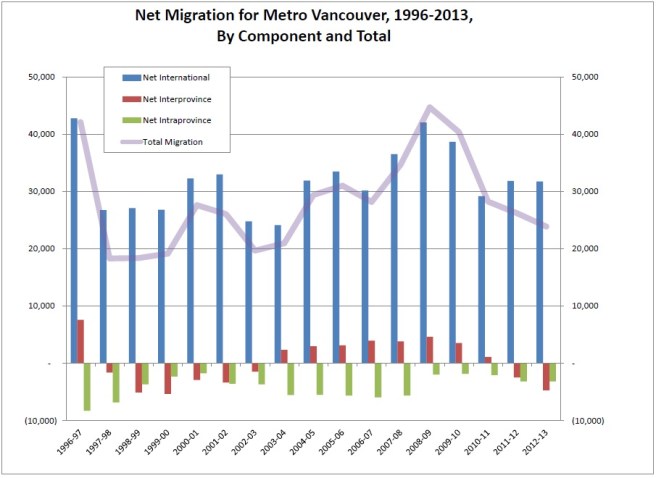
Low property taxes make it ridiculously easy to park money in Vancouver real estate as an investment, and there is a lot of money flowing into property across the metropolitan region. Real estate is an enormous driver of the local economy. But overall, incomes remain relatively low in Vancouver. So there’s a very good case to be made for re-balancing taxes away from income and toward property.

But inequality has also been on the rise in Vancouver, as elsewhere. Income taxes are progressive, falling more heavily on the wealthy, while property taxes are flat – every $1,000 in property is taxed at exactly the same rates. So a re-balancing away from income tax and toward property tax could be regressive.  But why not tax property in a progressive fashion?

One suggestion is that property values over $1 million get taxed at a different rate than values below, with other progressive increases at higher cut-off points.

For example, the threshold for paying any surtax could be set at $1 million, with an initial rate of one per cent on the value above that, rising in steps to three per cent on values above $3 million.

To be clear, in this proposal owners would only be taxed upon the portions of their property value above the cut-offs. (i.e., someone owning a $1.1 million house would only pay the progressive tax on $100,000 of the value of their home). This sort of a progressive property tax could have many positive effects.

A progressive property tax could cool down the local property market, especially at the high end, where it’s been most overheated. At least some of the tax could be offset against income taxes, resulting in an entirely sensible re-balancing of tax burdens reflecting the low income levels relative to high property values in the region. Some of the tax could also be set aside to support more affordable housing locally, by, for instance, supporting more housing cooperatives.

I like it!

Elaborated variations on this kind of fiscal policy tweaking have been suggested by  a team of economists (mostly led by Tom Davidoff) at both UBC and SFU, who offer a more flat-tax version attached to a housing affordability fund, and Rhys Kesselman and Josh Gordon (at SFU), who bring progressivity to the initiative and are quoted above. These are both worthy policy proposals (though I prefer to combine their best elements, bringing together the Housing Affordability Fund with the tax progressivity).

So what’s not to like?

Mostly the sales pitch.

As I mentioned at the outset, I’ve spent too much time watching the US election play out. I’ve also been following the rise of right-wing, xenophobic parties across Europe. I’m not so afraid of Trump (I really don’t think he’s going to do very well in the general), but his xenophobia and racism has proven far too popular for my taste. So popular that even the nice, elderly barber who cut my hair the other day here in Vancouver expressed approval of Trump (and he was an immigrant!).

It’s why I found this headline so heartbreaking:

Foreign buyers crushing Vancouver home dreams as governments do little: study

Yet this was the headline the Canadian Press (and/or CBC) chose to go with in announcing Josh Gordon’s recent policy paper. And this was the spin within the policy paper itself on why we need to re-balance toward a progressive property tax. It’s clear from a close read that most authors of various new property tax proposals direct their ire primarily at government inaction (looking mostly at you, Christy Clark). But who is it we’re most obviously directed to see “crushing” our “dreams”? Foreigners. Needless to say, one needn’t go far in the comments section of the article above to find praise for Trump and outrage directed at foreign buyers (“Ban them and confiscate their property!”).

There needs to be room here to support good, progressive policy without whipping up anger at foreigners and immigrants (who are too often conflated, in part due to the complexities of the transnational world we are living in). This is not to deny that money flowing into Vancouver, quite often (though not solely) from China, is driving housing costs, especially at the luxury end of the market (which in the City of Vancouver, let’s face it, includes all single-family houses). I don’t think that’s really in dispute. There’s a lot of money coming in to Vancouver real estate from China. But that money is here because the city and provincial and federal governments have all invited it in at various times in pursuit of common “growth machine” policies. There are good reasons to change some of these policies and I welcome that discussion as well as many of the policy proposals kicking around these days. There are not good reasons to demonize folks who’ve accepted so many of our governments’ invitations as “foreigners,” nor are there good reasons to “ban them,” or “confiscate their property.” That’s been tried before. It’s not the Canada I want to live in. But then, I’m an immigrant.


(Yet More) Changing Migration Profiles

By popular request, I’m posting a snapshot of net migration profiles by age across four time periods for both Metro Vancouver and the Vancouver School District (encompassing both the City of Vancouver and the University Endowment Lands of UBC to its immediate west).  The comparison allows us to see how Vancouver, as a central city, relates to the wider metropolitan area in terms of net migration.  But I’ll also walk more carefully through the steps I’m taking to come up with the figures.  Let’s start with the big picture (click here to make it bigger!).

VanCityMetroNetMig1986-2015

Here I’m comparing net migration figures by age groups (aggregated for simpler presentation) across four time periods for both the Vancouver School District and the metro area.  I toyed around with how to present the data, and went with the Vancouver School District net migration figures in color, and the corresponding metro figures in white.  Of note, and as previously demonstrated, the metro area is growing across nearly all age groups in all time periods.  Only amongst older residents, in their fifties and above, do we see evidence of possible out-migration (and I’d be careful about interpreting this).

For the Vancouver School District (VSD), contained within the metro area, it’s a different story.  Young people, especially of university age, FLOOD into the VSD.  They keep flooding through their twenties, but as they move into their thirties, the flood starts to recede.  As people proceed through their mid-thirties (in red), more of them leave the VSD than enter.  This is a relatively common pattern for central cities, as many thirty-somethings decamp to cheaper and more spacious suburbs nearby.  As visible from the metro stats, more thirty-somethings continue to enter the Metro Area than leave it, even though that’s no longer true for the VSD.

All that said, the historical comparison is interesting!  In relative terms, it looks like Vancouver saw a ramping up of the usual exodus of thirty-somethings between 1986 and 2011.  But in the most recent five-year period, the exodus has slowed again.  Relatively fewer thirty-somethings are fleeing the VSD now than was the case in the previous five-year period.  I’m not sure how much to make of this pattern, but it’s intriguing.

As for the flight of the Millennials, I’m still not seeing it.  Not for Metro, and not for the VSD.  But maybe that’s just because I think of Millennials as the fresh-faced twenty-somethings in my classes now, rather than the dour thirty-somethings of my classes from ten years ago.

How to do it yourself

As with the net migration profiles I ran yesterday, I’m using  BC Stats data from their population estimates.  For Metro data, I’m selecting “Greater Vancouver” from Regional Districts available.  For the City, I’m selecting “Vancouver” from School Districts.  In each case, I use the five year age categories, totaling across both sexes, and I select all years available.

The five year age categories match nicely with five year time comparisons.  Setting aside death and migration, if I knew how many people were ages 5-9 in 1986, then I’d also know exactly how many people would be ages 10-14 in 1991.  But people die and people move around.  To take the former into account, I age everybody five years.  I do this by finding reasonable age-specific mortality rates to apply. This time I chose 2008 mortality rates for all of Canada.  But these rates are worth playing around with; choose your own games to play with death!   Different rates can have sizable effects for older populations, though they won’t matter much for the young.  For good measure,  I killed people off for three years using rates from their starting age bracket, and two from their receiving age bracket.  Then I subtracted how many I had left from my 1986 population from how many people actually showed up to be counted in 1991.  Voila!  The remainder is my estimate of net migration.  Given that most of that migration presumably takes place during the intervening years, I’ve labeled my estimates by mid-ranges, like ages 7-12, centered between 5-9 and 10-14.  There are ways to tinker with this to try and be even more precise, but this exercise should provide a decent estimate of net migration (especially given remaining uncertainties I have about data quality).  If you’ve read this far, you should download the data into a spreadsheet and try it out!

Ch-ch-ch-changes in Vancouver’s Net Migration Profile by Age

The other day I noticed data on Bloomberg that I hadn’t seen before, purportedly showing millennials fleeing Vancouver.  What the data actually seemed to show was a declining net gain in Millennials, along with a loss of those in the 25-44 age range.  This didn’t match with what I thought I was seeing in the Metro data for 2006-2011, though perhaps it tracks the data for the City of Vancouver (still looking into that).  As is often the case, there is a frustrating lack of specificity about just what constitutes Vancouver, with Demographia affordability measures reflecting the whole metro region, but the City referenced in terms of local policies (and likely migration data).  Then we get an anecdote about someone moving out of Squamish, treated as a “suburb 45 minutes away from Vancouver” and hence reflective of its market.  All that said, I was just as interested in how the piece pointed me toward BC Stats data on population estimates broken down by age (which I’m assuming is where Bloomberg’s data come from).  Which is great!  Let’s play with that data.

The data are different than what we get from the Census.  Based on this document, it seems they are compiled via administrative data sources, including health data and hydro hook-ups.  Other datasets also mention tax records.  At the moment, I’m not certain where the age breakdown comes from, but it’s interesting.  Comparing the population by age estimates from BC Stats with the Census estimates by Census years (2006 & 2011), it would appear that the BC Stats data systematically finds more people overall in these years, especially more young people (ages 0-49, peaking for 10-13% more 25-29 year olds), though slightly fewer old people (age 85+).  Given known census undercount issues, I’m not sure which dataset should be viewed as definitive on this account, but the comparison is super-interesting!  Wish I knew a bit more about where the BC Stats yearly estimates by age come from.

At any rate, I can calculate net migration rates for 5-year age groups using the BC Stats data that run from 1986 all the way up to 2015.  I’m going to ignore adding estimating how many babies we add via net-migration each year, and focus on kids already born.  I’m going to age them forward five years, killing off a few along the way according to 2009 age-specific death rates (averaged across age groups), and I’m going to identify them (this time) by their ages in the middle of the age groups identified at either end of the five year period – on the calculation that this is where most of the migration is taking place.  Here’s what I get, allowing us to compare age-specific net migration profiles for successive five year periods from 1986 all the way to 2015.  (Update: larger image available here)

NetMigAgeProfilesMetroVan

A few things are interesting here.  For one, I’m still seeing the same pattern, extending beyond 2006-2011, where net migrants at (nearly) all ages continue to enter Metro Vancouver.  Over all periods, the big gain in net migrants comes for university-aged young adults, but extends through thirty-somethings and even forty-somethings.  I certainly don’t see Millennials fleeing the area, nor are we losing our lifeblood, as far as I can see (colored green in all years).

In fact, in the latest period, 2010-2015, the one exception to growth across all age groups, which you can maybe just barely make out if you squint, is a net loss of migrants in their mid-50s.  But even this is an improvement over much higher net loss of those in their 50s from 1997-2011.*  What to make of the turnaround in the net migration of older residents, in their 70s and 80s?  Honestly, I’m not sure.  This may be an artifact of using 2009 age-specific mortality rates, so that it looks like we lost a lot of older residents back in the 1980s and 1990s to out-migration, when in fact they just died more often than estimated.  If so, it’s evidence of real progress in life expectancies at older ages!  But it’s still notable that now there is plenty of room for people to grow older in Vancouver, and they seem to be doing it.


*- comparing to net migration figures from the census, where we don’t see losses of fifty-somethings, I wonder if part of the story about those in their 50s is systematic overcounting of youth and undercounting of older residents in the yearly estimate data (or the reverse in the census data).

Me, You, and Everyone We Know

Today I inquired of my Sociology of the Life Course (300-level) students: How many Canadian adults (ages 25+) have University degrees (Bachelor’s or higher)?

Their starting estimate was close to 80%.  From there I took descending bids, like a backward auction, until I had guesses of 72% and 60%, with one brave soul going as low as 40%.  Then I revealed the estimates from Statistics Canada.  And that’s when I heard an audible *gasp!* (it made my day, really).

As of 2009, the figure was THIRTY-ONE PERCENT.  And that’s only for 25-39 year olds (it would be much lower if we included older folks).

I can sympathize with my students here.  I actually have kind of a hard time absorbing this figure myself.  I keep checking and re-checking it against census records.  Why are my students so wrong?  Why am I so skeptical?  I’d suggest it pretty much comes down to exposure.  When me, you, and (almost) everyone we know has a university degree, we tend to take the next step of generalizing to all of Canada.  “After all, if everyone at UBC has or is getting a degree…”  Yeah.  It doesn’t work that way.

The Statistics Canada estimates are also cool for another reason.  They contain information about parental degree attainment.  And it really, really matters.  More than half of children who have at least one parent with a university degree will also earn a university degree.  Fewer than a quarter of children without a university graduate for a parent will earn a degree.Canadian-Univ-Degrees

This (in conjunction with reading the much-cited work of American sociologist Annette Lareau), helps establish how social reproduction works.  And the students get it.  They just don’t necessarily get, until it’s put in front of them, how small the university educated middle class is.  Or how exceptional their own experiences are.  And why should they?  They’re surrounded by other people just like them – at least in the key respect of educational attainment.  What’s more, me, you, and everyone they know also usually extends to their parents.  Most of them have university degrees too.

Bringing Anecdotes to Data Fights

Don’t Bring an Anecdote to a Data Fight.

So goes the meme, and it’s funny.  In a nerdy sort of academic way.  But is it good advice?

All good data fights are about competing stories.  For instance, there’s a prominent local story suggesting people are leaving Vancouver in droves over high housing costs.  Transforming this into a data fight, it quickly becomes apparent that more people are arriving than leaving – a severe blow to the story.*

But maybe it’s not all people we’re worried about – it’s the lifeblood of Vancouver that’s leaving.  People in their thirties and forties, whose careers are just taking off, but who can’t maintain a family in the tiny hell-holes this city provides.  The data actually tell us that, at least across the Metro Area (where we might expect “lifeblood” to have a useful meaning), more people in their thirties and forties are coming than leaving, it’s just that they often end up in the suburbs rather than the central city.

The data fight can keep going on its own (and I expect it will).  The stories continue to evolve accordingly.  But there’s another response to this sort of data, which goes something like:

Ok, but some of my friends have left.

This was, in effect, one of the comments I received over my recent posting about migration trends.  The standard response, of course, would be “Don’t Bring an Anecdote to a Data Fight.”  But I actually appreciate the comment, and now I’m kind of wishing I’d followed up on it by asking for more details.  Why?  I actually think it can be very valuable to bring anecdotes to a data fight.

A couple of years back, I remember first coming across news stories about people fleeing Vancouver because of housing prices.  (Ok, maybe even more than a couple of years.  I’m getting old, too old to go back and track them down).  What was striking to me about so many of these stories was the lack of verification.  When pressed, our dearly departed often described their moves more in terms of great new job opportunities, or desire to be closer to family, than in terms of housing costs.  This isn’t to say housing costs weren’t and aren’t a factor in many moves.  Indeed, they show up as a (relatively) common reason for moves provided when people are surveyed about why they move (see here for a report from the USA).  So I’d be surprised to find no one leaving Vancouver over housing prices.  But for the same reason, I’m often struck by how difficult it is to establish these kinds of motivations, even using anecdotes.  Clearly we could do a better job tracking movers in Canada!

But back to anecdotes: of what use is an anecdote in a data fight?  Let me count just a few of the uses:

  1. The absence of anecdotes can be telling.  If you’ve put in a good faith effort and you can’t find an anecdote that resonates to a story of interest – one you’re trying to tell, or one you’re reading – then maybe the story just doesn’t work.  Even if the data seem compelling, if I can’t find place a particular and unique instance where the relationship they purport to show actually works, I’m going to be very skeptical.  And I should be.
  2. Anecdotes can provide examples of the complexity that necessarily pertains to how well data stories might work in the real world.  For instance, they might show a story works in some circumstances, but not in others (which can help drive further data fights).  I’m very interested in anecdotes that help differentiate the people leaving Vancouver from those arriving.
  3. Put slightly differently, but in an important way, anecdotes sometimes remind us about underlying heterogeneity.  Data fights are usually about trends, averages, average effects, and correspondingly dominant story lines.  But that shift is important – averages mask differences.  We should be very careful about allowing one story to dominate others if we can establish cases where alternative stories fit best.  Anecdotes that remind us of this serve an important purpose.
  4. Anecdotes can call into question the validity or reliability of data.  This works best not by drawing upon a few counter-examples that call the story being told by the data into question (there are usually already baked into the data), but rather by drawing upon a few examples that call into question how the data were collected and/or interpreted.  In other words, tell me that you have friends who have left Vancouver and it won’t change my basic understanding that more people are coming than leaving.  But tell me that you have friends who left Vancouver but were still counted by the Census as being here, and I’m going to want to know more.
  5. Anecdotes remind us, often in emotionally resonant terms, how important (or unimportant) some data fights might be.  Indeed, this is one of the frustrations of many quantitative social scientists: sometimes a good story is far more compelling than all of their carefully assembled data.  Bringing anecdotes to a data fight can help sell the importance of the data exemplified by the anecdote.  Politicians know this.  Social scientists should too.
  6. When drawn from a data set, anecdotes also offer a way to check the data, making sure it works how we think it works.  Often this is the glory of mixed methods – qualitative & quantitative – kinds of analysis.  I don’t want to wade into any data fights without checking a few of the anecdotes contained within my data to make sure they make sense.

Anyway, the long and short of it is: please bring your anecdotes to your data fights.  Especially if it’s a fight with me.  I want to see them!  And I want details!


Zika: textbook case of a spurious relationship? (updated)

As I noted earlier, most stories about Zika have failed (utterly) to contextualize the crisis with the numbers and risks involved.  To be fair, that’s because they haven’t been all that well known.  As the facts on the ground become clearer, it’s starting to look like a very different story.  Here’s where we started:

  1. mosquito -> Zika -> microcephaly.

Now we have a new suggestion that the real relationship is more like this:

2. mosquito -> larvicide -> microcephaly

If this is borne out by more investigation, we’ve got a textbook case of a spurious relationship on our hands.  And also a new cautionary tale about mucking about with the environment. What would happen if we took relationship one to suggest the need for even more larvicide?

Still early days, but this is a striking turn of events, and so far seems like a much better fit to the data.

* Update * This from the Guardian strikes me as the best media-related commentary I’ve seen so far.  There remains plenty of uncertainty, but the hysteria around Zika has been way overblown.  In the public health world, this seems to be largely due to international failures around dealing with the Ebola outbreak from 2014, which appears to have killed around 11,316 people (a recent update providing data on the 2014 Ebola crisis was just posted by the CDC a few days ago, which gives us an idea of how long it tends to take to develop a relatively clear picture of what’s happening with world health crises).  Below, widely varying estimates of the number of suspected cases of microcephaly in Brazil depending upon the criteria used, as published in The Lancet.Victora-et-al-2016-MicrocephalyEsts**Further update: still evolving, but many are raising substantial doubts surrounding the Pyriproxyfen (larvicide) explanation.


Is the Lifeblood of Vancouver Leaving?

The rising unaffordability of housing is a real concern in Vancouver.  But we should be clear about how and why.  Summarizing the concerns of many, The Globe & Mail’s Gary Mason writes of “A crisis in Vancouver: The lifeblood of the city is leaving.” As I noted previously, scares about the depopulation of Vancouver are easily dismissed by examining migration and mobility figures.  Both the City and the Metropolitan Area of Vancouver are growing, not declining.

So just who are we talking about as the lifeblood of Vancouver?  For that matter, what are we talking about as Vancouver?

Let’s start with the latter question.  The City of Vancouver, of course, lies at the heart of the Metropolitan Region of Vancouver.  Should we be concerned about anyone leaving the City of Vancouver?  Maybe.  But if they’re just crossing Boundary Road to go live in Burnaby or even catching the SkyTrain down to Surrey, it doesn’t seem like that big of a deal.  Indeed, to stick with the metaphor, if Vancouver is the heart of Metro Vancouver, so long as our lifeblood keeps flowing in and out and all around the larger region, we shouldn’t have a problem.  That’s kind of what we want it to do. The bigger problem, it seems, is if our lifeblood is leaving the region altogether.  This suggests we should be most concerned with patterns of migration and mobility pertaining to Metro Vancouver as a whole.  Or maybe it’s worth keeping an eye on both Vancouvers: City and Metro Area, but keeping in mind that different issues are involved with each.

So who are we talking about as lifeblood?  After all, both the City and Metro Area just keep getting bloodier and bloodier as they grow in size.  Gary Mason tells us to pay special attention to those in their 20s and 30s.

 For many young adults, however, the city increasingly represents a place of which they no longer can afford to be a part. Consequently, Vancouver faces an almost existential threat; what happens when the lifeblood of any community, those in their 20s and 30s, decide to leave? … Frustrated over the inability to find even a condo at prices their salaries can accommodate, many young people are saying goodbye.

Really?  Are more of these young folks leaving than coming?  Using Canadian Census data, I ran the numbers for the most recent time period I could get a handle on: 2006-2011.  There’s a simple technique in demography of gathering age-specific net migration figures by breaking down the population by age-group in each year, aging them forward (giving them babies at appropriate fertility rates and killing them off at appropriate mortality rates – here I used age-specific death rates for Canadians in 2008), and then seeing how many of them you’d expect to be around.  If you subtract this figure from the actual figure you see in the next census, you get an age-specific net migration rate (expressed below in percentage form).  Here’s what I get for both City and Metro Region:

Van-Net-Mig-2006-11

For the greater metrolitan region, Vancouver’s lifeblood doesn’t seem to be going anywhere.  Many more people in their 20s and 30s are pouring into Vancouver than are leaving.  This is an important point to keep in mind, if only to set the record straight about the implications of the region’s unaffordability.

What about the City of Vancouver?  For those in their late teens and early twenties, the phrase “pouring in” is simply inadequate.  We have a tsunami on our hands.  Why?  Probably in part because Vancouver is a university town – in fact it’s MY university town.  But also because central cities tend to attract young people, provide them with jobs, and provide the diverse kinds of housing stock able to support them.  It’s true that the balance shifts between the City of Vancouver and the rest of the metropolitan region as people age.  The City of Vancouver is a net loser for people in their thirties and beyond.  No doubt many of them are looking for more spacious and affordable housing, and they would stay in the City if they could find it there.  But crossing the border into Burnaby, or down to Surrey, or out to Coquitlam, seems like pretty normal circulation.  The type experienced by central cities everywhere (yes, I checked, and Toronto experiences it too).

2016 is upon us, and soon we’ll have a new census.  We’ll all be eagerly awaiting the results (well, anyone who has bothered to read this far, anyway).  Who knows?  It’s possible patterns will have shifted by then.  But it’s also worth holding on to a healthy dose of skepticism.  Vancouver has at least 99 problems associated with housing affordability, but losing our lifeblood ain’t one.


Zika in Perspective (not so scary)

Having a baby is scary enough, for oh-so-many reasons.  But the recent Zika virus explosion has made it even scarier.  How scary should it be?  The Washington Post has an article on the difficulties of confirming Zika-related microcephaly cases in Brazil.  As of last week, 4,180 cases had been reported since October, but few had been confirmed by experts.  So a sample was explored in depth, and…

After experts scrutinized 732 of the cases they found that more than half either weren’t microcephaly, or weren’t related to Zika.

To be precise, just 270 cases of the 732 examined seem to be confirmed as related to Zika or something similarly infectious.  If that ratio holds, of the 4,180 cases reported since October, only about 1,542 will prove substantiated.  A bit less scary… but still a big number.

Except, in the context of Brazil, that’s actually not a big number at all.  I can’t readily find births data covering the period from October, 2015 to the present.  But I can easily find data on how many infants there were in Brazil in 2010.  Not a perfect proxy, but close enough for a rough estimate.  There were 2,713,244 infants, implying at least that many births.  Now THAT is a big number, and a good reminder that Brazil is the 5th largest country in the world, just two spots behind the USA.

The estimate from 2010 is a year’s worth of births, of course.  To make that comparable with reports from October, let’s make a heroic assumption that we’ve got about four months worth of reporting in (October through January).  So how many Brazilian babies would likely be born in four months time?  904,415.  Still a very large number.  What percentage of those babies look like might have Zika related microcephaly?

I get somewhere between 0.17% (using the ratio of confirmed cases) to 0.46% (using reported cases).  That’s between 1.7 cases per 1,000 births to 4.6 per 1,000 births.  Less scary.

But again, everything is scary to prospective parents.  What helps, perhaps, is perspective.  The pre-existing infant mortality rate in Brazil is estimated to be 19 deaths per 1,000 births (according to Population Reference Bureau data).  By contrast, the infant mortality rate in the USA is an estimated 6 deaths per 1,000 births, and for Canada, 4.8 deaths per 1,000 births.

These kinds of statistics lead me to ask: why don’t Canadians have a travel warning issued for pregnant women (or for mothers of infants) visiting the USA?  After all crossing the border to spend a year in the USA would appear to add an additional risk of dying of an extra 1.2 deaths per 1,000 births.  This is pretty close to the low end 1.7 cases of Zika-related microcephaly per 1,000 births we might be seeing in Brazil.

Not really so scary after all.

Of course there are two caveats here.  1) It would appear this is just the start of the Zika outbreak, and knowledge about its size and ultimate effects remains in flux, as witnessed by the shifting case count, and 2) We shouldn’t really equate the risks of microcephaly (Zika-related or otherwise) with the risks of infant mortality, as suggested by this CBC report.

Gateway Vancouver

Metro Vancouver is a great source of data.  I’ve put together this little figure drawing upon their net migration dataset from 1996-2013* to get a sense of how different components of net migration influence the region.  Obviously, the overwhelming driver of growth for Metro Vancouver comes from international migration, and it has for some time.  Vancouver is a gateway metropolis into Canada.  By contrast, net provincial migration rises above and falls below zero like the tides (perhaps in response to the fortunes of oil next door).  Net intraprovincial migration is consistently negative.  More people leave for other parts of BC than arrive from the rest of the province.

NetMigMetroVan

On the face of it, this seems consistent with the gateway story.  Immigrants flood into Metro Vancouver, from whence people gradually trickle outward to the rest of the province.  But this kind of data has also been used (especially when it works in conjunction with the outward tide of interprovincial migration) to suggest that unaffordability in Vancouver, particularly of single family houses, is driving everyone away.  More often, the stories are anecdotal: a doctor leaves in a huff ; a public relations professional moves to Squamish; a Calgary management consultant refuses an offer to move to Vancouver.  But sometimes arguments are made, and vague statistics leveraged, suggesting that housing prices are pushing everyone out of Vancouver.

Taking all forms of migration together, that story simply doesn’t work.  Quite obviously, too many people are still coming in to Vancouver to claim that everyone is being pushed out.  But there is another kind of story that can be told: housing prices (or other forces), linked perhaps to particular lifestyles or standards of living, are pushing some types of people away.  Professional people.  Entrepreneurial people.  Young people.  People with kids.  People from the area.  People who aren’t immigrants.

Housing prices and rents really are very, very high.  And some of these stories may even be true (though I suspect most aren’t).  One way or another, I hope to look into many of them in the future (consider this part I).  But for now it’s worth noting that any story focusing on the loss of some types of movers and migrants runs the risk of implicitly or explicitly devaluing the many others who keep arriving.


*- yearly data compiled from BC Stats and Statistics Canada data, including immigration records and use of tax records to estimate intra and interprovincial migration, which is kind of neat!