The Million-Dollar Mansions and Migrants of Metro Vancouver, 2011 edition

Just who lives in all of these million-dollar and above properties concentrated in Metro Vancouver? I don’t yet have the micro-data for 2016 that would allow a deep investigation. But 2011? That I can do!

Here I’m playing around (once again) with the Canadian Census Analyser maintained by CHASS at U Toronto (access through UBC Library). All my analyses were run on-line: they’re basically just custom cross-tabs from the NHS (our replacement for the long-form census in 2011), sorting by characteristics of household heads and weighted according to sample weights. Metro Vancouver is about as low as I can get as a geographic level for microdata without getting special permissions (and tiny sample sizes).

First I wanted to get a breakdown of who was living in million-dollar homes in 2011 by age and where they lived five years before (2006). This gives us a sense of both who’s lived in these places for awhile, and who bought recently. Note: Even though I refer to these as “mansions” below, I don’t actually know what they look like or even how big they are – I just know they were valued by their owners as over a million dollars. Still a fair amount of money in 2011! (Also worth noting: in 2011 we were still coming off of the Great Recession, which only gently brushed Vancouver…)

Mansions-Migrants-1-AgeLocation

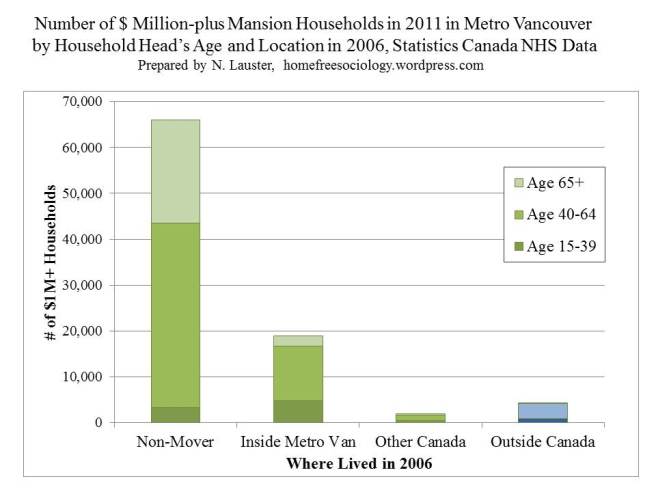
Hey, what do you know? The vast majority of households living in million-dollar homes in 2011 had been living in their places since at least 2006. A good proportion of these householders were older – likely retired – but not actually the majority. Most were still clearly working age. The next biggest group of households are those who moved into their current place from elsewhere in the metropolitan area of Vancouver. Very, very few moved into a million-dollar mansion from someplace in Canada outside of Metro Vancouver. Seriously: who could afford to do so? Most other cities in Canada are far cheaper than Vancouver. So a lot of what we see in terms of people moving into million-dollar mansions around Metro Vancouver are locals trading homes with one another.

What about migrants? People who moved to Metro Vancouver from outside Canada are definitely there, but overall in 2011 they represented a relatively small proportion of million-dollar mansion owners. Even in terms of new buyers, they represent less than a quarter of million-dollar mansion owners who moved in between 2006 and 2011. That’s big enough to have a substantial effect on the market! But by no means did most purchasers of million-dollar properties in Metro Vancouver come from away. Most buying in the years prior to 2011 were already locals.

Of course, people have been flocking to Vancouver from all over the world for quite some time, so even if they’d been in Vancouver for awhile by 2006, they still might’ve been born elsewhere. We can break down million dollar mansion owners by where they were born as well as by where they were five years ago. Here’s what that looks like:

Mansions-Migrants-2-Pob-Location

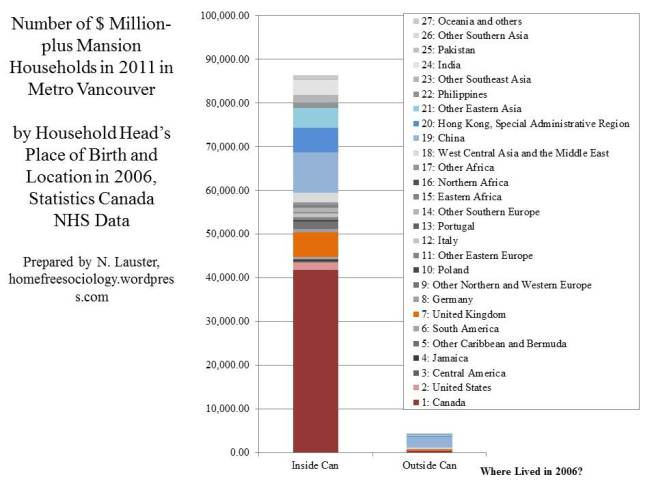
No surprise: the modal million dollar home owner was born in Canada in 2011 (shaded red above), with another big chunk born in the UK (orange). I put Americans (like me!) in pink, just for fun. The other large group of million-dollar home owners I highlighted come from Eastern Asia (in shades of blue above). Why are so many million-dollar homes in Vancouver owned by immigrants? Some of this, no doubt, has to do with the “skill” and wealth-based selection processes of the Canadian immigration system. But another important part of the story – especially for those in blue – probably involves the enormous real estate fortunes being made all around the big cities of the Pacific Rim (where most East Asian migrants are coming from). A lot of East Asian immigrants to Vancouver are probably housing lottery winners in their countries of origin, and Vancouver property looks relatively cheap from many places across the water! Wealthy East Asian buyers account for over half of those moving into million dollar homes directly from outside of Canada between 2006 and 2011.

But are the majority of migrants moving to Vancouver from Eastern Asia (or elsewhere) moving into million dollar homes? Not so much. Here I break down the proportion of householders living in million dollar homes by place of birth and where they lived five years prior to the 2011 census.

Mansions-Migrants-6-Percent-Pob-Location

Most residents of Metro Vancouver (born immigrants and native-born) live in more modest dwellings, rather than million-dollar mansions. Of note: for those born in Canada and living in Canada five years prior to the 2011 Census, just under 10% lived in million-dollar mansions. Many immigrant groups, but by no means all, exceeded this figure. Those born in the USA, the UK, South and Western Africa, China, Hong Kong, and other parts of East Asia all fell in the 15%-20% range for the proportion of household heads living in million-dollar plus homes. Of course that means the vast majority of migrants, over 80% in most cases, were NOT living in million dollar mansions in 2011.

What about people who moved to Canada from another country in the last five years? Interestingly, this includes a fair number of Canadians. Something to keep in mind when we talk about “foreign wealth!” At any rate, those who’ve recently lived overseas tend, overall, to be even less likely to live in a million dollar mansion than those who’ve lived in Vancouver for more than five years…with two notable exceptions: China and Pakistan.

I don’t actually know what to make of Pakistan – except that it might just be a small sample-size issue. The same sample-size issue probably helps explain why Jamaicans look so wealthy – though it’s possible I’m just missing all the wealthy Jamaican neighbourhoods in Vancouver. For China, it does appear that recent migrants are more likely to live in million-dollar mansions than earlier (pre-2006) migrants. This accords with broader perceptions that Chinese migrants to Vancouver are increasingly selected for wealth. That said, the vast majority of new immigrants from China (over 80%) still weren’t living in million-dollar mansions in 2011.

Now that we’ve got some general idea of the distribution of housing wealth in Metro Vancouver (from five years ago anyway), I’ll try and return to an enduring mystery in my next post: what’s up with low-income households owning million-dollar mansions?


Lottery winners of the Pacific Rim

Sociologist Harvey Molotch famously suggested that cities should be understood, first and foremost, as Growth Machines. The big takeaway is that the urban political class and overlapping landholding class tend to agree with the basic idea that growth is good and should be encouraged. For the landholding class, in particular, growth is good for their bottom-line. Land value goes up as more and more people are encouraged to concentrate in the same place (particularly if they’re wealthy people). So big landholders, who also often drive local politics, actively and aggressively push for growth. They’re aided and abetted by numerous other parties, including local media. Along for the ride in more or less passive fashion are local home owners, many of whom might be understood as “lottery winners” as they watch their property values soar. Sound familiar, Vancouver?*

Of course, “lottery winnings” from housing wealth are only really available for people to tap into if they a) sell their housing and move somewhere cheaper, or b) avail themselves of complicated financial instruments akin to mortgages. But this sets up a really interesting dynamic, especially with respect to immigration. People can move from a “lottery winning” locale to a much less dynamic real estate market and pocket a lot of change along the way, arriving as a wealthy immigrant. In places with less developed mortgage systems, this pattern can be further complicated, as sellers will have accumulated few loans against their housing before selling (setting aside, for the moment, those who don’t own property).

What does this imply for immigration around the Pacific Rim? Much of immigration takes place to and from the big “gateway cities” of the Pacific Rim. These gateway cities tend be very expensive markets locally because the flow of international migrants drives much of real estate dynamics. Partially as a result, local prices can drift upward from what might be expected by local incomes. But gateway cities are also quite diverse in terms of the success of their local growth machines. As a result, some “lottery winners” are far wealthier than others. By selling their home in an expensive growth machine and moving to a cheap one, migrants can cash in their lottery winnings.

Where should we expect this to be a feature of immigration streams in the Pacific Rim?

I recently stumbled across Numbeo, providing crowdsourced estimates for property prices by square meter of size (as well as rents, etc.) for cities around the world. I still have a lot of questions about this data (and I’m more than happy to entertain critiques!), but they seem quite transparent in their methods, and I can see their stuff is already being used in (forthcoming) academic articles, so it seems like worthy play material. Using their estimates for property prices (in Canadian dollars), I put together the following comparison:

Pacific-Rim-Comparison-Price

I’ve highlighted Vancouver in blue as a big gateway into Canada. Of note: when it comes to the Pacific Rim, anyone selling their home to the left of Vancouver before migrating to same could arrive with a great deal of wealth, especially if they’re moving from a city centre! Vancouver looks cheap to arrivals from Hong Kong, Singapore, Beijing, Shanghai, Tokyo, Shenzhen, San Francisco, Seoul, Sydney, and even (to some extent) Taipei. “Sell your place, move to Vancouver, and get rich!” could also work at least moderately well for arrivals from London and New York City.

On the whole, this provides some important evidence to contextualize patterns of immigration into Vancouver. Positioned as a gateway into Canada from the Pacific Rim, we should expect a lot of East Asian immigrants to arrive quite wealthy just from selling off their homes in their city of origin! That’s setting aside a host of related issues (e.g., Canada’s selective immigration policies – including its relatively terrible investment class program, China’s selective emigration policies, intergenerational concentration of wealth in single children) that favor wealthy immigrants, as well as others (e.g., China’s capital controls and less developed mortgage system) that complicate the story.

Recent (and generally good, I think!) reporting in Vancouver has emphasized the crooks among Vancouver’s wealthy immigrants – and by all means, go get them! But this has a tendency to obscure how you don’t have to be crooked to arrive in Vancouver with money to spend. You just have to be lucky. And there are lots of real estate “lottery winners” scattered around the Pacific Rim, including many homegrown right here in the Lower Mainland.

Lots more to think about, but I’d love to hear more about a) the Numbeo data! and b) how this maps onto people’s thoughts about Vancouver’s role as gateway to the bustling growth machines of the Pacific Rim.


*- This dynamic is viewed as providing home owners a material interest in siding with growth machines. Of note, Molotch’s analysis is pretty solid with respect to North American cities at their founding and through most of the Twentieth Century, and it still mostly holds for central cities. But anti-growth coalitions began to arise and drive metropolitan politics pretty quickly, most dramatically in the suburbs, where NIMBYism and exclusionary policies are pretty much the norm. Lots to say about that, including both that “material interest” can be interpreted quite flexibly and it’s not the the only thing driving NIMBYs, but I’ll set it aside for the moment. How do Growth Machine stories explain other places? Growth Machine analyses are often received critically in Europe, where they don’t seem to work as well, but have been largely embraced – at least in modified form – across much of Eastern Asia. In China in particular, the political economics of urban growth have received a great deal of attention, in particular the collusion between local politicians and local developers (paywalled examples here and here, or see books like Li Zhang’s excellent In Search of Paradise: Middle-Class Living in a Chinese Metropolis for a view from the ground). But less attention has been paid to the more or less passive “lottery winners” of Eastern Asia’s rapid urban growth. In the context of China, of course, urban growth was joined to the privatization of housing, producing many double-winners (as well as many new losers, especially rural migrants to cities). See Forrest & Izuhara (sadly pay-walled) for a really nice view of how intergenerational housing wealth accrues – or fails to do so – in Shanghai. It’s one of my regular teaching tools!

Why Keep Adding Empty Bedrooms?

I’ve been playing around with different ways to visualize bedroom data, and here I thought I’d just add one more, combining the data on housing stock by number of bedrooms by what (minimum) percent of bedrooms must be going empty for Canada and Metro Vancouver. I think this best demonstrates how Metro Vancouver has traded off its 3BR “Family Size” units for 5 BR “Super Size” units and bedrooms that largely go empty.

Bedrooms-Stock-by-Empty-2011

I won’t re-hash my previous two posts, but this is largely because of zoning forbidding the construction of townhouses and related forms of “family size” stock that could more efficiently use all the land currently being taken up by “super size” mansions. It shouldn’t come as a surprise that bedrooms are more often put to use in Vancouver than across the rest of Canada, and often times people are being creative in making the best use of mansions they can. But why not let other kinds of housing into Vancouver’s “Great House Reserve” to fill in the growing gap we’re seeing in “family size” units?

[UPDATE: My bedroom antics have now made their way into the Vancouver Sun and The Province along with my mug! And also onto Roundhouse Radio]

Empty Bedrooms?

I just can’t stay out of peoples’ bedrooms.

In my earlier post I noted how Vancouver is distinct in the degree to which it’s been trading more bedrooms within housing units (“Super Size” mansions!) for separate housing units of “Family Size.” This is an important part of the story of why Vancouver families feel like they’re being priced out of owning a home (for renting see here). When it comes to bedrooms, Vancouver really does have a “missing middle.”

With this post, I want to explore how bedrooms are getting used. Of course, we don’t have direct information about how people use bedrooms. But we can compare number of bedrooms to household size and get some sense of how empty or crowded rooms are likely to be. We can also compare bedrooms to household structure to get some sense of how creative people are being in filling up dwellings. More on that in a moment. First, let’s count some bedrooms!

Here I’m counting bedrooms as “used” if there’s at least one household member per bedroom. I count them as “extra”, or empty, if they remain left over after after all household members have been given a room. Finally, I count a bedroom as “crowded” if more than two household members would have to share it. Below I count number of bedrooms by unit size.

Empty-Bedrooms-2011

Once again, one thing that really jumps out here is the extent to which Vancouver is unusual in how many bedrooms are locked up in five bedroom, “Super Size” dwellings. Metro Vancouver is way outside the norm for Canada. By contrast, Metro Van has relatively fewer of the “Family Size” three bedroom dwellings that seem to be the workhorse for most of the nation.

What about the counts? I count 459,994 extra bedrooms across Metro Vancouver, estimating that about one-fifth of bedrooms remain empty. Compare this to the 66,719 unoccupied dwellings counted across the metro area, constituting just over one-in-twenty housing units. There are other, less conservative measures of empty bedrooms out there,* but any way you look at it, we have way more empty bedrooms than empty homes.

What’s also striking, though not especially surprising, is that the proportion of “extra” bedrooms rises with the total number of bedrooms in a dwelling in basically a linear fashion. So “Super Size” dwellings tend to have more empty bedrooms. By contrast, smaller dwellings have very few (those in occupied studio and 1BR dwellings, by definition, are always using all of their bedrooms). To put it differently, in Vancouver we have nearly twice the proportion of bedrooms remaining empty in 5 BR+ “Super Size” dwellings (28%) as have do in much smaller 2BR “Family Size” dwellings (15%). Again, this isn’t really a surprise: smaller dwellings are much more efficient ways to house people.

BUT given that we’ve reserved so much land for big, land-consuming houses, and given that so many of these have been turned into “Super Size” 5BR+ mansions, how are the residents of Vancouver dealing with the situation? Are they getting creative?

In my book, I detail the situation of one of my interviewees, a single mother who rented a mansion in a wealthy Vancouver neighbourhood. She couldn’t afford the place by herself, so she rented with a friend who was also a single-mother. Even together they still couldn’t afford the rent on their own, so to get by they also each kept boarders – mostly international students. I applauded the extremely creative way this mother figured out a solution to the housing situation she faced, re-purposing the “Super Size” mansion she lived in to make it work for her and a host of others.

How much of this creativity goes on in Vancouver? Let’s explore household type by bedrooms for residents of Canada at-large and Metro Vancouver in particular.

HHType-by-Bedrooms-2011

Here I’ve separated out in shades of drab gray the more boring kinds of households that we generally expect to find, including living alone, or living with a partner and/or children in a simple census-recognized family household. I’ve highlighted in color all of the more intriguing household combinations, including roommates, extended families, and everything in-between. Relative to the rest of Canada, Metro Vancouver demonstrates a lot more creativity in nearly every category, but it’s especially interesting how much creativity we see in filling up those “Super Size” mansions. Over 40% of residents are living in some kind of creative household, quite a bit higher than the 30% we see in the rest of the country. Lots of this may reflect the ethnic diversity of the Metro Vancouver area, and cultural practices more supportive of extended family living. But there’s clearly a lot of creativity going on in dealing with our housing shortage as well.

To sum up, we could be building in a better way to house people instead of setting aside so much land for mansions, but we also see creative responses to the housing stock we’ve got.


*-Empty homes have gotten a LOT of attention. Empty bedrooms less so. A previous analysis that gained some media attention in Vancouver estimated there were 800,000 empty bedrooms across the Metro Area. But the analyst assumed all couples shared a bedroom. I take a more conservative and simpler approach here that counts bedrooms as empty only if they exceed the number of people in a household. In other words: if everyone in a household gets their own bedroom, what’s left over? Adopting sharing rules definitely boosts estimates of empty bedrooms.

Too Many Bedrooms, Not Enough Housing?

So I’ve been playing around with bedroom data.

Why? Because despite Pierre Trudeau’s famous dictum, “There’s no place for the state in the bedrooms of the nation,” we still collect data on how many bedrooms people have. And I’ve found some interesting stuff going on in peoples’ bedrooms!

Following a theme, one thing that’s really intriguing is comparing housing stock by number of bedrooms across Canada’s Big Three Metropolitan Areas. For a rough bedroom comparison, we can divide up housing stock into “Economy Size” units (studio & 1BR), “Family Size” units (2BR to 4BR), and luxurious “Super Size” units (5 BR+). Let’s look at Montreal, Toronto, and Vancouver (and the rest of metropolitan Canada) across the past twenty years, comparing 1991 to 2011.

Bedrooms-by-Metro-1991-2011


Most housing stock is clearly in the “Family Size” category, containing 2 to 4 bedrooms. Montreal and Toronto look pretty similar in this regard, with about three quarters of their housing stock stably “Family Sized.” But look at Vancouver! Here only about two thirds of housing stock was “Family Size” in 1991, and as a proportion of housing stock it’s been dropping fast!

When it comes to bedrooms, Vancouver really does have a “missing middle” problem. What’s taking the place of the missing middle? Tiny “Economy Size” shoe box apartments in the sky? Not really. Metro Vancouver has a lot of those, but they’ve also been on the decline as a proportion of housing stock since 1991.

What about that “Super Size” housing? Hold on! That’s where Metro Vancouver’s been growing! In fact, it’s got way more giant mansions than any other metro area in Canada.

But what about the housing crisis? What is Vancouver doing adding all of these crazy giant mansions? Good question!

No surprise, mostly what we’re adding when we’re adding 5+ Bedroom housing units is detached single-family houses. In many cases, especially in the City of Vancouver, these are simply “Super Size” mansions replacing more modest “Family Size” houses. Here are the recently built (and occupied) housing units added in the five years prior to the 2011 Census. Notice nearly all new 5+ Bedroom housing units are single-family detached houses – or houses with a secondary suite (showing up as apartments or flats in a duplex). Why are we adding so many more of these? Effectively, it’s because houses are the only thing builders are allowed to construct on so much of our residential landscape. So big houses are mostly (over 80%) what takes up our residential land base. Welcome to Vancouver’s Great House Reserve!

Recent-Van-Stock-by-Type-Bedrooms-2011

Of note, there are also a fair number of detached houses being added in “Family Size” housing stock, but overall the “Family Size” category is far more diverse in dwelling type, with lots of row houses and apartments in both low-rise and high-rise buildings (with the latter categories dominating the 2BR category!) In effect, there are LOTS of different structures that can support “Family Size” housing, most cheaper than detached houses because they use less land. But the cheaper kinds tend to be forbidden across the majority of our residential landscape. So relative to other metropolitan areas, we’re replacing “Family Size” with “Super Size.” Why? Because despite the progress Vancouver has made, we’re (still) reserving a whole lot of land for millionaires. So it’s no surprise that their super sized mansions are proliferating.

Are all of our bedrooms getting used? I’ll come back to that in another post.


A Tale of Three Cities

Canada is a BIG country, with a lot of land. But it’s also an urban country, with most of its residents sticking to cities and towns (and suburbs) hovering just over the border from the United States. Over one third of Canadians live in Canada’s three big cities: Toronto, Montreal, and Vancouver.

This is interesting for all sorts of reasons, but especially so for a housing scholar, because of the differing routes to urbanization taken by these cities. Their housing stocks, and correspondingly the way people live, are all quite distinct from the rest of Canada, and also distinct from one another. Here I’m just going to look at housing stocks in terms of dwelling types – i.e., what kind of building do you live in? Of note, I’ll also be treating the term “city” as inclusive of “metropolitan areas” as a whole, which is what we’re generally talking about when we say “Canada’s three big cities” (this is important, of course, because the City of Vancouver as a municipality, for instance, contains less than a third of its metropolitan population).

So how do people live differently in Toronto, Montreal, and Vancouver from the rest of Canada and from one another? Let’s look at some data from Statistics Canada.

Structure-Metros-2016-B

The big difference compared to the rest of Canada is that the big three cities have far fewer residents living in single-detached houses. Less than half of residents live in houses in each of our major metropolitan areas, compared to well over two-thirds in the rest of Canada.

But how has each metropolis managed its move away from the house?

Montreal has developed a LOT of low-rise apartment buildings (up to four storeys tall) all throughout its old urban core. The rest of its housing stock looks a lot like the rest of Canada. On the whole, its a charmingly low-rise metropolis.

Toronto has developed a LOT of high-rise apartment buildings (five stories and above), all throughout its old urban core. The rest of the its housing stock looks a lot like the rest of Canada. On the whole, its different mainly in its promotion of big, bustling high-rises.

Vancouver lies somewhere inbetween Montreal and Toronto, insofar as it’s filled its urban core(s) with a combination of low-rise (often older) and high-rise apartment buildings. But it’s also distinct from either city in renovating and re-developing such a large proportion of its stock of single-detached houses, so that a LOT of them contain two or more dwellings (e.g. basement suites).

To some extent, this last strategy speaks to Vancouver’s late-comer status. Montreal and Toronto are both relatively old cities, each having developed a sizable urban core before getting choked off by heavily protected single-family (RS) zoning in the twentieth century. Vancouver didn’t have that much of an older urban core to work with before most of its residential landscape became locked up by zoning. So many municipalities across Metro Vancouver have sneakily re-worked the definition of a “single-family residential” in their zoning by-laws to include a secondary suite – and often a laneway house too – enabling a very “gentle” form of baby-step densification. This is only part of the story of how the big three cities of Canada provide very different models for density and accommodating the move away from single-family detached modes of living.

A related question we can ask is how housing gets distributed across the life course and history. I’ve been playing around with this from a descriptive standpoint, using age-graded distribution of housing.

Age-by-Structure-Metros-2016-B

This is basically the same chart above, but played out across five-year age categories (except for under 15 and over 85, because these are the categories Stats Can gives me). It’s very clearly visible that outside of the Big Three Cities, single-detached houses are the statistical norm in Canada. They become a little less the norm during young adulthood (20-34) and for post-retirement ages (65+), but even so, more than half of the young and old alike live in houses.

For Montreal, the house is not normative – less than half of people in any age category live in a single-detached house. Nevertheless, Montreal demonstrates the same general age-related pattern of house acquisition as we see in the rest of Canada. Young adults and older adults are especially unlikely to live in a house, turning instead to the plentiful low-rise housing (in the case of the young) or newer high-rise housing (for the old).

What about Toronto and Vancouver? In Toronto, just over half of people live in houses across most age groups, but this figure drops sharply for young adults. Strikingly, there’s hardly any decline at all in this figure for older adults. In Vancouver, the figure overall is lower (<40% of people live in houses across most age groups). Nevertheless, the same age-related pattern pertains: though the young move out into alternatives, older age groups tend to hold onto living in single-family detached dwellings. What’s going on? In large part I suspect this is the result of generational shifts. Post-retirees in Toronto and Vancouver are probably transitioning out of single-detached houses like post-retirees elsewhere (Montreal and the rest of Canada) BUT they began their lives with much higher proportions living in single-detached houses than we see for later generations. (Perhaps you’ve heard that houses in Toronto and Vancouver used to be cheaper than they are now?) As a result, older residents in these cities continue to live in a much higher proportion of the detached housing stock than we’d otherwise expect. This also helps account for why many single-family residential neighbourhoods are shrinking!


Do Families Live in Condos?

Controversy recently erupted over a new condominium housing complex being proposed in The Annex neighbourhood of Toronto. Ho-hum, pretty run of the mill situation, except that one of the complainants about the condominium was Margaret Atwood, who actually (and to her credit) responded to the many YIMBYs attacking her on twitter for NIMBYing new housing. A golden media moment!

One of the complaints launched during the ensuing debate was that “condos are not for families.” Now this provides us an empirical question, and one near and dear to my heart. So I went ahead and ran the numbers using appropriately weighted 2011 National Household Survey data. I did this quickly on my first pass, mostly because I was listening to a cranky kid who wouldn’t take his nap in the room next door (in my condo). Here’s what I got and hastily posted to twitter as my public sociology for the evening:

FamilyStatbyCondo-2011

Most condominium dwellers (over 70%) are members of families. So as a first pass, it’s ridiculous to say families don’t live in condos. That said, it is true that condos support greater diversity in household members, including more people living alone or with roommates, than other kinds of tenure arrangements. It’s also true, of course, that people living alone and with roommates need housing no less than families.

What do I mean by saying other tenure arrangement? Condos, of course, are a legal category of ownership, not a type of building. Towering apartment buildings can be condos, but so can low-rises, rowhouses (like mine), and even single-family detached houses. Condo units are mostly split – pretty evenly – between the first three of these housing types, covering about 90% of condominium units.

But by the time I posted, the complaint had already turned away from ALL condominiums. The real problem is the NEW condos. New condos are (no doubt) more expensive, on average, than old condos. And often they’re built to maximize the number of units, minimizing the space in each, to provide lots of 1BR and Studio apartments, which appeal to investors, and relatively few 2BR+ apartments, which appeal more to families. These are all fair complaints. Indeed, a variety of cities (including Vancouver) have taken to mandating inclusion of 2BR+ condo units in many new developments.

So here’s my updated chart. Do families live in NEW condos? NEW 1BR condos? NEW Studio condos?

FamilyStatbyCondo-2011v2.0

The answer is YES! Most NEW condo residents are family members (almost the same percentages as all condo residents). What’s even more striking is that most NEW 1BR and studio condo residents are still family members. That’s even a little surprising to me! But goes to show the adaptive ways people are doing family these days, even if often out of need rather than adventure. Even new 1BR and studio condos are supporting mostly residents who live in families. So if you’re keeping 1BR and studio condos out, you’re also keeping families out.

But once again, and it bears repeating, residents who don’t live in families ALSO NEED PLACES TO LIVE! Along these lines, I also fixed an issue with my first figure, where “Person not in census fam” was treated as non-family. What this category actually represents in the Census is people who don’t live in an “official” census family according to the census (defined as parent-child or partner), but still live with family members. So for instance, siblings living together, or grandparents with grandchildren. I’ve moved residents in those kinds of households down to consider them as part of the “family” category here, because seriously… those are still families!

One other note: NEW = built in the last 5 years (2006 and 2011, for purposes of the 2011 data at-hand)

“Buy a house for my daughter [or] I’m not going to let her marry you!”

Some of the people who I talked to for my book spoke directly to cultural differences in how they saw the importance of buying a house. A Chinese-Canadian interviewee, originally from Hong Kong, thought “Asians” in general were more likely to link home ownership to marriage. As she humorously described it:

They think that before you get married you have to buy a house. They’re like, “Oh, you don’t have money? Buy a house for my daughter [or] I’m not going to let her marry you!”

Of note, in Hong Kong (and across much of urban East Asia), very few people actually live in houses, and lots of people live in various types of public housing (covering about 30% of the population of Hong Kong, for instance). But setting that – and the selectivity of  just who immigrates to Vancouver – aside, the association between partnering patterns and access to housing is really interesting. In fact, changing the setting to Sweden, it was the topic of my dissertation! (See some of my old research here, here, and here)*

At some point, I hope to return to this kind of detailed research in North America. But in the meantime, I can work a quick metropolitan comparison. We all know that buying a house is pretty much impossible for most people in Vancouver. So how does it affect marriage and partnering patterns here, if at all, compared to other metros?

Here’s a comparison of partnering patterns across four big metropolitan areas in Canada, based on 2011 National Household Survey** results:

MetroMaritalStatusbyAge-2011Data

Effectively, Vancouver fits somewhere between Toronto and Calgary. Hardly the position one might expect if access to ownership of a house was really limiting partnerships. On the whole, all three of these major metropoles look pretty similar. But looking carefully reveals that people tend to partner a little later in Toronto, with a greater gap between the late twenties and early thirties, than in Vancouver. By contrast, Calgarians tend to partner earlier, with over half of those ages 25-29 no longer single. Torontonians are also less likely to spend much time in non-marital cohabitations than either Vancouverites or Calgarians. Interesting little differences which I’d guess speak as much to the multicultural mixes of Vancouver and Toronto as to housing conditions (though, as noted above, it might be the interaction between these that really matter!)

How about Montreal? As always, it’s kind of off doing its own thing. Non-marital cohabitation has been a much stronger feature of partnerships in Quebec since the Quiet Revolution, and it really shows up here. (see, e.g. LaPlante 2006). Lots of material for another dissertation, if anyone’s looking for ideas!


*- with apologies for the paywalls – drop me a line if you want access, but can’t get it!

**- basically our best substitute for the Census that year – thanks Harper!

What we talk about when we talk about a “housing crisis”

What do we talk about when we talk about a housing crisis? People doing without any kind of housing? People living in inadequate housing? Crowding together? Spending too much on rent? People struggling to get into home ownership? People not being able to afford ownership of the single-family detached house they always dreamed about?

To me, a “crisis” suggests fundamental needs unmet. But just what’s a “need”? How should this be separated from a “want” or “dream,” if at all? Addressing these questions and trying to figure out how they matter was the subject of my keynote talk at the PartnerLife conference last week in beautiful Cologne, Germany.

I illustrated my talk with my favorite case study: Vancouver. In the process, I ran some numbers to compare how Vancouver is doing relative to other metropolitan areas if we address some of the different things we mean when we talk about a housing crisis. In particular, I was interested less in the kinds of “dream” measures used by organizations like Demographia (oh, it’s painful to even link to them!), and more in the fundamental measures of need (note: I’ve compared rents elsewhere, though I need to update the comparison!).

How is Vancouver, long considered the most unaffordable housing market in North America using Demographia’s single-family detached house measure, doing when we look at homelessness? How about when we look at providing basic standards, avoiding crowding, and insuring affordability?

To answer the first question, we can look at homeless counts. I’ll work on building this measure further, but for now I’ll just compare Vancouver with our near neighbours to the south (Seattle and Portland) and to the east (Calgary). Is homelessness a major crisis here?

The first answer to this question is indisputably: YES. Homeless is a major crisis wherever it occurs, with large effects, for instance, on the risk of dying. But a more nuanced answer, of more use in thinking through solutions and sorting out what’s working, is to consider the relative size of the homelessness crisis. Though it’s far from a definitive comparison, I started looking into this question by comparing homeless count data by relevant population size, across the regions of Vancouver, Seattle, Portland, and Calgary.* Here’s what I get:

HomelessCountComparison-2

Is homelessness in Vancouver a crisis? Yes. But when compared to other nearby metro areas, Vancouver looks like it’s doing better. This is important in terms of judging the response so far and thinking through how to continue dealing with this crisis.

Let’s address the second question: How are we doing in terms of insuring people are living in adequate housing, not feeling too crowded, and not spending too much money on rent? In Canada, we have a nice comparative measure of “core housing need” that gets at these components of housing crisis. Importantly, these aspects of a “housing crisis” remain detachable, revealing, for instance, different sorts of crises between the North of Canada (where the issue at hand tends to be crowding) and the South (where it tends to be affordability). Overall core housing need is worst in the North and on reserves, where we can talk about some serious housing crises. But here let’s just look at how Vancouver is doing by comparison with other metro areas in Canada given the most recent data available.**

CoreHousingNeedComparison

How’s Vancouver doing by core housing needs? Not so great. We’ve got a lot of people feeling the pain of unmet housing need, as defined by Canadian standards. Mostly these are people spending more then 30% of their income on rent. I’ll be the first to suggest that this is a funny standard, but it still indicates a real problem, especially for those at the bottom of the income distribution. At the same time, by comparison Vancouver is not actually the worst Canadian metropolis. The worst is tiny Peterborough, Ontario! What’s going on there? I’ve no idea, though now I’m quite curious (and it might just be the small sample size of the income survey). After Peterborough, Toronto is also worse than Vancouver.

While both homeless counts and core housing needs remain open to critique in terms of their conceptualization and measurement, they’re also the best measures of need we’ve got. As such, I’d argue they remain the best measures of when we’re seeing a real housing crisis. Using these measures, we can see that there are indeed housing crises at play in Vancouver. At the same time, in comparative context we can recognize that Vancouver’s doing much better at addressing these real crises than it’s typically been given credit for.

Why doesn’t it get credit for what it’s doing right? I think the unaffordability of the single-family detached house in Vancouver sucks up a lot of attention. I’ll continue to argue that this is a very BAD measure of a housing crisis. After all, if we want to reduce the size of our ecological footprints, if we want to support our great cities, if we want to combat isolation and obesity, and arguably if we want to sustain our democracies, then we want to discourage everyone from living in single-family houses. This means not everyone can get what they want. But it’s not a housing crisis if everyone still gets what they need. And by that measure, Vancouver’s doing better than most people think, even if it’s still got a lot of work to do.


*- It’s worth noting that the administrative basis for count data here varies between metro region (Vancouver), county (Portland and Seattle), and city (Calgary). I’ve used the relevant administrative data from the 2010/2011 census year as the denominator in each case. This means population has been kept constant for comparison purposes, while the homeless population has been allowed to grow, resulting in a slight underestimate of homelessness per 10,000 people in early years and overestimate in later years. Also of note, King County and Multnomah County are smaller than the metro areas of Seattle and Portland (accordingly). The City of Calgary is relatively co-terminous with its metro area. This could bias overall estimates of relative counts for metro areas. But even if we were to just use central cities (where the populations of Vancouver, Seattle, and Portland are quite similar at @ 600,000) or metro areas, the overall results would still be about the same – there are a lot more homeless people showing up in other nearby cities and metro areas relative to Vancouver. A caution also remains in the possibility for different definitions and methods in each region, particularly with respect to the meaning and coverage of “transitional housing.” Also of note: the big drop observed in Portland between 2011 and 2015 might be worth following up on!

**- the data here come from the CMHC, and are based on Canada’s income survey rather than census data. It’s possible the sample size of the surveys explains some of the variation, and rankings here should be considered preliminary until we get something more definitive, like the 2016 Census data! In past census years, Vancouver and Toronto usually compete in the metropolitan title for greatest proportion in core housing need, and Peterborough tends to be more middle-of-the-road.


Vancouver’s Transformation: from Phoenix to Montreal in under 60!

I can never quite get over just how dramatically the residential stock of Vancouver has transformed away from its former dominance by single-family detached houses. As recently as 1961, proportionately more of Vancouver’s households* lived in detached houses than in Phoenix, Arizona today (well-known for its inescapable sprawl). Less than sixty years later, Vancouver has now toppled both New York and Montreal as the least house-dominated metropolis in North America! That’s a dramatic transformation!

VancouverTransforms-HHs

Above I’ve updated an older figure of mine that made its way into my (award-winning!) book with the newest census data from 2016, when Vancouver definitively displaced Montreal as the least house-dominated metropolis in North America. What’s led to and resulted from this dramatic change in Vancouver’s housing stock? That’s all in the book!

DeathLifeHouseCover

*-UPDATE: I’ve corrected an earlier version of this post where I misleadingly used the word “residents” instead of “households” to refer to the data. The data is for households. Proportionately somewhat more residents live in houses than households, because average household size is larger for those living in houses (Sept 18, 2017).